Diagnostic analytics helps you identify the root cause of a business problem or trend. This area of analytics moves beyond describing what happened and focuses on understanding why it happened. You use diagnostic analytics to dig into your data and answer questions about the reasons behind specific results.
When you want to move from simply reporting outcomes to uncovering the factors driving those outcomes, diagnostic analytics gives you the tools to do so. See how it fits among other analytics types:
Diagnostic Analytics Overview

Definition
Diagnostic analytics helps you understand why something happened in your business. You use diagnostic analytics to move beyond simple reports and start asking deeper questions about your data. This type of analytics focuses on uncovering the causes behind trends, patterns, or unexpected results. When you apply diagnostic analytics, you gather data from different sources, clean it, and then analyze it to find connections and explanations.
You can see the core components of diagnostic analytics in the table below:
Diagnostic analytics stands out in the field of data analytics because it gives you the tools to investigate the reasons behind business outcomes. You do not just look at what happened; you dig into the data to find out why it happened. This approach is essential for anyone who wants to make informed decisions and improve business performance.
Purpose
The main purpose of diagnostic analytics is to help you identify the root causes of business events and trends. When you use diagnostic analytics, you can answer questions like, "Why did sales drop last quarter?" or "What caused a spike in customer complaints?" This process supports better decision-making and helps you solve problems more effectively.
Organizations rely on diagnostic analytics to:
- Understand root causes of business events
- Improve decision-making
- Enhance problem-solving capabilities
- Drive strategic improvements
By using diagnostic analytics, you gain insights that go beyond surface-level data. You can connect the dots between different factors and see how they influence each other. This deeper understanding allows you to take targeted actions that lead to better results. Diagnostic analytics also supports strategic planning by showing you which areas need attention and which changes will have the biggest impact.
You will find diagnostic analytics especially valuable when you want to move from descriptive analytics, which tells you what happened, to a more advanced level of analysis that explains why things happened. This shift is crucial for anyone involved in business analytics or data analytics who wants to drive real change.
Key Features
Diagnostic analytics offers several key features that help you uncover the reasons behind business outcomes. These features make it easier for you to investigate data, test ideas, and find solutions.
- Focus on understanding the reasons behind specific events or outcomes
- Use of techniques such as data mining, correlation analysis, and drill-down exploration to identify underlying causes
- Systematic investigation of data relationships, often involving segmentation of data to isolate issues
- Application of statistical methods like regression analysis to test hypotheses about influencing variables
- Use of tools such as SQL queries and visualization platforms to automate and speed up the analysis process
Diagnostic analytics platforms often include interactive dashboards, advanced filtering, and the ability to drill down into data. These tools let you explore your data from different angles and quickly spot patterns or anomalies. You can segment your data to isolate issues and use statistical tests to confirm your findings.
To use diagnostic analytics effectively, you need certain skills and competencies. These include strong communication, curiosity, problem-solving, and critical thinking. You also need to visualize data clearly and understand how your recommendations affect the bigger picture. Technical skills like SQL, knowledge of statistical languages such as R or Python, and experience with analytics software are also important.
Diagnostic analytics continues to evolve. In fields like healthcare, AI algorithms now improve diagnostic accuracy, and predictive models help forecast patient needs. These trends show how diagnostic analytics adapts to new challenges and technologies, making it a vital part of modern data analytics and business analytics.
How Diagnostic Analytics Works
Understanding how diagnostic analytics works helps you unlock the full potential of your business data. This process involves specific techniques, the right tools, and a clear set of steps. By following a structured approach, you can identify the root causes of business problems and make informed decisions.
Techniques
Diagnostic analytics uses several powerful techniques to uncover why business outcomes occur. These methods help you move beyond surface-level observations and dig deeper into your data.
You can use correlation analytics to spot patterns between different variables. For example, you might find that customer complaints increase when delivery times get longer. Cause-and-effect analytics lets you test if one factor directly leads to another. Statistical modeling helps you predict future trends by analyzing past data. Machine learning takes this further by finding hidden patterns and making your analytics more accurate.
These techniques form the backbone of diagnostic analytics. They allow you to ask not just what happened, but why it happened. When you apply these methods, you gain a deeper understanding of your business and can take targeted actions to improve results.
To carry out diagnostic analytics effectively, you need reliable diagnostic analytics tools. These tools help you collect, process, and analyze data from multiple sources. FineBI stands out as a leading solution in this space.
FineBI supports diagnostic analytics through a self-service platform. You can connect to over 60 types of data sources, including databases, cloud warehouses, and APIs. FineBI makes it easy to integrate data, clean it, and prepare it for analysis. You do not need advanced coding skills to use FineBI. The drag-and-drop interface lets you build dashboards and visualizations quickly.
With FineBI, you can:
- Integrate data from different systems for unified analysis.
- Prepare and process data using self-service tools.
- Explore data visually with interactive dashboards.
- Share insights securely across your organization.
FineBI also offers advanced features like OLAP analysis, real-time filtering, and AI-driven insights. These capabilities make it one of the most effective diagnostic analytics tools for business analytics and data analytics.
Process Steps
A structured process ensures that your diagnostic analytics delivers accurate and actionable insights. You can follow these standard steps to identify the root causes of business issues:
Start by defining the problem. Be specific about what you observe and how it affects your business. Next, gather all relevant data. This includes timelines, related events, and any factors that might contribute to the issue. Use diagnostic analytics techniques to identify the root causes. Finally, develop and implement solutions to prevent the problem from happening again.
Tip: Data quality plays a crucial role in diagnostic analytics. Always clean, validate, and standardize your data before analysis. High-quality data leads to more reliable insights.
You should also address data quality at the source. Fixing issues early prevents bad data from spreading through your systems. Encourage collaboration between departments to ensure everyone works with the same definitions and standards. Use data quality tools to catch errors before they affect your analytics.
Key concepts in data quality include accuracy, completeness, consistency, relevance, timeliness, and validity. These factors ensure that your diagnostic analytics produces trustworthy results.
When you integrate diagnostic analytics with your existing business intelligence systems, follow these strategies:
Diagnostic analytics tools like FineBI make it easier to follow these best practices. You can connect, analyze, and share data across your organization. This approach helps you break down data silos and ensures everyone works from the same information.
Adoption of diagnostic analytics tools varies by industry. Sectors like technology and financial services lead in usage, while government and education have lower adoption rates. The chart below shows how different industries use AI and analytics tools:

You can see that technology and finance have the highest adoption rates. Manufacturing, retail, and healthcare also use diagnostic analytics tools, but at lower levels. This trend shows that as more organizations recognize the value of diagnostic analytics, adoption will continue to grow.
By following these steps and using the right diagnostic analytics tools, you can uncover the root causes of business problems. This process leads to better decisions, improved performance, and a stronger competitive edge.
Applications And Examples of Diagnostic Analytics
Industry Use Cases
You can find diagnostic analytics examples in almost every industry. These applications help you uncover the reasons behind business outcomes and improve your decision-making. Here are some of the most impactful ways organizations use diagnostic analytics:
- In manufacturing, you can analyze production data to identify bottlenecks and optimize processes in real time. Diagnostic analytics helps you track asset performance, predict maintenance needs, and reduce downtime.
- In retail, you can use analytics to understand customer behavior, personalize marketing, and optimize pricing strategies. Advanced customer behavior analysis improves sales forecasting and helps you predict what customers will want next.
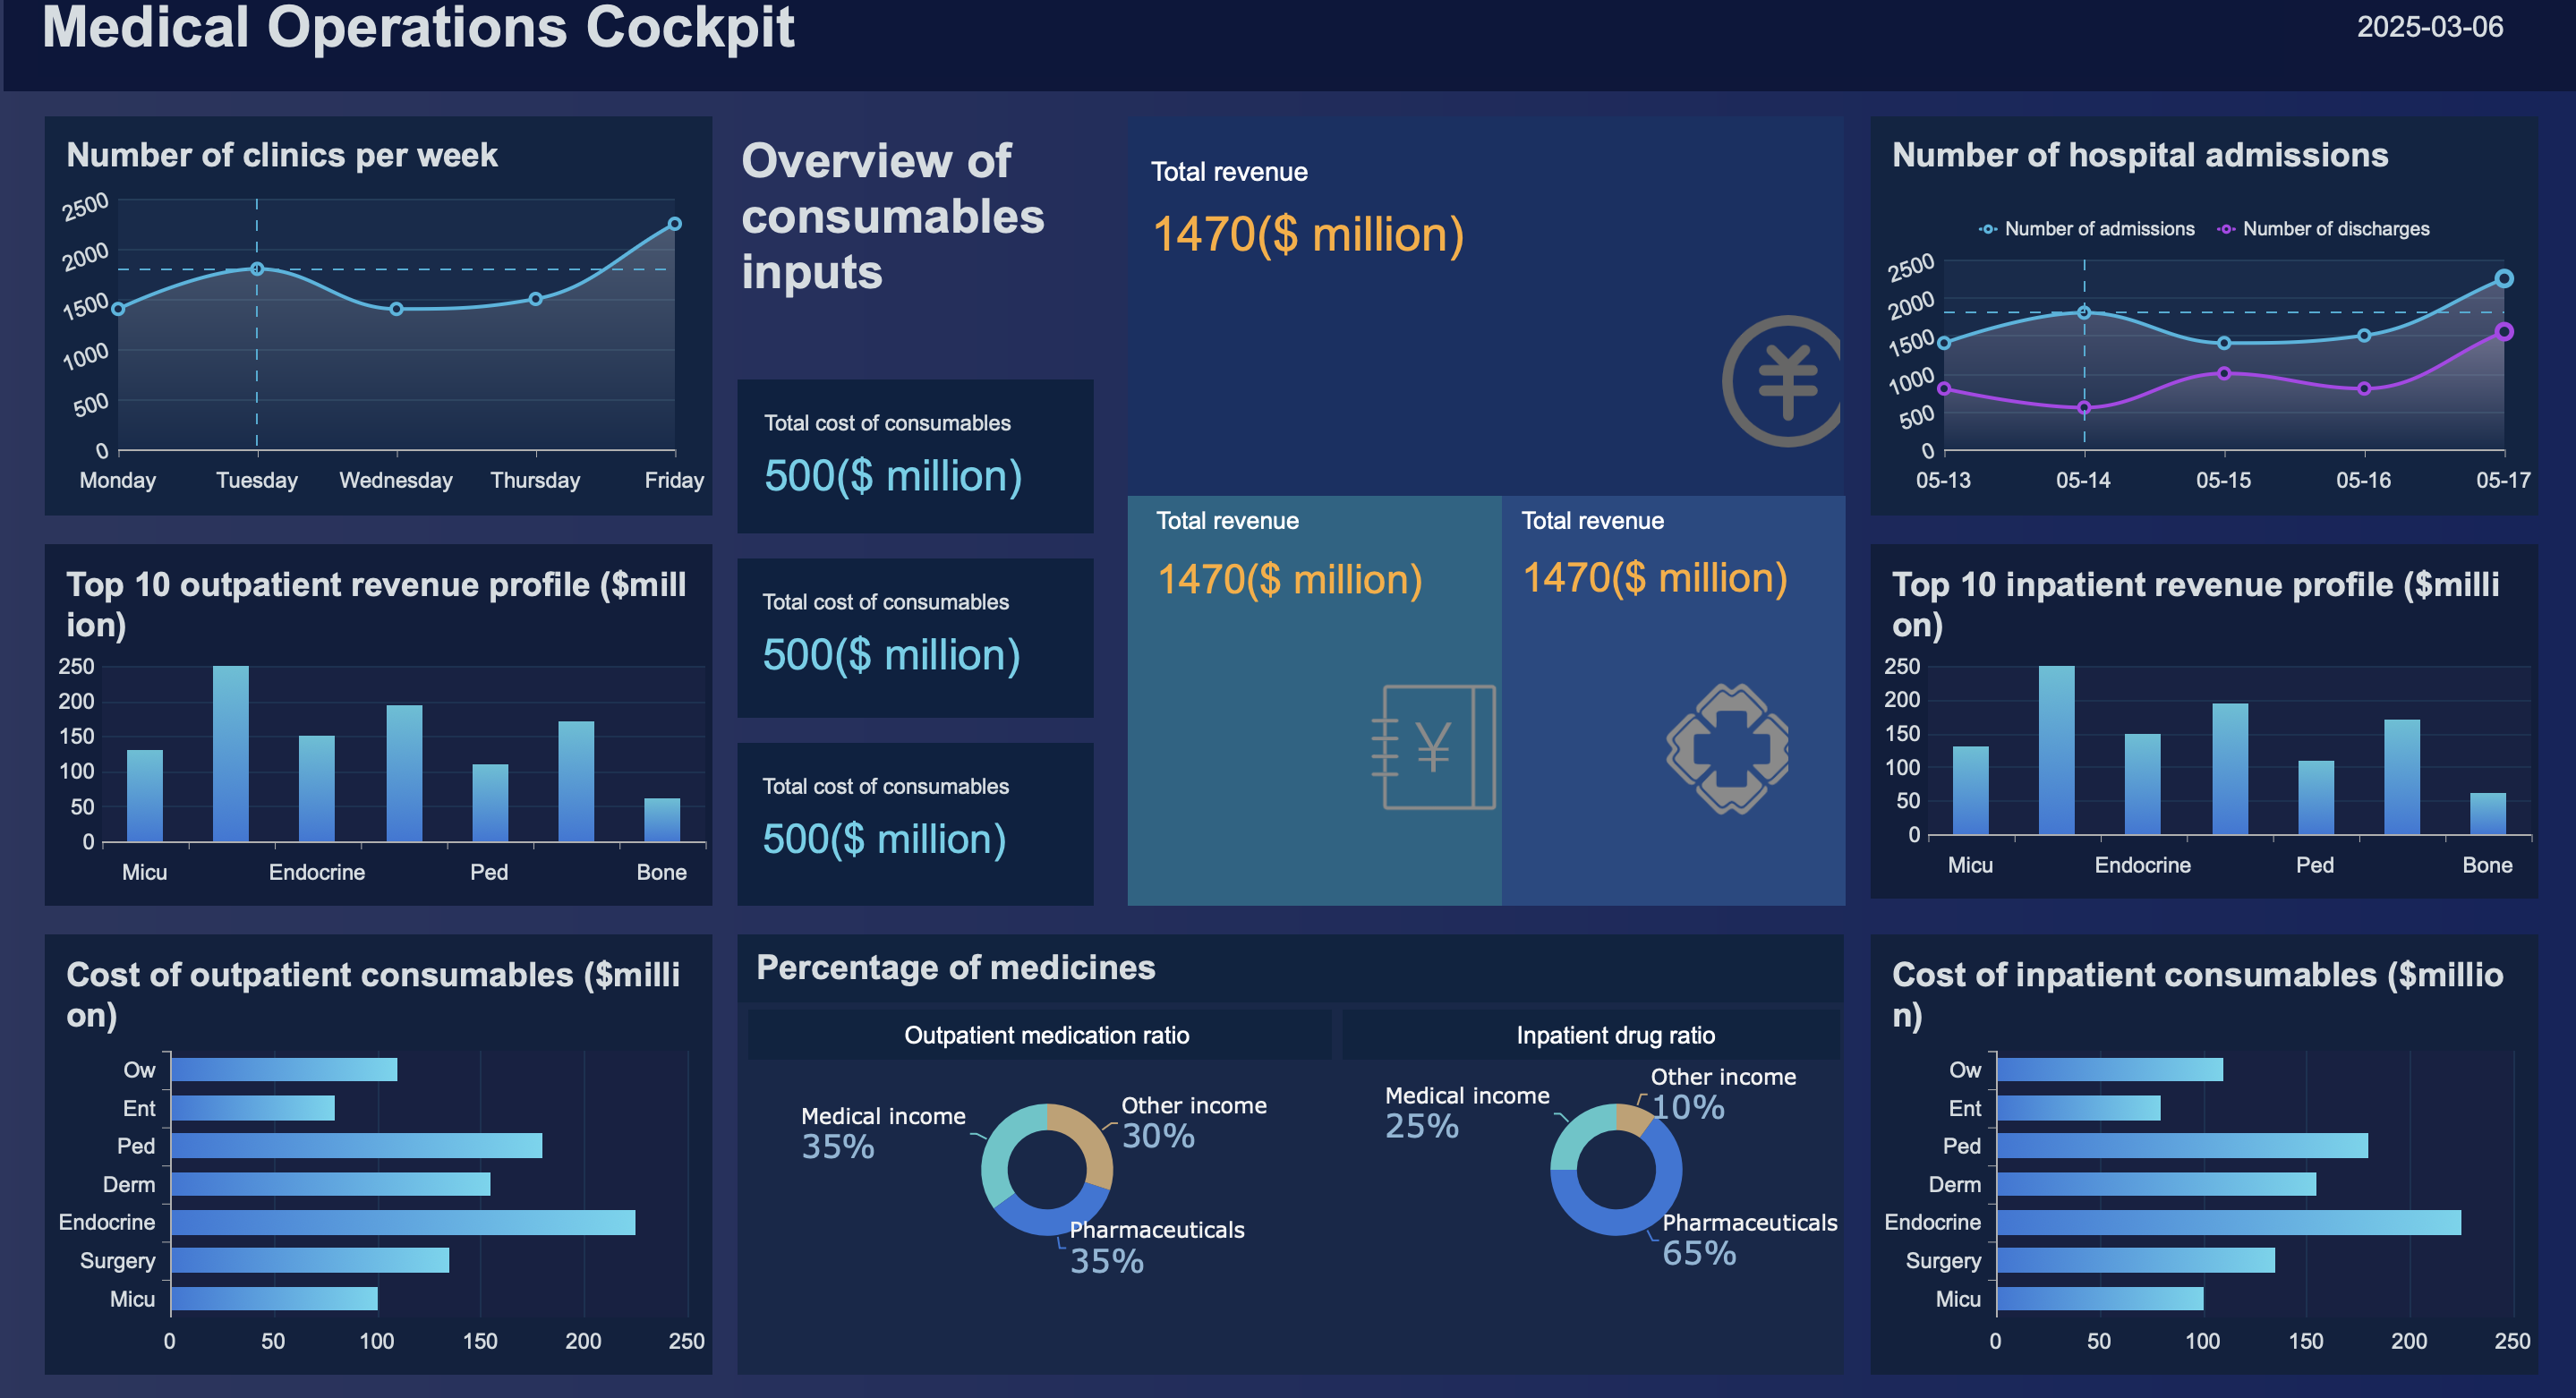
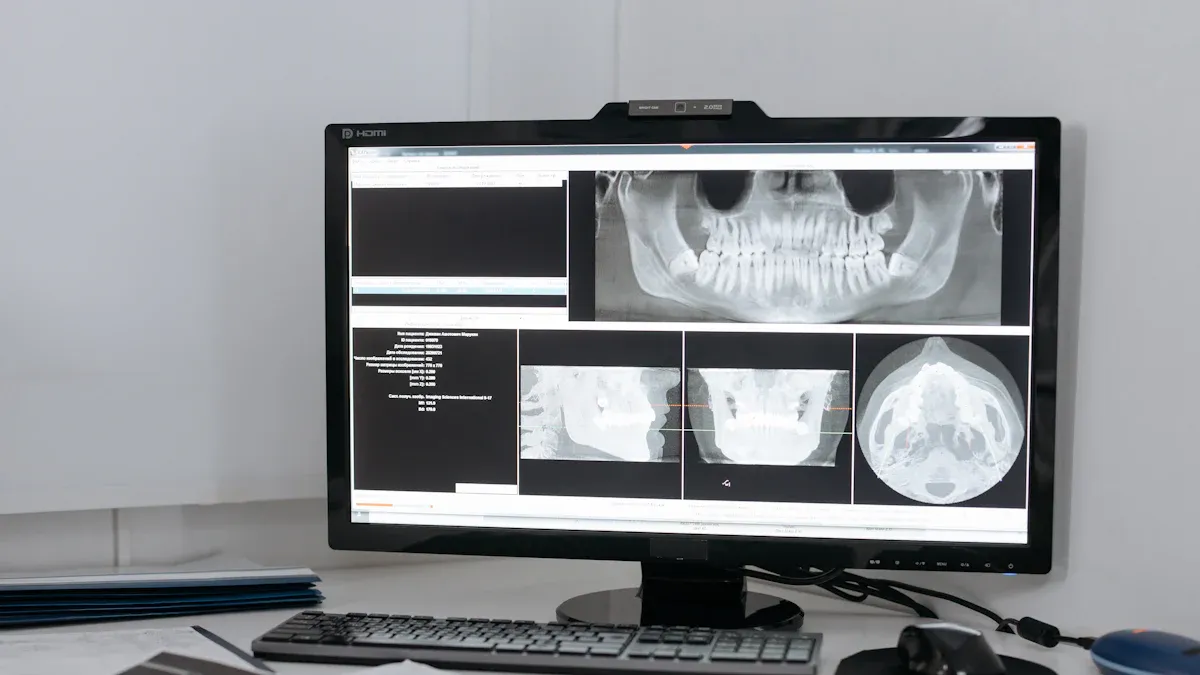
- In healthcare, diagnostic analytics examples include AI-powered diagnostics and medical imaging. These tools enhance diagnostic speed and accuracy, support personalized medicine, and help forecast disease outbreaks.
- In finance, you can use analytics for advanced risk assessment and fraud detection. Financial services rely on diagnostic analytics to quickly detect risky behaviors and protect customer information.
The table below summarizes common use cases across industries:
You must also consider data privacy and regulatory requirements when using diagnostic analytics. For example, healthcare organizations need to comply with laws like HIPAA and state-specific regulations to protect sensitive patient data.
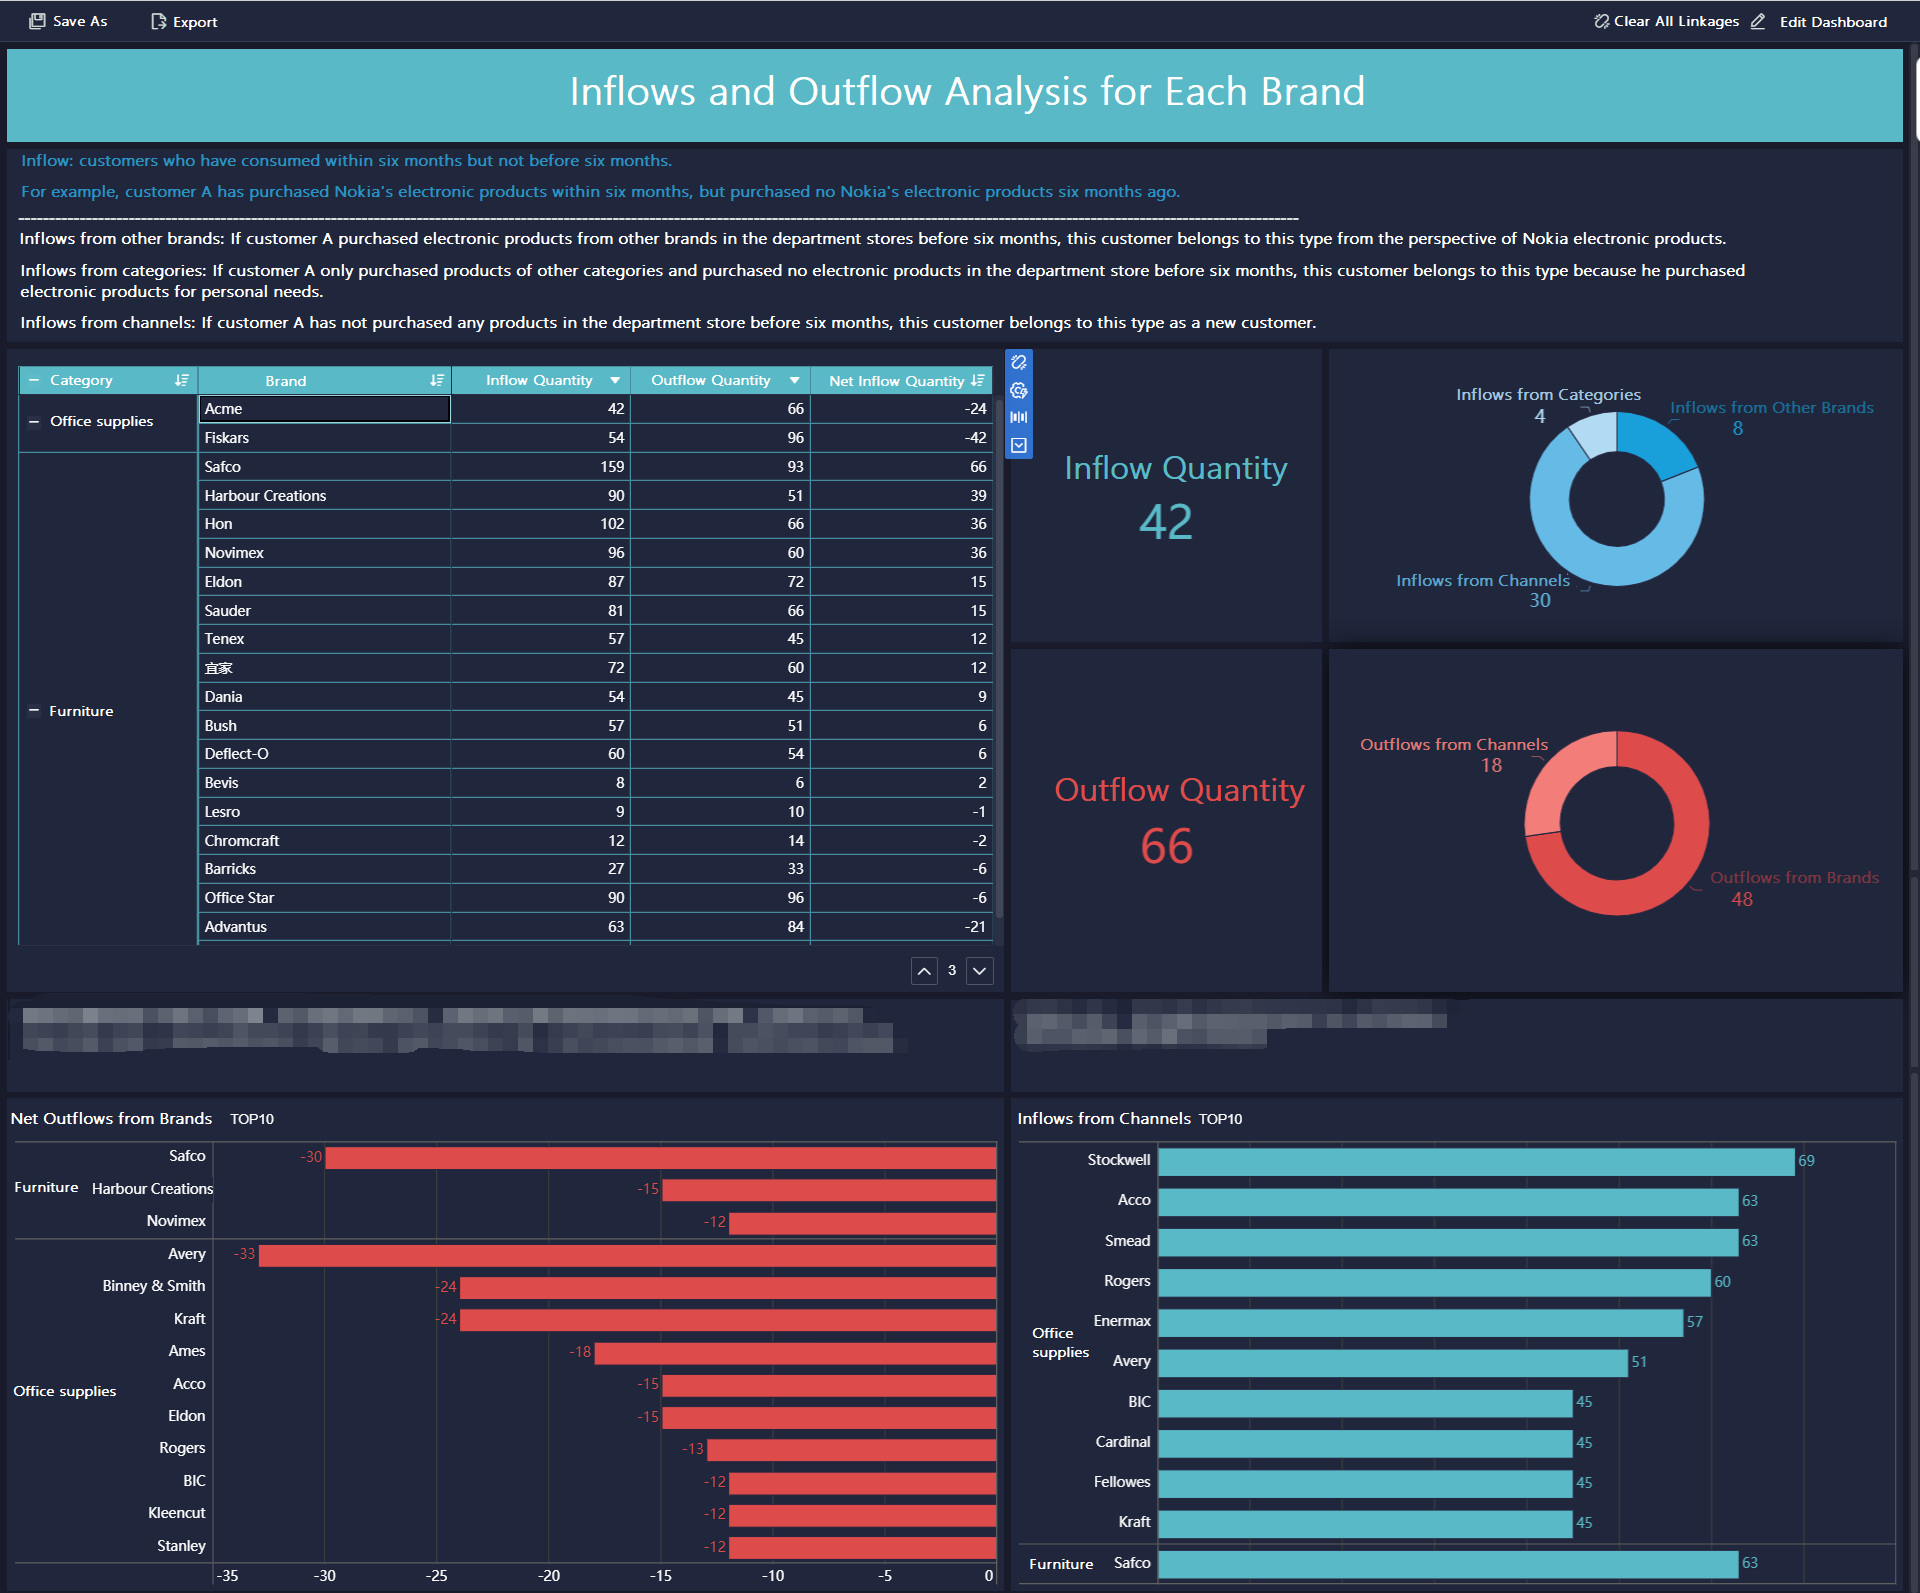
FineBI In Action
You can see the power of diagnostic analytics in action through real-world success stories. BOE Technology Group, a leader in the IoT and semiconductor display industry, faced challenges with fragmented data and inconsistent metrics. By implementing FineBI, BOE built a unified data warehouse, standardized metric definitions, and created a comprehensive operational analysis framework.
With FineBI, BOE achieved a 5% reduction in inventory costs and a 50% increase in operational efficiency. The company used diagnostic analytics to monitor KPIs, benchmark performance across factories, and identify the root causes of operational issues. This transformation enabled BOE to make data-driven decisions, improve business analytics, and accelerate digital transformation.
You can apply similar strategies in your organization. FineBI empowers you to connect data from multiple sources, analyze trends, and share insights securely. When you use diagnostic analytics tools like FineBI, you gain a deeper understanding of your business and drive measurable improvements.
Benefits And Limitations of Diagnostic Analytics
Advantages
When you use diagnostic analytics, you gain several important benefits that can transform your business analytics approach. This type of analytics helps you move from simply observing trends to understanding the reasons behind them. Many organizations report that the benefits of diagnostic analytics include better decision-making, improved efficiency, and a stronger competitive position.
Here is a summary of the main advantages:
You can also measure the return on investment from diagnostic analytics in several ways. Many businesses track the value generated, the reduction in data downtime, and the impact of data-driven changes. Some organizations use customer satisfaction scores or measure the value per active user. These methods help you see the real impact of analytics on your business.
Tip: When you use diagnostic analytics, you not only improve your current projects but also learn from both successes and failures. This feedback helps you optimize future analytics initiatives and align them with your business goals.
Challenges
While diagnostic analytics offers many benefits, you may face some challenges of diagnostic analytics during implementation. Data quality remains a common issue. If your data is incomplete or inconsistent, your analysis may lead to incorrect conclusions. You must ensure that your data sources are reliable and that your team follows best practices for data management.
Another challenge of diagnostic analytics is the need for skilled personnel. You need people who understand both analytics techniques and your business context. Training and collaboration across departments can help address this gap.
You may also encounter difficulties when integrating diagnostic analytics tools with existing systems. It is important to plan your data integration strategy and involve stakeholders early in the process. By addressing these challenges, you can maximize the value of diagnostic analytics and support better business analytics outcomes.
Diagnostic Analytics Vs Other Analytics Types
Descriptive Vs Diagnostic
You often start your analytics journey with descriptive analytics. This type of analytics helps you summarize past data and answer the question, "What happened?" Descriptive analytics gives you context and helps you understand performance over time. However, it does not explain why those results occurred.
Diagnostic analytics takes you a step further. You use diagnostic analytics to explore the reasons behind past events. This approach helps you answer, "Why did it happen?" By digging deeper, you uncover relationships and causes that drive business outcomes. The table below highlights the main differences:
Descriptive analytics gives you a snapshot of your business. Diagnostic analytics helps you find the story behind the numbers. You need both types to build a complete picture.
Predictive And Prescriptive
After you understand what happened and why, you may want to know what will happen next. Predictive analytics uses current and historical data to forecast future outcomes. You rely on predictive analytics to spot trends and prepare for upcoming changes.
Prescriptive analytics goes even further. It not only predicts what might happen but also recommends actions you should take. Prescriptive analytics helps you make decisions by evaluating different options and their possible results.
Here is a comparison of these analytics types:
You should use diagnostic analytics when you need to understand the causes of past events, such as a sudden drop in sales. Predictive analytics works best when you want to anticipate trends, like forecasting customer demand. Prescriptive analytics is most useful when you face complex decisions and need guidance on the best course of action, such as optimizing your supply chain.
Each analytics type serves a unique purpose. When you combine them, you gain a powerful toolkit for business decision-making. Start with descriptive and diagnostic analytics to understand your data, then use predictive and prescriptive analytics to plan and act with confidence.
Diagnostic analytics gives you the power to uncover the real reasons behind business outcomes. You can improve agility, minimize costs, and boost efficiency by understanding root causes. The table below highlights key benefits:
To get started, define your business questions, connect your data sources, and explore insights with tools like FineBI. This approach helps you make smarter decisions and drive continuous improvement.


