You might wonder how to check if a business can pay its bills on time. The current ratio formula gives you a quick answer by comparing what a company owns now to what it owes soon. This formula helps you understand if a business has enough resources for short-term needs. Many small businesses aim for a current ratio formula between 1.5 and 3.0, but a healthy range often falls between 1.2 and 2.0. If the number from your current ratio formula drops below 1.0, it signals possible cash flow trouble. Using the current ratio formula in your planning helps you spot risks and decide when to invest. While some experts now prefer other measures, the current ratio formula remains a key tool for beginners learning financial basics.

You need to understand the current ratio formula if you want to measure a company’s ability to pay its short-term debts. The current ratio formula is simple. You divide current assets by current liabilities. This calculation shows how many times a company’s assets can cover its debts due soon. You can use this formula to check if a business has enough resources to stay stable.
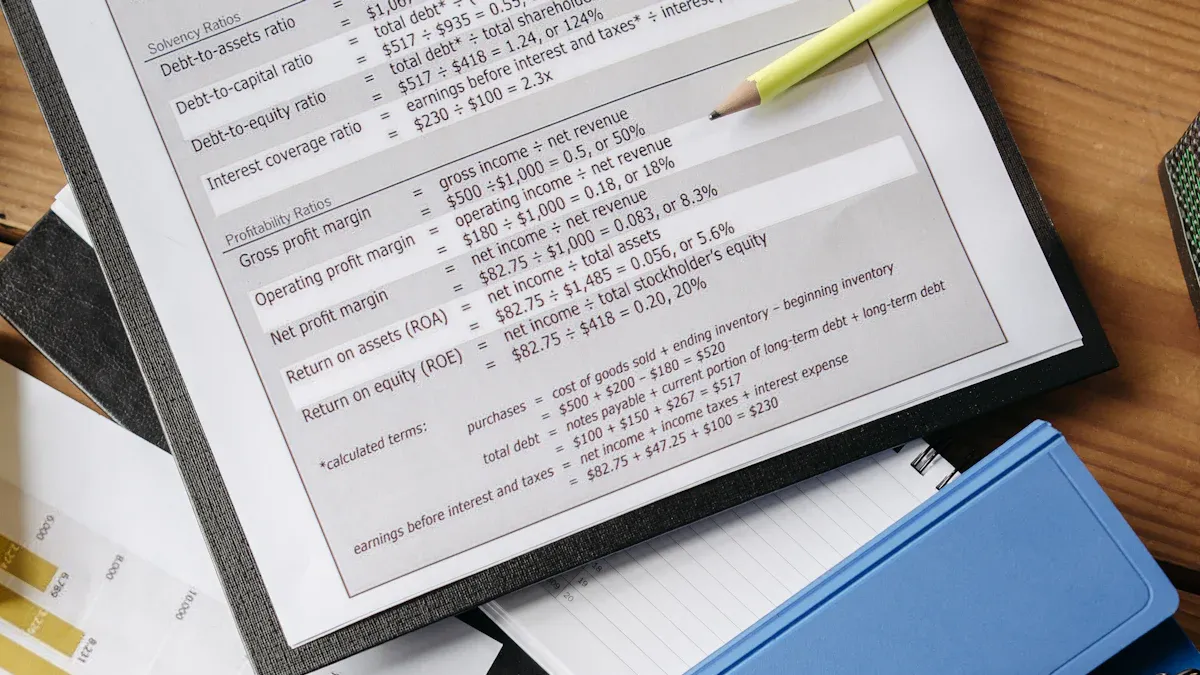
Here is how financial textbooks describe the current ratio formula:
- The current ratio helps you assess a company’s ability to meet short-term obligations.
- You calculate it by dividing total current assets by total current liabilities.
- The formula is: Current assets ÷ Current liabilities = Current ratio.
- Many experts prefer a ratio of 2:1, which means the company has twice as many assets as liabilities.
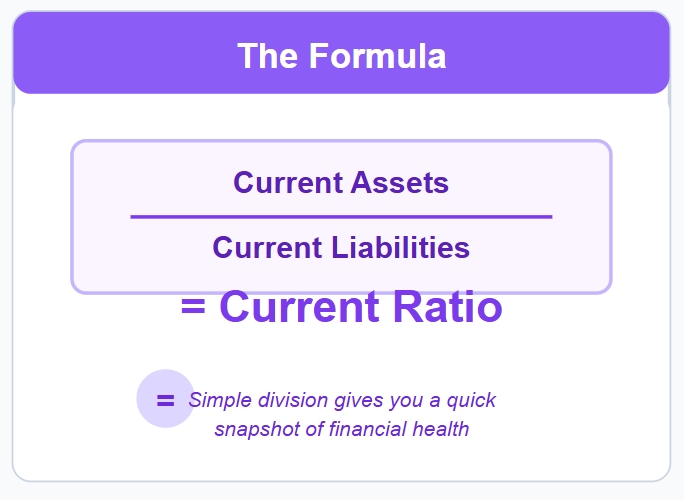
You can use the current ratio formula to get a quick snapshot of financial health. If you see a ratio above 1.0, the company usually has enough assets to pay its bills. If the ratio drops below 1.0, the company may struggle to meet its obligations.
Why Use the Current Ratio?
You use the current ratio formula to evaluate a company’s financial stability. Accountants rely on this formula to compare current assets and current liabilities. This ratio is important because it shows if a company can settle short-term debts. You see this formula in financial statements, where it helps you understand the company’s position.
Here are some ways professionals use the current ratio formula:
- Accountants use the formula to check a company’s financial health.
- The current ratio formula helps you decide if a business can pay its debts on time.
- Investors and lenders look at the current ratio to judge risk and stability.
- The formula appears in reports and statements, making it easy to track changes over time.
The current ratio formula plays a key role in evaluating short-term liquidity. You can see its impact in the table below:
You should not look at the current ratio formula alone. You need to compare it with other financial metrics to get a full picture of a company’s health.
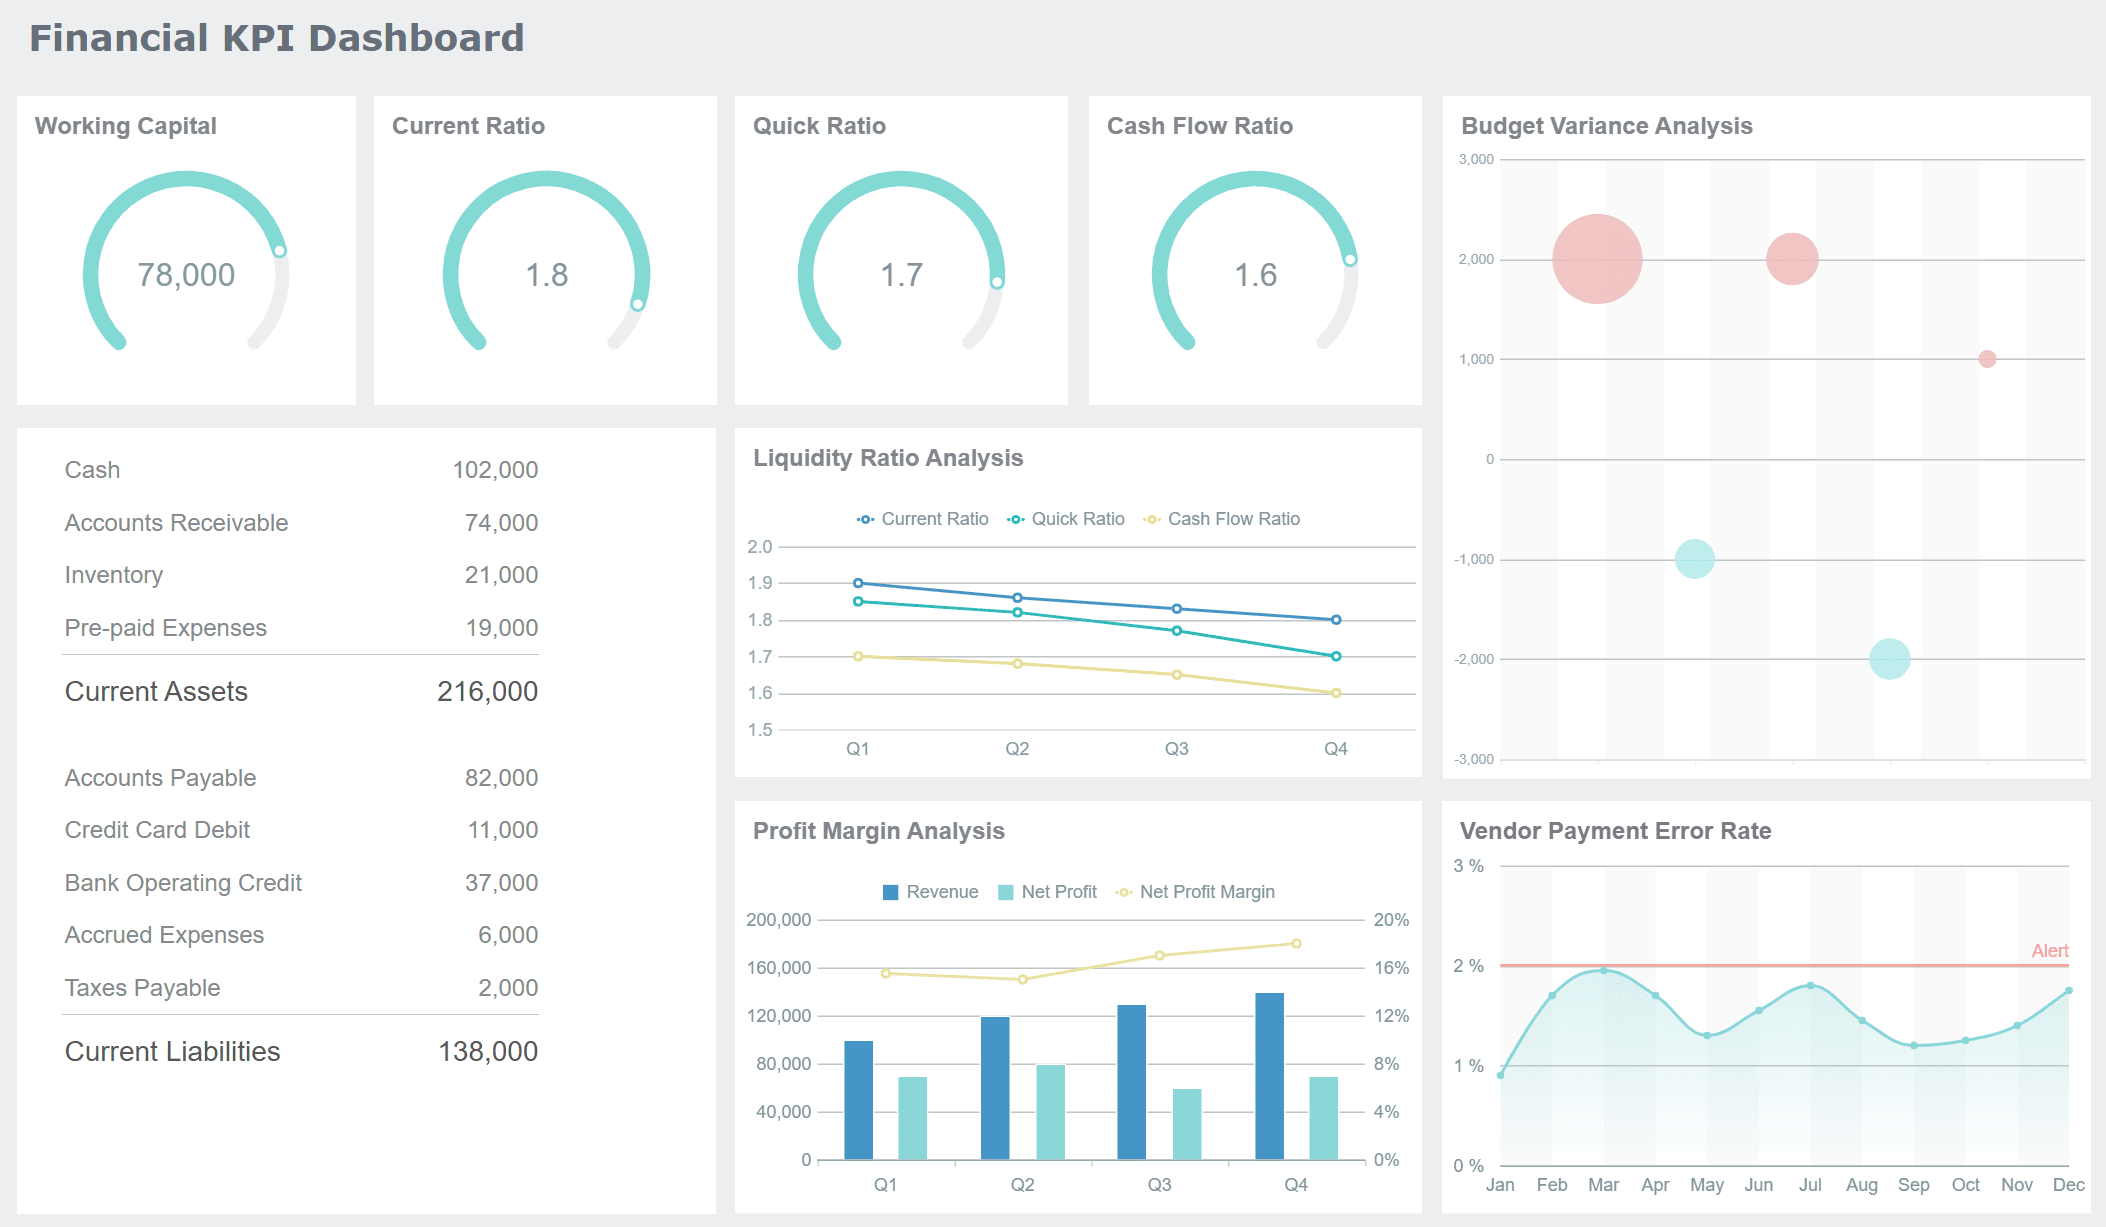
Tip: Business intelligence solutions like FineBI from FanRuan make it easier for you to understand financial metrics such as the current ratio. FineBI automates data integration from different sources, so you see all your financial data in one place. You can use FineBI to calculate ratios automatically and create interactive dashboards. These dashboards help you visualize trends and compare ratios over time, making your decision-making process much smoother.

If you want to analyze your company’s financial health, start with the current ratio formula. You will find it useful for spotting risks, planning investments, and making smart choices. FanRuan provides tools that help you track and understand these important numbers, so you can manage your business with confidence.
Components of the Current Ratio
Understanding the components of the current ratio helps you measure a company’s ability to pay its debts. You need to look at both current assets and current liabilities to get an accurate picture. Each part plays a different role in the calculation.
Current Assets
Current assets are resources that you expect to turn into cash or use up within one year. These assets help you cover your immediate expenses and keep your business running smoothly. When you calculate the current ratio, you include all items that can quickly become cash.
Here are some common types of current assets you might see:
- Cash and cash equivalents
- Short-term investments
- Accounts receivable
- Inventory
- Supplies
- Prepaid expenses

You should always check your current assets to see if you have enough to handle upcoming payments. If your current assets grow, your current ratio usually improves. This means your business has more flexibility to meet its obligations.
FineBI from FanRuan makes it easy for you to identify and track your current assets. You can connect FineBI to your accounting systems and see all your current assets in one dashboard. This helps you spot trends and make better decisions about your finances.
Current Liabilities
Current liabilities are debts or obligations that you need to pay within one year. These include bills, loans, and other payments that come due soon. When you look at current liabilities, you see what your business owes in the near future.
Typical examples of current liabilities include:
- Accounts payable
- Interest payable
- Salaries payable
- Taxes payable
- Current portion of long-term liabilities
- Short-term loans
- Other debts
You must compare your current liabilities to your current assets to understand your financial health. If your current liabilities are too high, your current ratio will drop. This could signal trouble in paying your short-term liabilities.
FineBI helps you analyze your current liabilities by pulling data from different sources. You can use FineBI to break down each type of current liability and see how they affect your current ratio. This makes it easier for you to manage your payments and avoid surprises.
Tip: The current ratio is calculated by dividing current assets by current liabilities. A higher current ratio means your current assets can cover your current liabilities, which shows better financial health. Always aim for your current assets to exceed your current liabilities for a strong ratio.
How to Calculate Current Ratio
Understanding how to calculate current ratio gives you a clear view of a company’s short-term financial health. You can follow a simple process to get accurate results and avoid common mistakes.
Step-by-Step Calculation
You can calculate current ratio by following these steps:
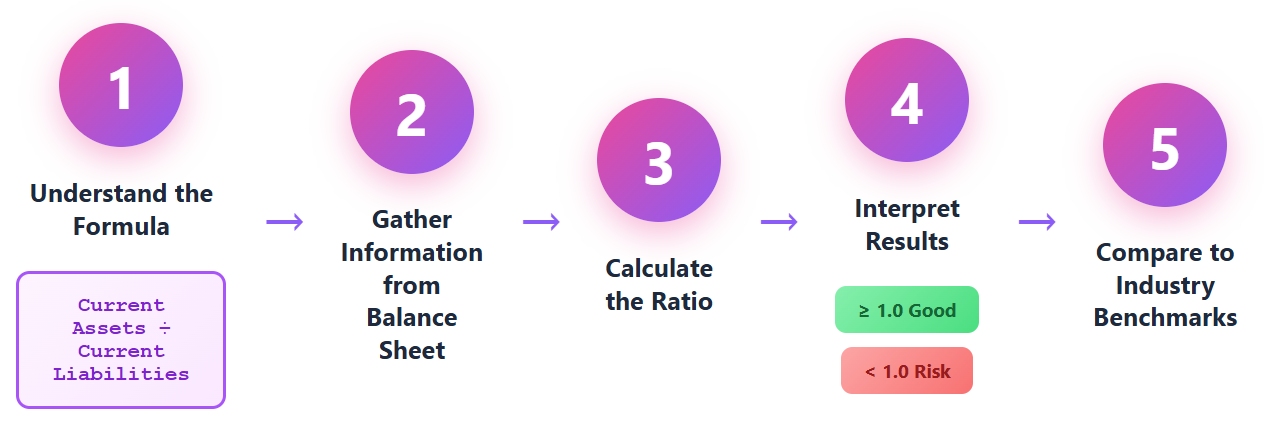
- Understand the Formula
The current ratio uses this formula:
Current Ratio = Current Assets / Current Liabilities
- Gather the Required Information
Look at the company’s balance sheet. Find the total current assets and total current liabilities. These numbers show what the company owns and owes within the next year.
- Plug the Numbers into the Formula
Take the values you found and insert them into the formula. Divide current assets by current liabilities.
- Interpret and Analyze the Results
Review the result. A current ratio above 1.0 means the company can pay its short-term debts. A ratio below 1.0 may signal trouble.
- Compare to Industry Benchmarks
Check how your result compares to others in the same industry. This helps you see if the company’s liquidity is strong or weak.
Tip: Always use the most recent financial data. Outdated records can make the current ratio look better than it really is. Make sure you classify assets and liabilities correctly. Only include items that will be used or paid within the next 12 months.
Common mistakes when you calculate current ratio include:
- Using old asset values that do not reflect current market conditions.
- Misclassifying assets or liabilities. Only include items that are truly current.
- Forgetting to add all short-term debts. Missing liabilities can inflate the ratio.
Example Calculation
Let’s look at an example to see how you can calculate current ratio using real company data. The table below shows the current assets and current liabilities for three companies. You can see how the calculation works in practice.
For example, if you want to calculate current ratio for News Corp., you divide 18,024millionby8,862 million. The result is 2.03. This means News Corp. has just over twice as many current assets as current liabilities.
You can use this calculation for any company. Just find the right numbers and follow the steps. If you see a current ratio close to 1.0, the company might have just enough to cover its debts. A higher number shows more safety, while a much lower number could mean risk.
Note: FineBI from FanRuan can help you automate and visualize the current ratio calculation. You can connect FineBI to your accounting systems and databases. FineBI pulls the latest data, cleans it, and lets you build dashboards with drag-and-drop tools. You can see your current ratio in real time and compare it to industry standards. The table below shows some features that make FineBI useful for this task:
FineBI makes it easy for you to calculate current ratio, avoid errors, and see trends over time. You can focus on making decisions instead of spending hours on manual calculations.
Interpreting the Current Ratio
What the Result Means
When you look at the current ratio, you see a clear picture of a company’s ability to pay its short-term debts. A current ratio above 1 shows that the company can cover its short-term obligations with its current assets. If the ratio falls below 1, the company may face financial challenges and struggle to pay bills on time. Investors and analysts use current ratio analysis to check if a business has enough resources for daily operations. This ratio acts as a quick check for liquidity and financial health.
You should remember that the current ratio is not just a number. It tells you if a company can handle emergencies or unexpected expenses. A higher current ratio usually means a stronger position, but it can also mean the company is not using its assets efficiently. You need to look at the ratio in the context of the company’s industry and business model.
Good vs. Bad Ratios
You might wonder what counts as a good current ratio. Most experts agree that a good current ratio falls between 1.5 and 3. This range means the company has enough assets to cover its debts but is not holding too much idle cash. If the ratio drops below 1, the company may have trouble meeting short-term liabilities. A ratio above 3 could mean the company is not investing its resources wisely.
Here are some points to help you with interpretation:
- A current ratio between 1.5 and 3.0 is considered healthy for most businesses.
- A ratio of 1.0 signals risk, as there is no extra cushion for emergencies.
- A ratio below 1 means current liabilities are greater than current assets, which can be a warning sign.
- Some industries, like manufacturing, may operate with lower ratios, while service companies often have higher ratios.
You can see how industry benchmarks vary in the table below:
FanBI customers use the current ratio to monitor liquidity and make decisions. For example, a manufacturing company may track its current ratio to ensure it stays above 1.0, while a service company may aim for a higher ratio. By using business intelligence tools, you can compare your ratio to industry standards and spot trends early.
Tip: Always compare your current ratio to others in your industry. This helps you understand if your business is on track or needs improvement.
Current Ratio vs. Other Liquidity Ratios
Quick Ratio Comparison
You can use different tools to measure a company’s liquidity. The quick ratio is another important liquidity ratio that you should know. While the current ratio includes all current assets, the quick ratio focuses only on the most liquid assets. This means it leaves out inventory and other assets that may take longer to turn into cash. The quick ratio gives you a more conservative view of a company’s ability to pay its short-term debts.
Here is a table to help you see the difference:
You should use both ratios to get a full picture of a company’s liquidity. The quick ratio can show you if a business can pay its bills even if it cannot sell its inventory quickly.
Limitations of the Current Ratio
You need to know the limits of the current ratio when you use it to judge liquidity. Some assets, like inventory or accounts receivable, may not turn into cash as fast as you expect. This can make a company look safer than it really is. The current ratio also ignores long-term debts, which can hide bigger financial problems.
Here are some common mistakes people make:
- Analysts sometimes rely only on the current ratio without checking other liquidity measures.
- Some companies use accounting tricks or time transactions to make their numbers look better.
- Comparing ratios across different industries can be misleading because each industry has its own standards.
A famous example is the Enron scandal. The company used loopholes to hide debts and make its financial statements look stronger. This misled many investors and analysts who trusted the numbers.
The table below shows some key limitations:
You should always use the current ratio with other tools to get a true sense of liquidity. FineBI helps you do this by letting you analyze many financial ratios at once. You can use its dashboards to compare trends, spot risks, and make better decisions. FineBI supports different industries, so you can tailor your analysis to your business needs.
Understanding and calculating the current ratio helps you measure a company’s ability to meet short-term obligations.
- A higher current ratio shows financial stability.
- A lower ratio may warn of possible risks.
- Investors use this metric to make smart decisions.
FineBI from FanRuan streamlines your financial analysis.
While the current ratio is valuable, it shouldn't stand alone. Cross-reference it with the cash ratio and operating cash flow ratio to get the full liquidity picture. Managing multiple financial metrics can be overwhelming—that's where FineBI excels. This intuitive BI tool consolidates your financial ratios into customizable, easy-to-understand visualizations, turning spreadsheet chaos into clear, strategic insights.


