You use EBITDA margin to measure how efficiently a company turns revenue into earnings before interest, taxes, depreciation, and amortization. EBITDA highlights core operational results and helps you compare companies across industries. Many analysts value EBITDA because it shows performance without the impact of financing or accounting choices. The table below shows how EBITDA stands out when compared to other financial metrics:
EBITDA does not show cash flow or capital spending, so you should use it with other metrics for a complete view. Modern BI tools like FineBI from FanRuan make it easier for you to analyze EBITDA margin and visualize performance trends.
What is EBITDA margin?
EBITDA margin definition
You use ebitda margin to see how much profit a company makes from its core operations before paying interest, taxes, depreciation, and amortization. This margin shows you the percentage of revenue that turns into earnings before these costs. Many investors and analysts rely on ebitda margin because it helps you compare companies without worrying about their capital structure or accounting choices.
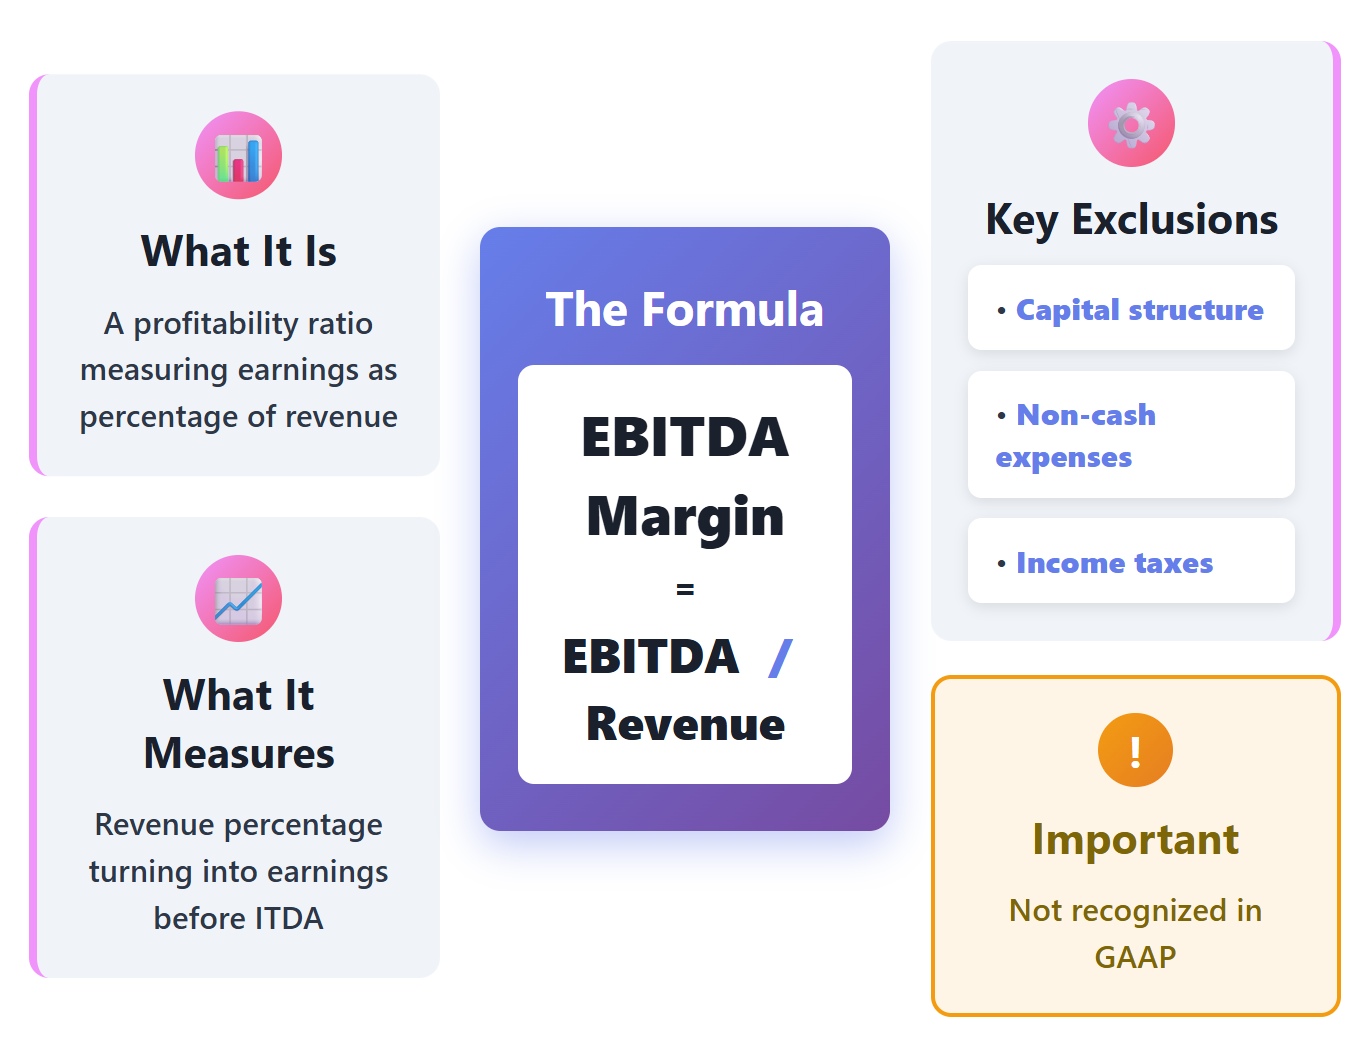
- ebitda margin is a profitability ratio.
- It measures earnings before interest, taxes, depreciation, and amortization as a percentage of revenue.
- The formula is: ebitda margin = ebitda / revenue.
- This margin does not account for the company's capital structure, non-cash expenses, or income taxes.
- ebitda margin is not recognized in generally accepted accounting principles (GAAP).
You should remember that ebitda margin focuses only on operational performance. It does not show you the full picture of a company's financial health. Some people think ebitda margin is the same as cash flow, but this is not true. ebitda does not include changes in working capital or capital expenditures. You might see companies report high ebitda margin, but this can sometimes hide important costs or risks.
💡 Tip: Always look at ebitda margin along with other financial ratios. This helps you avoid common mistakes and gives you a better understanding of a company's real performance.
EBITDA vs other profit margins
You will often see ebitda margin compared to other types of profit margin. Each margin tells you something different about a company's ability to make money. Here is a table that shows how ebitda margin compares to gross margin, operating margin, and net profit margin:
Gross margin tells you how much money is left after paying for the goods sold. Operating margin goes further by subtracting operating expenses. ebitda margin adds back some non-cash and non-operating costs, so you see how well the core business performs. Net profit margin shows you the final profit after all expenses, including taxes and interest.
You should know that ebitda margin is not always the best measure for every company. Some industries have very different typical ebitda margin ranges. For example, manufacturing companies often have ebitda margin multiples between 7.0x and 11.1x, while real estate companies can have much higher multiples. Always compare ebitda margin to industry averages for a fair view.
Many people misunderstand ebitda margin. Here are some common misconceptions:
- Some think ebitda is the same as cash flow, but it ignores working capital and capital expenditures.
- Companies can adjust ebitda since it is a non-GAAP measure, which may lead to inflated numbers.
- ebitda margin does not include interest expenses, so it can hide the impact of company debt.
- Capital expenditures are not part of ebitda, even though they are important for long-term operations.
- Measuring ebitda margin against revenue can sometimes encourage companies to focus on sales, not profitability.
You can use ebitda margin to compare companies, but always check other profit margin ratios and financial data. This approach gives you a more complete and accurate picture of business performance.

You can calculate ebitda margin using a simple formula. This formula helps you see how much of your revenue turns into earnings before interest, taxes, depreciation, and amortization. The ebitda margin formula is:
EBITDA Margin (%) = (EBITDA ÷ Net Revenue) × 100
You need to understand each part of this formula. The table below breaks down the main components:
You find ebitda by starting with operating profit and then adding back depreciation and amortization. These numbers usually come from your income statement and cash flow statement. Net revenue is your total sales after subtracting returns, discounts, and allowances. When you divide ebitda by net revenue and multiply by 100, you get the ebitda margin as a percentage.
To calculate ebitda margin, you need two main figures: ebitda and sales (or revenue). You can find sales in the income statement. Depreciation and amortization details often appear in the cash flow statement or in the notes to the financial statements. Make sure you use the correct numbers from your financial reports.
⚠️ Note: EBITDA margin is a non-GAAP measure. When you report it, you must also show comparable GAAP margins. The SEC requires companies to disclose non-GAAP measures with equal prominence and clear explanations.
Accounting standards can affect your calculation. For example, ASC 842 changes how you report operating leases. Lease payments are no longer directly expensed, so ebitda increases because lease expenses are removed from the calculation. Always check for recent changes in accounting rules before you calculate ebitda margin.
Step-by-step EBITDA calculation
You can follow a clear process to calculate ebitda margin for any company. Here is a step-by-step example:
- Identify the financial data
Suppose your company has net revenues of 152,000andebitdaof39,200.
- Apply the ebitda margin formula
Use the formula: EBITDA Margin = (EBITDA / Sales) × 100.
- Calculate the margin
Divide 39,200by152,000. Multiply the result by 100.
EBITDA Margin = (39,200 / 152,000) × 100 = 25.8%
You can see that 25.8% of your revenue turns into ebitda. This means your core operations are efficient, and you keep a good portion of your sales as earnings before interest, taxes, depreciation, and amortization.
💡 Tip: Many business intelligence tools, such as FineBI by FanRuan, make this calculation even easier. You can create formula columns in FineBI to calculate ebitda margin automatically. The platform lets you filter, group, and summarize your data. You do not need advanced technical skills. FineBI’s self-service datasets help you perform these calculations quickly and visualize the results in real time.
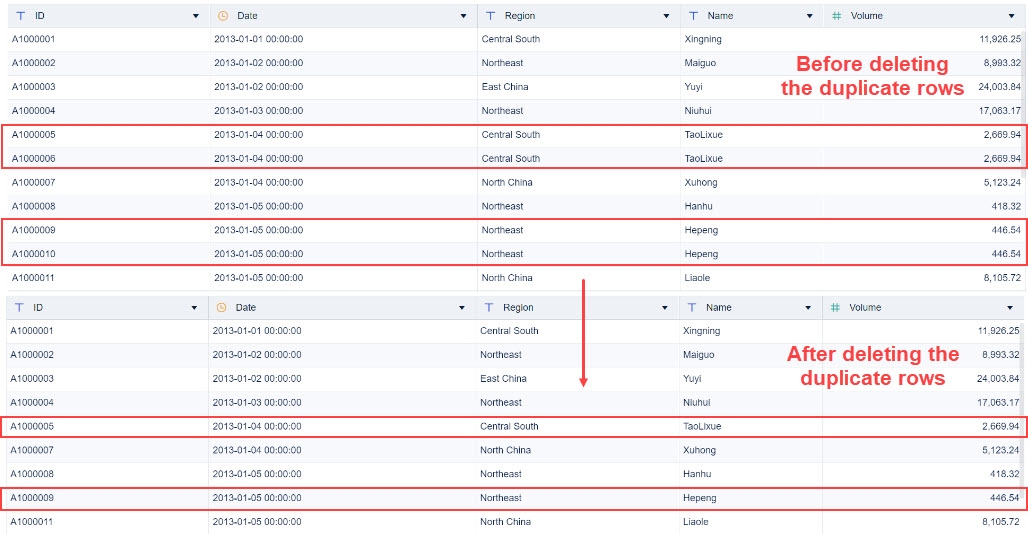
When you use FineBI, you can avoid many common errors. Some people use the wrong starting figures or miscalculate growth rates. Others overcomplicate the process or forget to adjust for working capital or capital expenditures. FineBI helps you keep your calculations accurate and your analysis clear, you can perform basic data cleaning in FineBI before analyzing your data.

- Incorrect starting figures can lead to big mistakes.
- Miscalculating growth rates can make your projections unreliable.
- Overcomplicating calculations wastes time and increases errors.
- Missing adjustments for working capital or capital expenditures can distort your results.
- Incorrect exit calculations can affect your return estimates.
You should always double-check your numbers and use the right data sources. FineBI’s dashboards and visualizations help you spot trends and outliers, making your ebitda margin analysis more reliable.
EBITDA margin pros and cons
Key advantages
When you use EBITDA margin in your analysis, you gain several important benefits:
- You can compare companies more easily because EBITDA margin removes expenses that might hide true operational performance. This makes it a useful tool for investors who want to see how well a business runs at its core.
- The margin is especially helpful if you want to evaluate newer companies. These businesses may not have a long financial history, but EBITDA margin still gives you a way to measure their earning potential.
- You can use EBITDA margin as a benchmark within an industry. A higher EBITDA margin often shows stability in earnings, while a lower margin can point to possible problems with profitability.
- In mergers and acquisitions, EBITDA margin acts as a standardized measure of operational profitability. It lets you compare different companies and industries on equal terms. By focusing on core business activities, you can better assess operational efficiency and value.
- Adjusted EBITDA margin can help you find a company’s true value by removing one-time or owner-specific expenses. This makes it easier to set fair valuation multiples.
💡 Tip: If you want to improve EBITDA margin, you can conduct internal audits, automate manual processes, reduce overhead costs, and negotiate better terms with vendors. These steps help you control expenses and boost profit from your revenue.
Main limitations
While EBITDA margin is a powerful tool, you should know its main drawbacks:
- EBITDA ignores the cost of capital assets. This can be a big issue in industries like airlines or manufacturing, where equipment and machinery cost a lot.
- The margin does not show actual cash flow. It leaves out capital expenditures, changes in working capital, and debt repayments, so you might not see the full financial picture.
- Interest expenses do not appear in EBITDA margin. If a company has a lot of debt, this can hide real risks.
- Taxes are not included, even though every business must pay them.
- Companies sometimes adjust EBITDA to exclude recurring costs. This can make results look better than they really are and lead to a misleading view of profitability.
EBITDA margin can sometimes give you the wrong impression about a company’s financial health. For example, a manufacturing company might show a strong EBITDA margin but face high costs for new equipment. This could make the business seem more stable than it really is. Also, when companies adjust EBITDA to remove one-time expenses, you might miss ongoing problems in their operations. Always look closely at these adjustments to avoid being misled.
You now understand that ebitda margin measures how much profit a company earns from its core operations before interest, taxes, depreciation, and amortization. You can calculate this margin by dividing ebitda by revenue. FineBI by FanRuan helps you analyze these metrics with real-time analytics, self-service features, and easy customization, as shown below:
Remember to balance ebitda margin with other financial ratios like net profit margin and debt-to-equity ratio for a complete evaluation.
Why EBITDA margin matters in business analysis
Operational efficiency insights
You use EBITDA margin to measure how well a company turns revenue into profit from its main operations. This ratio helps you focus on core business activities by removing the effects of interest, taxes, depreciation, and amortization. When you see a high EBITDA margin, you know the company manages its costs well and runs efficiently. A low EBITDA margin can signal problems with cost control or weak pricing power.
- A high EBITDA margin usually means strong operational efficiency.
- EBITDA margin gives you a clear view of cash earnings, which is important in capital-heavy industries.
- This ratio lets you compare companies without worrying about their debt or tax situations.
- EBITDA margin shows you how much operating profit comes from each dollar of revenue.
You should always check EBITDA margin against industry benchmarks. This helps you see if a company is leading or lagging behind its peers. Investors often use this ratio to spot growth opportunities and evaluate financial performance.
Industry and company comparisons
EBITDA margin makes it easy for you to compare companies in the same industry. Different sectors have different typical margins, so you need to look at industry averages. For example, real estate and leasing companies often have much higher EBITDA margins than retail or manufacturing firms.
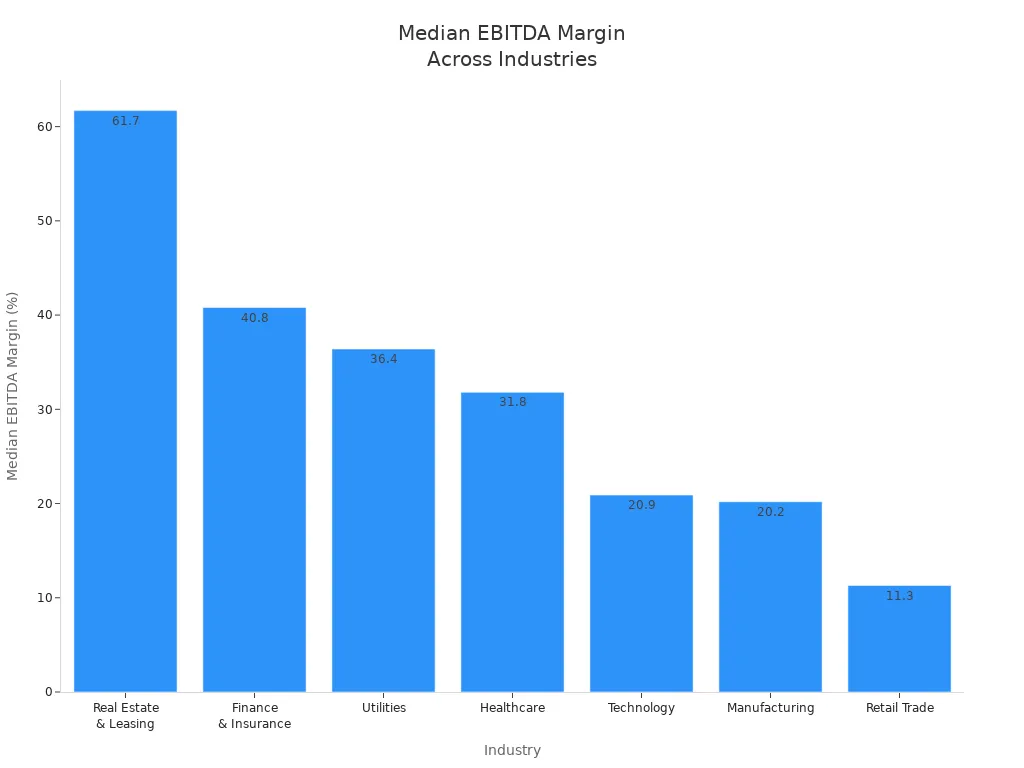
You can see that a higher EBITDA margin in technology or manufacturing often leads to better valuation multiples. In retail, even a small increase above the average margin can make a company stand out. Tracking EBITDA margin over time helps you measure progress and compare financial performance with industry peers.
Role of FineBI in EBITDA margin analysis
You can use FineBI by FanRuan to analyze EBITDA margin quickly and accurately. FineBI gives you a drag-and-drop interface, so you do not need advanced technical skills. You can build dashboards that show EBITDA, revenue, and margin trends in real time. FineBI’s high-performance computing engine processes large datasets, so you always have up-to-date analytics.
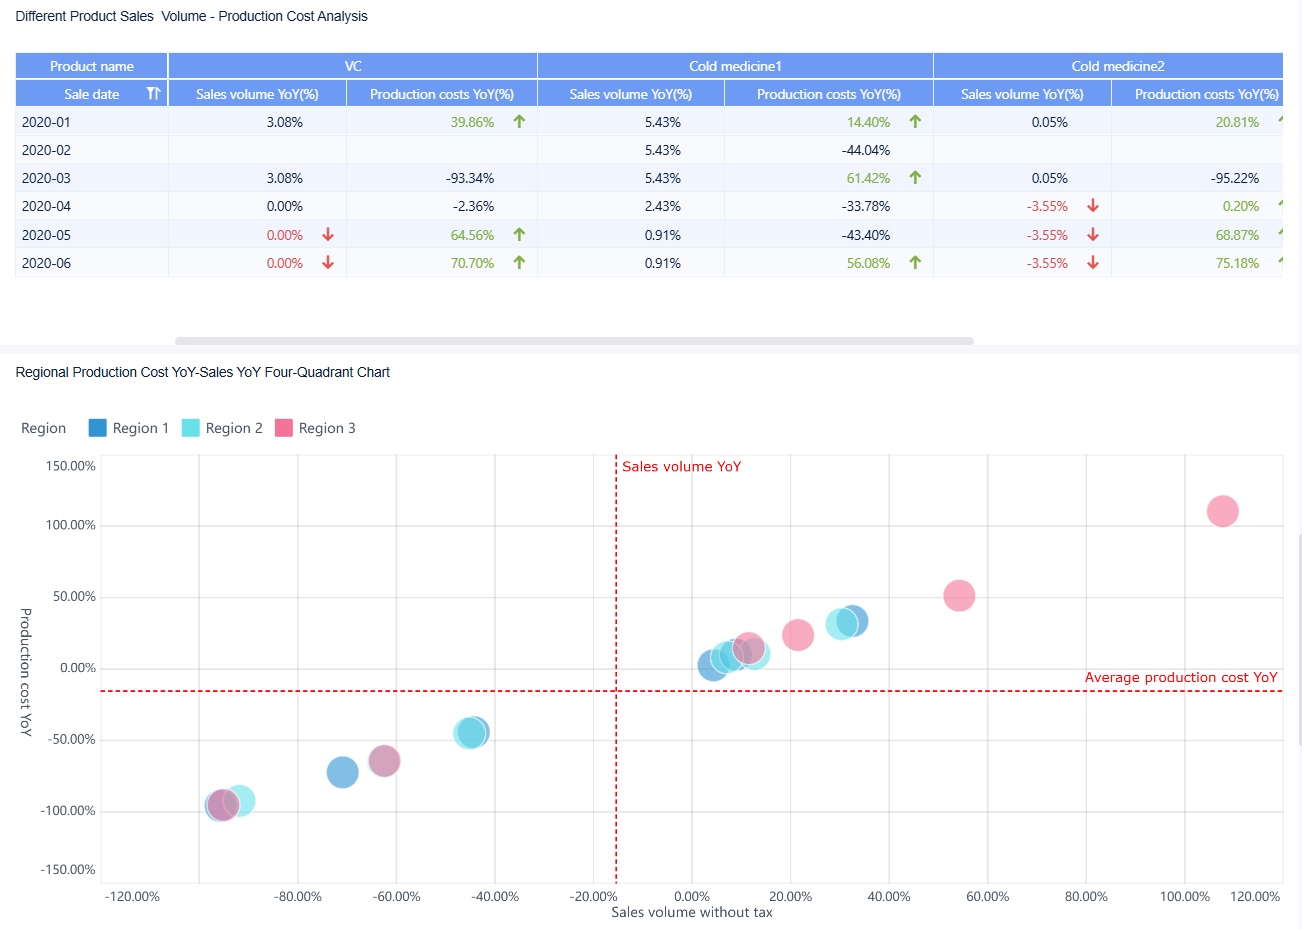
With FineBI, you can track EBITDA margin, compare it to industry benchmarks, and share insights with your team. This helps you make better decisions and improve your company’s profitability metrics.


