Cloud Business Intelligence is the modern way to turn business data into dashboards, reports, and insights without relying on heavy on-premises infrastructure. Instead of running everything on local servers, companies use cloud platforms to collect, process, analyze, and share data over the internet.
For organizations that want faster reporting, broader access, and more scalable analytics, Cloud Business Intelligence is often the most practical path forward. It reduces technical friction, shortens time to insight, and makes data available to more teams—not just analysts or IT.
What Is Cloud Business Intelligence?
Cloud Business Intelligence, often called cloud BI, refers to business intelligence tools and processes delivered through cloud infrastructure. In simple terms, it means your company’s reporting, dashboards, analytics, and often part of the data pipeline are hosted online rather than managed entirely on local servers.
Traditional on-premises BI usually requires companies to buy and maintain hardware, install software internally, manage upgrades, and control infrastructure themselves. Cloud Business Intelligence shifts much of that burden to the vendor or cloud environment. Users access reports and dashboards through a browser or app, while storage, processing, and platform updates happen behind the scenes in the cloud.
The core goals of Cloud Business Intelligence are straightforward:
- Faster access to data
- Broader accessibility across teams
- Scalable analytics as data volumes grow
- Lower operational complexity
- Quicker deployment of reports and dashboards
At its heart, business intelligence is about helping people make better decisions with data. That includes collecting information from multiple systems, standardizing it, analyzing trends, and presenting the results in a way decision-makers can actually use. For companies that want both governed analytics and self-service exploration, platforms like FineBI are often worth serious consideration because they combine visual analysis, dashboarding, and user-friendly data exploration in a cloud-friendly model.
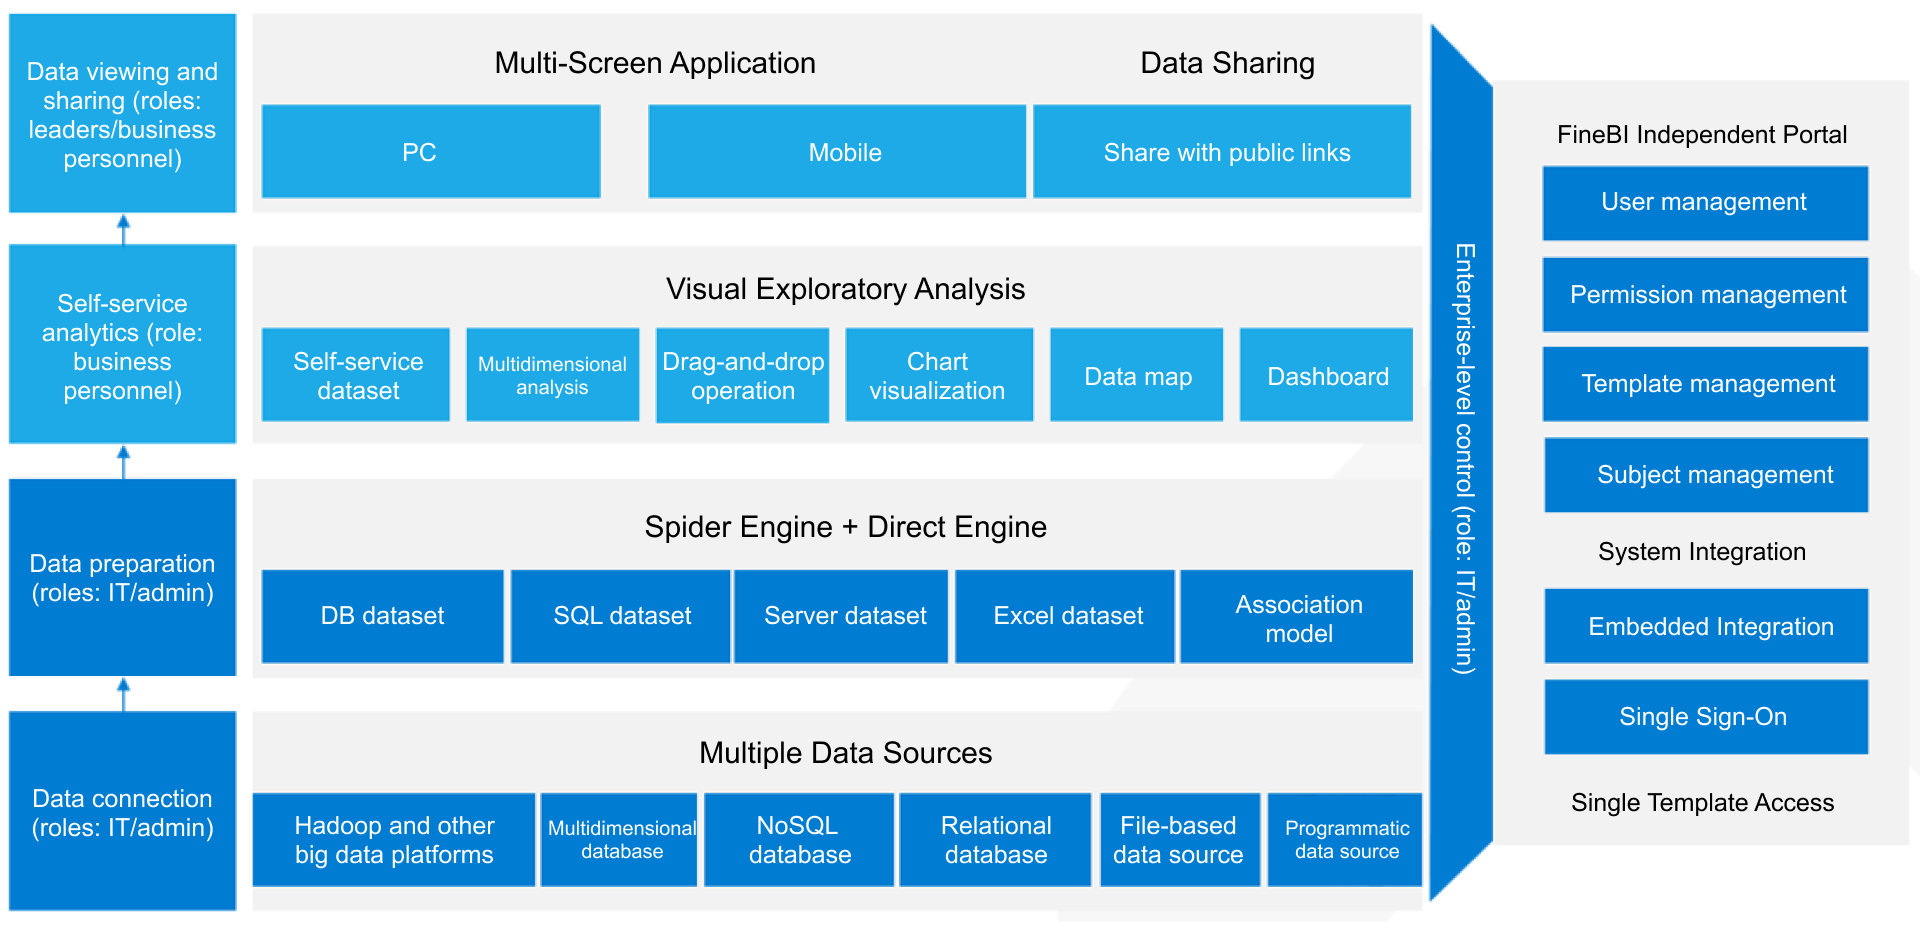
FineBI Workflow
Cloud Business Intelligence is especially useful for growing teams that face common data problems such as:
- Reports taking too long to produce
- Data being spread across CRMs, ERPs, spreadsheets, and SaaS apps
- Teams working from different locations
- Inconsistent KPI definitions across departments
- Rising infrastructure and maintenance costs
- Limited analytics access outside technical teams
In short, Cloud Business Intelligence helps companies move from fragmented reporting to a more agile, shared, and scalable analytics environment.
Core Benefits of Cloud Business Intelligence (BI)
The appeal of Cloud Business Intelligence is not just technical. Its value shows up in day-to-day business performance.
Faster insights and better decision-making
Cloud-based analytics platforms make it easier to access fresh data, update dashboards quickly, and respond to changing conditions. Leaders no longer have to wait days or weeks for manually prepared reports. Sales teams can track pipeline changes faster, finance can monitor actuals against budgets sooner, and operations teams can spot bottlenecks before they escalate.
This speed improves decision quality. When teams work from timely and consistent information, they can act with more confidence.
Greater flexibility and scalability
As a business grows, its analytics needs grow too. More users, more data sources, more dashboards, and more complex metrics can quickly strain a traditional setup. Cloud Business Intelligence is designed to scale more smoothly.
Companies can usually:
- Add users faster
- Connect new systems with less friction
- Increase storage and compute as needed
- Support departmental and enterprise reporting from the same ecosystem
This flexibility is particularly important for fast-growing companies, seasonal businesses, and organizations expanding across regions.
Lower infrastructure overhead
Traditional BI often requires hardware procurement, server administration, patching, backup management, and periodic upgrades. Cloud BI reduces much of this overhead.
That does not mean cloud analytics is free of operational responsibility. Teams still need governance, data modeling, and user management. But the infrastructure burden is typically much lighter. That leads to:
- Lower upfront capital expenditure
- Reduced maintenance effort
- Faster implementation
- Better use of internal IT resources
Easier collaboration for distributed teams
One of the biggest practical advantages of Cloud Business Intelligence is accessibility. Teams in different offices, regions, or time zones can view the same dashboards through a web browser, often with role-based access controls.
That shared access improves collaboration across:
- Leadership and department heads
- Analysts and business users
- Regional teams and headquarters
- Internal stakeholders and external partners
When everyone sees the same numbers, meetings become more productive and alignment improves.
Broad business use cases
Cloud BI is not limited to one department. It supports a wide range of operational and strategic use cases.
Sales
Finance
Operations
- Inventory monitoring
- Fulfillment performance
- Process efficiency reporting
- Capacity planning
Marketing
- Campaign performance
- Lead funnel tracking
- Channel attribution
- Customer acquisition metrics
Because Cloud Business Intelligence can pull data from multiple systems into one reporting layer, it becomes a shared decision platform rather than a department-specific tool.
Cloud Business Intelligence Architecture and Core Components
To understand how Cloud Business Intelligence works in practice, it helps to look at its architecture. Most cloud BI environments are built from a few core layers: data sources, ingestion, storage, processing, modeling, and consumption.
Cloud BI platforms connect to many different data sources. These can include:
- CRM systems such as Salesforce
- ERP and financial systems
- Marketing platforms
- Databases like MySQL, PostgreSQL, SQL Server, or Oracle
- Cloud applications such as HubSpot, Shopify, or NetSuite
- Flat files like CSV and Excel
- APIs
- Event streams and application logs
- IoT or sensor data in specialized environments
The ingestion layer is responsible for moving raw data from those sources into the cloud analytics environment. Depending on the use case, this may happen in batches, near real time, or real time.
Common ingestion tasks include:
- Extracting data from source systems
- Scheduling refresh jobs
- Syncing incremental updates
- Validating schema changes
- Moving data into staging areas
A well-designed ingestion pipeline reduces manual exports and ensures that analytics teams are not constantly rebuilding data flows.
Storage, processing, and modeling
Once data is ingested, it needs a place to live and a process to make it useful. This is where cloud data warehouses, lakes, and transformation layers come in.
Cloud storage options
Organizations commonly use:
- Cloud data warehouses for structured analytics-ready data
- Data lakes for storing large volumes of raw or semi-structured data
- Lakehouse-style environments that blend flexible storage with analytical performance
The right choice depends on reporting needs, data complexity, and technical maturity.
Raw data is rarely ready for reporting. It often contains duplicates, missing values, inconsistent naming, and conflicting business logic. Processing layers clean and transform this data so it becomes reliable.
Typical transformation work includes:
- Standardizing date formats and naming conventions
- Joining data from multiple systems
- Creating reusable dimensions and fact tables
- Defining business metrics such as revenue, churn, margin, or CAC
- Filtering low-quality or irrelevant records
Data modeling for consistency
Modeling is what turns technical data into business-friendly analytics. A good data model helps ensure that users across departments calculate KPIs the same way.
For example, if sales, finance, and operations all define “active customer” differently, reporting will never align. Modeling solves that by creating shared logic and reusable semantic definitions.
This is also where strong BI platforms make a difference. FineBI, for example, is often favored by organizations that want to balance centralized governance with self-service access. Business users can explore data visually, while data teams retain control over trusted models, permissions, and metric definitions.
The top layer of Cloud Business Intelligence is where end users interact with data.
This usually includes:
- Interactive dashboards
- Scheduled reports
- Ad hoc analysis
- Drill-down and slice-and-dice exploration
- Alerts and subscriptions
- Mobile or browser access
Dashboards translate modeled data into decision-ready views. Executives may see high-level KPIs, while managers drill into team performance and analysts investigate root causes.
FineBI's Drill-down Capability
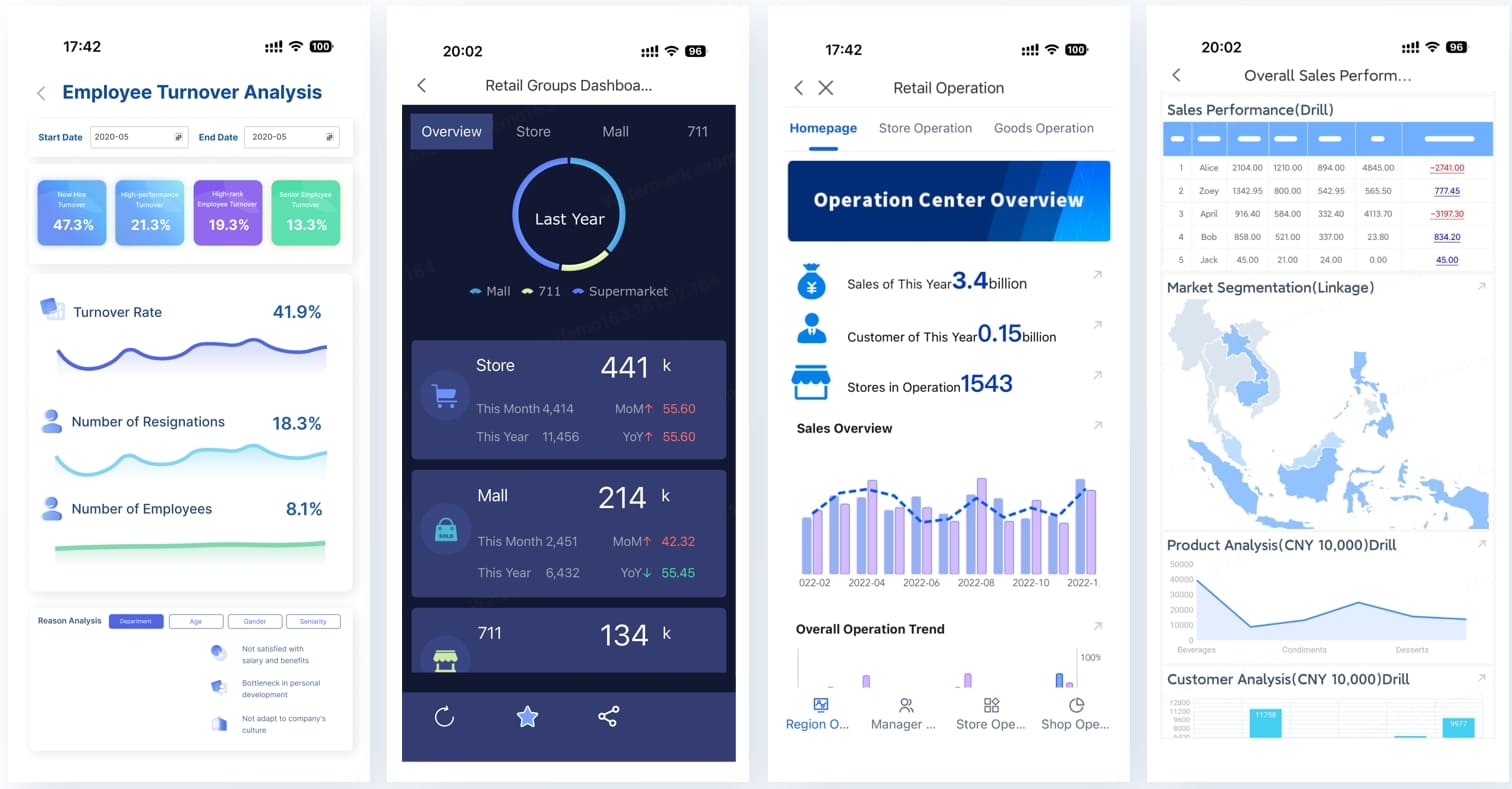
Mobile Access
Self-service analytics
Self-service is one of the most important ideas in modern BI. It allows non-technical users to answer routine business questions without waiting on analysts for every report.
Useful self-service features include:
- Drag-and-drop chart building
- Visual filtering
- Natural exploration paths
- Reusable metrics
- Personal dashboards
- Controlled access to trusted datasets
But self-service only works well when paired with governance.
Permissions and governance
Cloud Business Intelligence must control who can see what. Good governance includes:
- Role-based access control
- Row-level or column-level security
- Auditability
- Data lineage visibility
- Version control for dashboards and metrics
- Clear ownership of core reports
Without governance, self-service can create confusion. With governance, it creates speed without sacrificing trust.
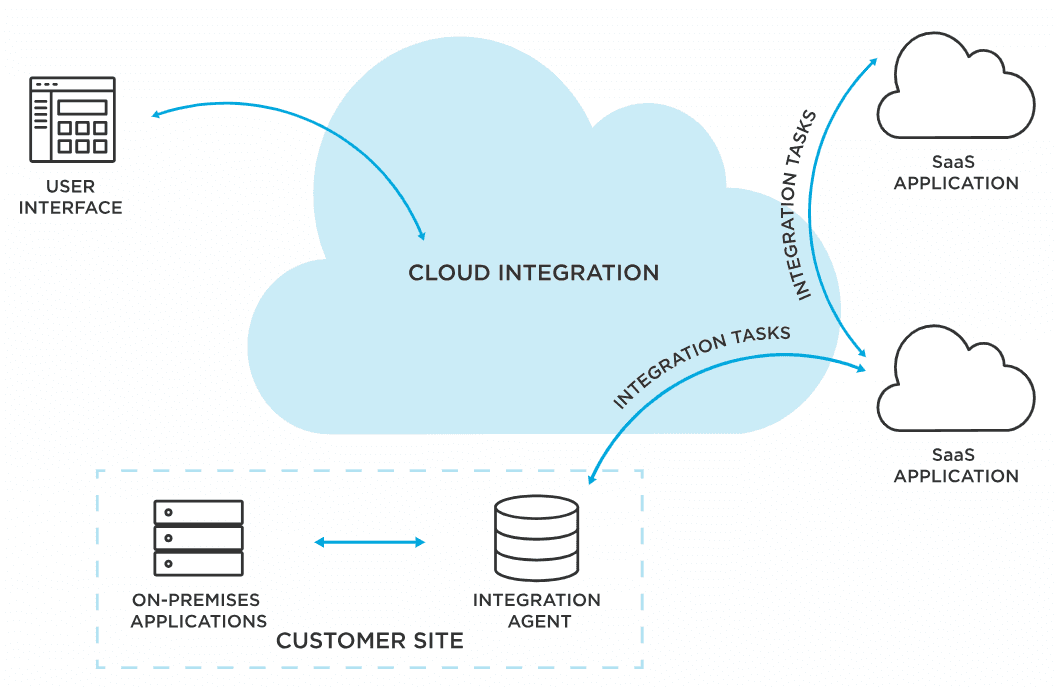
How Cloud Business Intelligence Works: From Data Collection to Insights
Cloud Business Intelligence follows a practical flow from raw data to business action. The exact stack varies by company, but the core process is generally similar.
Step 1: Connect and collect data
The first step is connecting data sources. A cloud BI platform or related data pipeline tool pulls information from the systems the business already uses.
These may include:
- SaaS applications
- Transactional databases
- Data warehouses
- Spreadsheets
- Cloud storage
- External APIs
The goal is to eliminate isolated reporting silos. Instead of relying on one spreadsheet from finance and another from sales, Cloud Business Intelligence centralizes inputs into a shared analytics environment.
This stage often involves connector setup, authentication, refresh frequency configuration, and source mapping.
Step 2: Prepare and organize data
Once data is collected, it must be prepared. This is the stage where quality and consistency are established.
Typical preparation tasks include:
- Removing duplicates
- Filling or flagging missing values
- Standardizing naming conventions
- Joining related tables
- Mapping dimensions like region, product, or customer segment
- Creating standardized metrics and calculations
This stage matters because dashboards are only as trustworthy as the underlying data. If different departments use different formulas, reports will conflict. Preparation creates a stable analytical foundation.
In more advanced setups, this stage may also include metric layers, master data management, and reusable business definitions.
Step 3: Analyze, visualize, and share results
After data is prepared, users can begin analysis. Analysts may explore trends, identify anomalies, and test hypotheses. Managers may monitor KPIs and compare performance against targets. Executives may review strategic dashboards.
Typical outputs include:
- Executive dashboards
- Department scorecards
- Operational monitoring views
- Automated reports
- Shared visual stories
- Alerts triggered by thresholds or unusual movements
Once built, these outputs can be distributed through browser access, scheduled email delivery, embedded analytics, or collaborative workspaces.
This is where Cloud Business Intelligence delivers its business value: transforming raw data into actionable insights that people can access quickly and use confidently.
Cloud Business Intelligence vs Traditional Business Intelligence
Cloud Business Intelligence and traditional BI serve the same purpose—supporting better decisions with data—but they differ significantly in deployment, scalability, cost structure, and operational model.
Deployment and implementation speed
Traditional BI often requires internal hardware, software installation, network configuration, and longer setup cycles. Cloud BI is generally faster to deploy because the platform is already hosted and accessible online.
For businesses that need quick time to value, cloud usually has the advantage.
Scalability
On-premises BI environments can scale, but scaling often requires additional infrastructure planning and spending. Cloud Business Intelligence typically supports more elastic growth. Organizations can expand users, storage, and compute with less operational friction.
Cost structure
Traditional BI usually involves higher upfront investment in hardware and implementation. Cloud BI more often follows subscription or usage-based pricing.
That does not automatically make cloud cheaper in every scenario. Long-term cost depends on usage patterns, architecture discipline, and vendor pricing. But for many businesses, cloud lowers the barrier to entry and reduces capital expenditure.
Maintenance and upgrades
With traditional BI, internal teams manage patches, upgrades, and infrastructure operations. With cloud BI, much of this is handled by the provider. That reduces maintenance effort but also means organizations must align with vendor release cycles and platform constraints.
Accessibility
Cloud BI is naturally better suited to remote access and distributed teams. Traditional BI can support remote usage too, but it often requires more setup and management.
When cloud BI is the better fit
Cloud Business Intelligence is often the best fit when:
- Teams are distributed
- The business uses many SaaS systems
- Fast deployment matters
- IT resources are limited
- Data volumes are growing
- Self-service analytics is a priority
When hybrid or on-premises may still make sense
Hybrid or on-premises models may still be appropriate when:
- Regulatory requirements are highly restrictive
- Sensitive workloads must stay in controlled environments
- Legacy systems are deeply embedded on-site
- Latency or performance needs require local processing
- The organization already has substantial on-prem BI investment
Common beginner questions
Is cloud BI secure?
It can be very secure, provided the platform supports encryption, access control, identity management, audit logging, and compliance requirements. Security depends on both the vendor and your governance practices.
Do we lose control in the cloud?
You may give up some infrastructure-level control, but strong platforms still provide robust administrative controls, permissions, and governance settings.
Is performance good enough for large-scale analytics?
In many cases, yes. Modern cloud architectures can handle significant analytical workloads. Performance depends on data modeling, query design, warehouse configuration, and dashboard design—not just hosting location.
Selecting a Cloud Business Intelligence platform is not just about attractive dashboards. The right choice must fit your data landscape, user skills, governance needs, and long-term scale.
When evaluating tools, focus on practical criteria.
Integrations
The platform should connect cleanly to your existing systems, including databases, cloud apps, files, and APIs. Weak connectivity creates manual workarounds and limits adoption.
Ease of use
A BI tool must serve both technical and non-technical users. If only specialists can use it, self-service goals will stall.
Look for:
- Intuitive interface
- Drag-and-drop analysis
- Simple dashboard creation
- Clear filtering and drill-down behavior
- Easy report sharing
Governance and security
Strong analytics requires trust. The tool should support:
- Role-based permissions
- Row-level security
- Centralized metric definitions
- Audit trails
- Data access controls
Scalability
Choose a platform that can grow with your reporting volume, user base, and data complexity.
Pricing and total cost
Look beyond the subscription fee. Consider:
- Implementation effort
- Training needs
- Ongoing administration
- Data warehouse usage costs
- Add-on charges for advanced features
Product fit
Some tools are optimized for technical analysts, while others are better for broad business adoption. If your goal is governed self-service BI, FineBI is a strong option to evaluate. It is particularly useful for organizations that want business users to build visual analyses and dashboards independently while keeping centralized control over data assets, permissions, and metric standards.
Common implementation challenges
Even good Cloud Business Intelligence projects face obstacles.
Data quality issues
If source systems contain inconsistent or incomplete data, dashboards will expose those problems quickly. BI does not fix bad data by itself; it makes data quality visible.
User adoption
A technically successful deployment can still fail if users do not trust or understand the dashboards. Adoption requires training, communication, and clear use cases.
Access control complexity
As more teams use the platform, permissions become more important. Access must be secure without becoming so restrictive that users cannot do their jobs.
Change management
Cloud BI often changes how reporting works. Teams may move away from spreadsheet-heavy habits toward shared dashboards and standardized KPIs. That shift requires sponsorship and process alignment.
First steps for beginners
If you are just getting started with Cloud Business Intelligence, avoid trying to solve everything at once. Start with a focused rollout.
1. Pick a pilot use case
Choose one reporting area with clear value, such as:
- Sales pipeline visibility
- Marketing campaign performance
- Budget vs actual finance reporting
- Inventory and fulfillment tracking
2. Align stakeholders early
Bring together business owners, analysts, and IT or data teams. Agree on:
- The business question to solve
- The data sources involved
- KPI definitions
- Security requirements
- Success criteria
3. Build measurable goals
Define what success looks like. Examples include:
- Reducing report preparation time by 50%
- Increasing dashboard adoption across managers
- Improving forecast visibility
- Standardizing KPI definitions across departments
4. Establish trusted data models
Before expanding self-service access, make sure the foundational metrics are consistent and governed.
5. Train users and iterate
Launch with support, gather feedback, improve dashboard usability, and expand gradually.
Final Thoughts
Cloud Business Intelligence gives organizations a more agile way to collect, analyze, and share data. Compared with traditional BI, it generally offers faster deployment, broader accessibility, easier collaboration, and more scalable analytics.
But the technology alone is not the whole story. Success depends on good data modeling, clear governance, strong stakeholder alignment, and a rollout plan grounded in real business needs.
If you understand the concept clearly, start small, and choose the right platform, Cloud Business Intelligence can become more than a reporting tool. It can become the operating layer for smarter, faster decision-making across the business.


