Reporting Tools
What Are the Types of Financial Statements and Their Definitions
Lewis Chou
Mar 20, 2026
You often work with four main types of financial statements: the balance sheet, income statement, cash flow statement, and statement of equity. Each serves a unique purpose in financial management and helps you understand a company’s financial health.
- The balance sheet shows what a business owns and owes, making it easier to compare financial positions over time.
- The income statement reveals revenue and expenses, helping you spot trends and measure profit.
- The cash flow statement tracks money moving in and out, supporting better decisions about stability.
- The statement of equity explains changes in ownership value.
With modern tools like FineReport, you can quickly create and analyze these reports, making financial statements definition and review more efficient.
Types of Financial Statements

Understanding the types of financial statements is essential for anyone involved in business or finance. These statements give you a clear view of a company’s financial health and performance. The four main types are the balance sheet, income statement, cash flow statement, and statement of equity. Each one serves a unique purpose and helps you make informed decisions.
Quick Reference Table: Main Financial Statements and Their Definitions
| Financial Statement | Definition |
|---|---|
| Balance Sheet | Snapshot of assets, liabilities, and equity at a specific point in time. |
| Income Statement | Report showing income and expenses over a period, indicating profit or loss. |
| Cash Flow Statement | Statement tracking cash entering and leaving a business, showing available working capital. |
| Statement of Equity | Document detailing changes in share capital, retained earnings, and reserves over a period. |
Balance Sheet Overview
The balance sheet gives you a snapshot of a company’s financial position at a specific moment. It lists what the business owns, what it owes, and the value left for owners. When you review balance sheets, you can quickly see if a company has enough resources to cover its debts. FineReport makes it easy to generate balance sheets by connecting to your data sources and presenting the information in a clear, organized format.
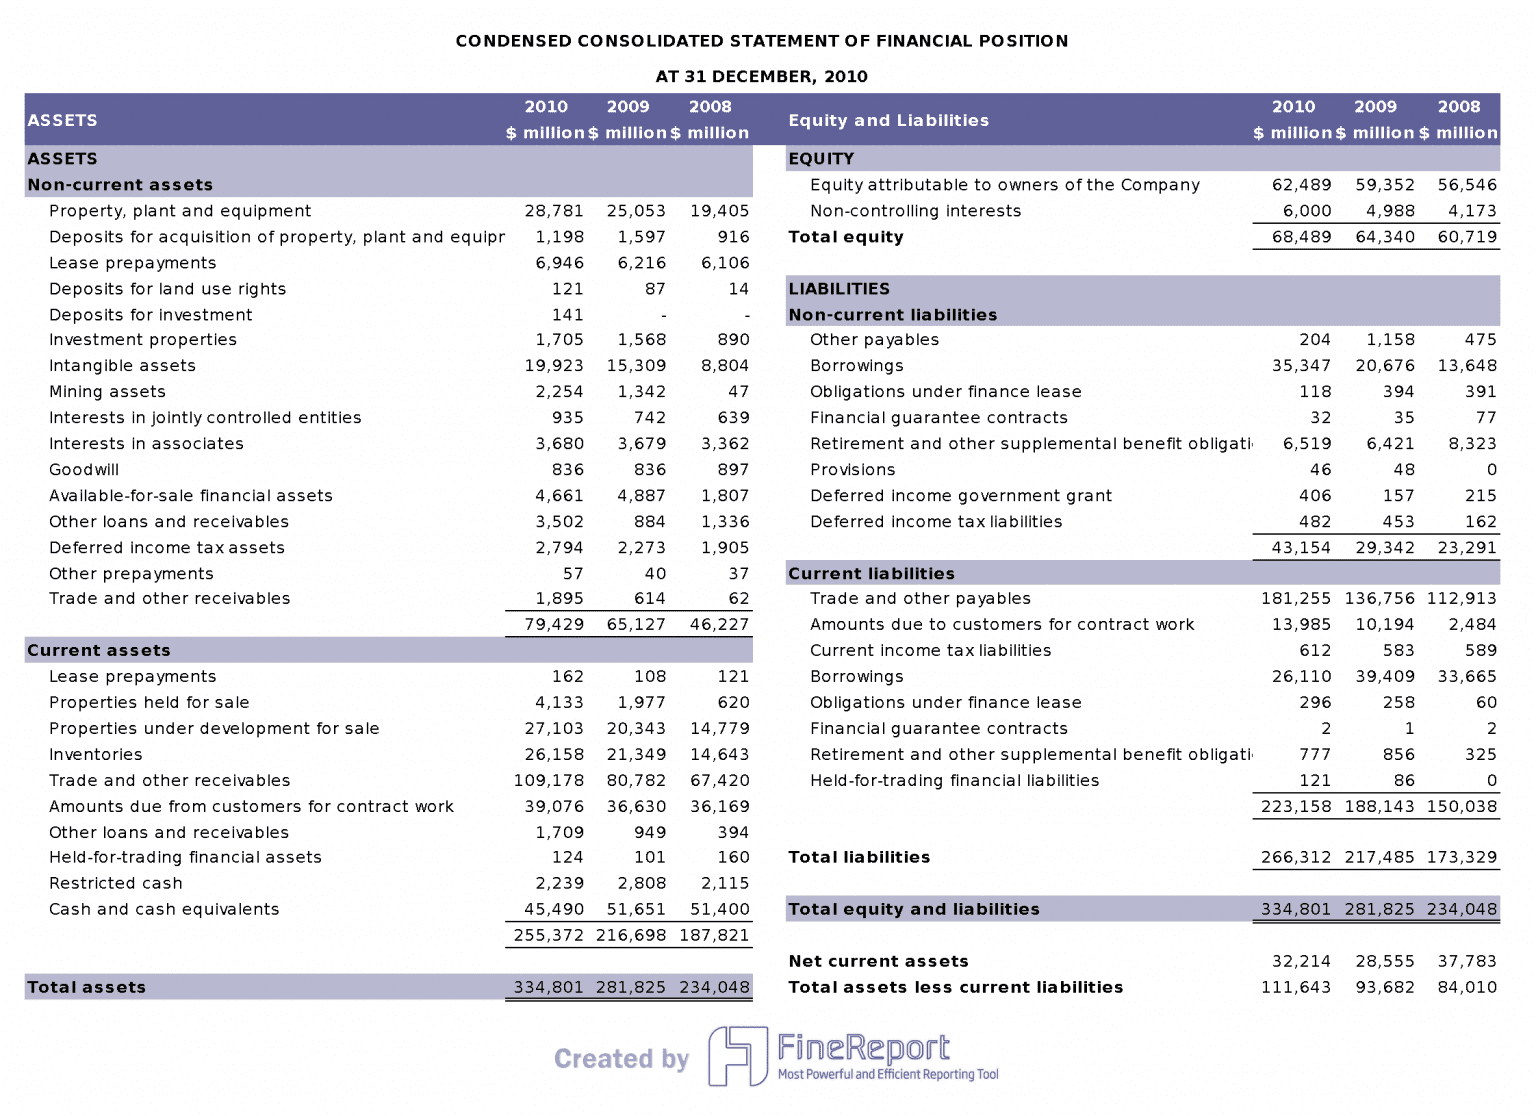
Assets
Assets are everything a company owns that has value. You will find assets divided into current and long-term categories. Current assets include cash, accounts receivable, and inventory. These are items you expect to turn into cash within a year. Long-term assets include property, equipment, and investments that you plan to keep for more than a year. When you use FineReport, you can track and visualize assets across different periods, making it easier to spot trends.
Liabilities
Liabilities show what a company owes to others. Current liabilities are debts due within a year, such as accounts payable and short-term loans. Long-term liabilities include loans and bonds that are due after one year. By analyzing liabilities on balance sheets, you can assess whether a business can meet its short-term and long-term obligations.
Equity
Equity represents the owners’ share of the business after subtracting liabilities from assets. It includes items like common stock and retained earnings. Equity shows the value that belongs to shareholders. Reviewing equity on balance sheets helps you understand how much of the company’s value is owned outright.
Tip: FineReport allows you to customize your balance sheet layout, so you can highlight the most important asset, liability, and equity categories for your business.
Income Statement Overview
The income statement, sometimes called the profit and loss statement, shows how much money a company made and spent over a specific period. It helps you measure profitability and spot trends in income and expenses. Income statements are essential for tracking business performance and making future plans. FineReport can automate the creation of income statements, pulling data from multiple sources and ensuring accuracy.
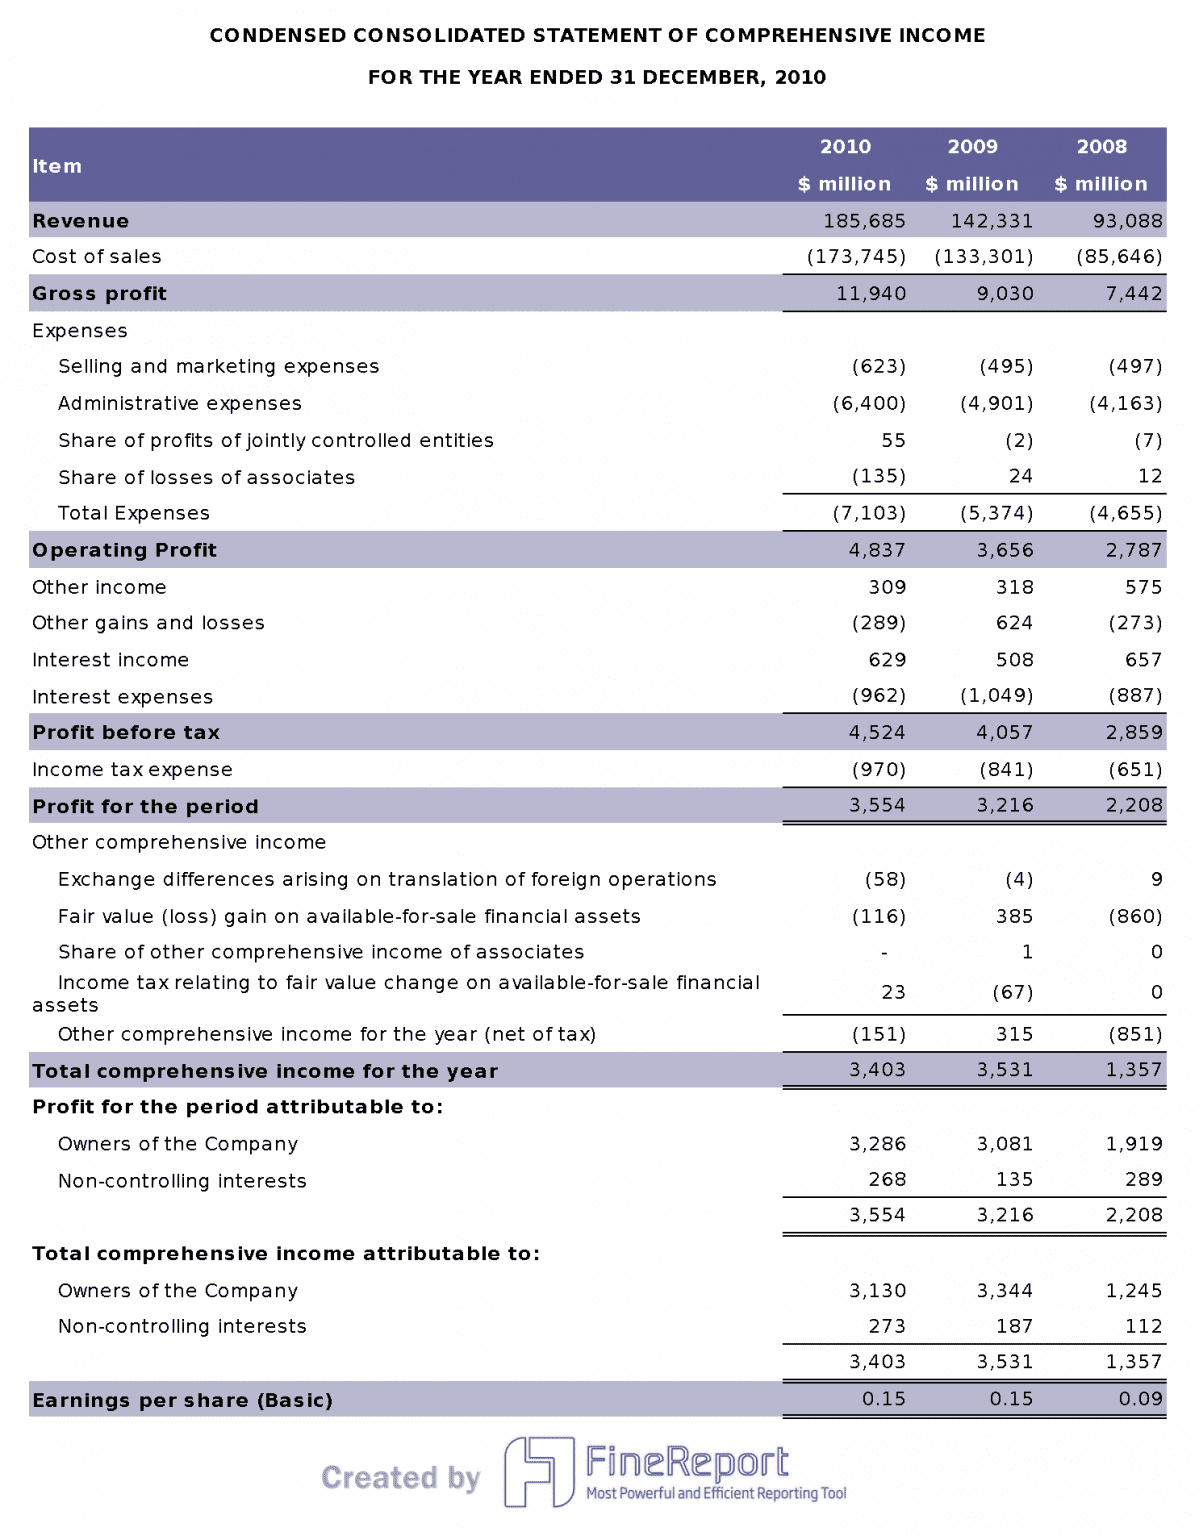
Revenue
Revenue is the total amount of money a company earns from its main business activities. This includes sales of products or services. Revenue appears at the top of income statements and serves as the starting point for measuring financial performance.
Expenses
Expenses are the costs a company incurs to earn revenue. These include the cost of goods sold, salaries, rent, utilities, and other operating costs. By tracking expenses on income statements, you can identify areas where the business might save money.
Net Income
Net income is the profit left after subtracting all expenses from revenue. It is the bottom line of the income statement and shows whether the company made a profit or loss during the period. Reviewing net income on income statements helps you evaluate business success and compare performance over time.
Note: FineReport’s drag-and-drop interface makes it simple to design income statements that match your reporting needs, whether you want a detailed breakdown or a high-level summary.
Cash Flow Statement Overview
The cash flow statement tracks the movement of cash into and out of a business. It helps you understand how well a company manages its cash and whether it can meet its financial obligations. The statement of cash flows divides cash activities into three categories: operating, investing, and financing. FineReport can generate cash flow statements automatically, giving you real-time insights into your company’s liquidity.
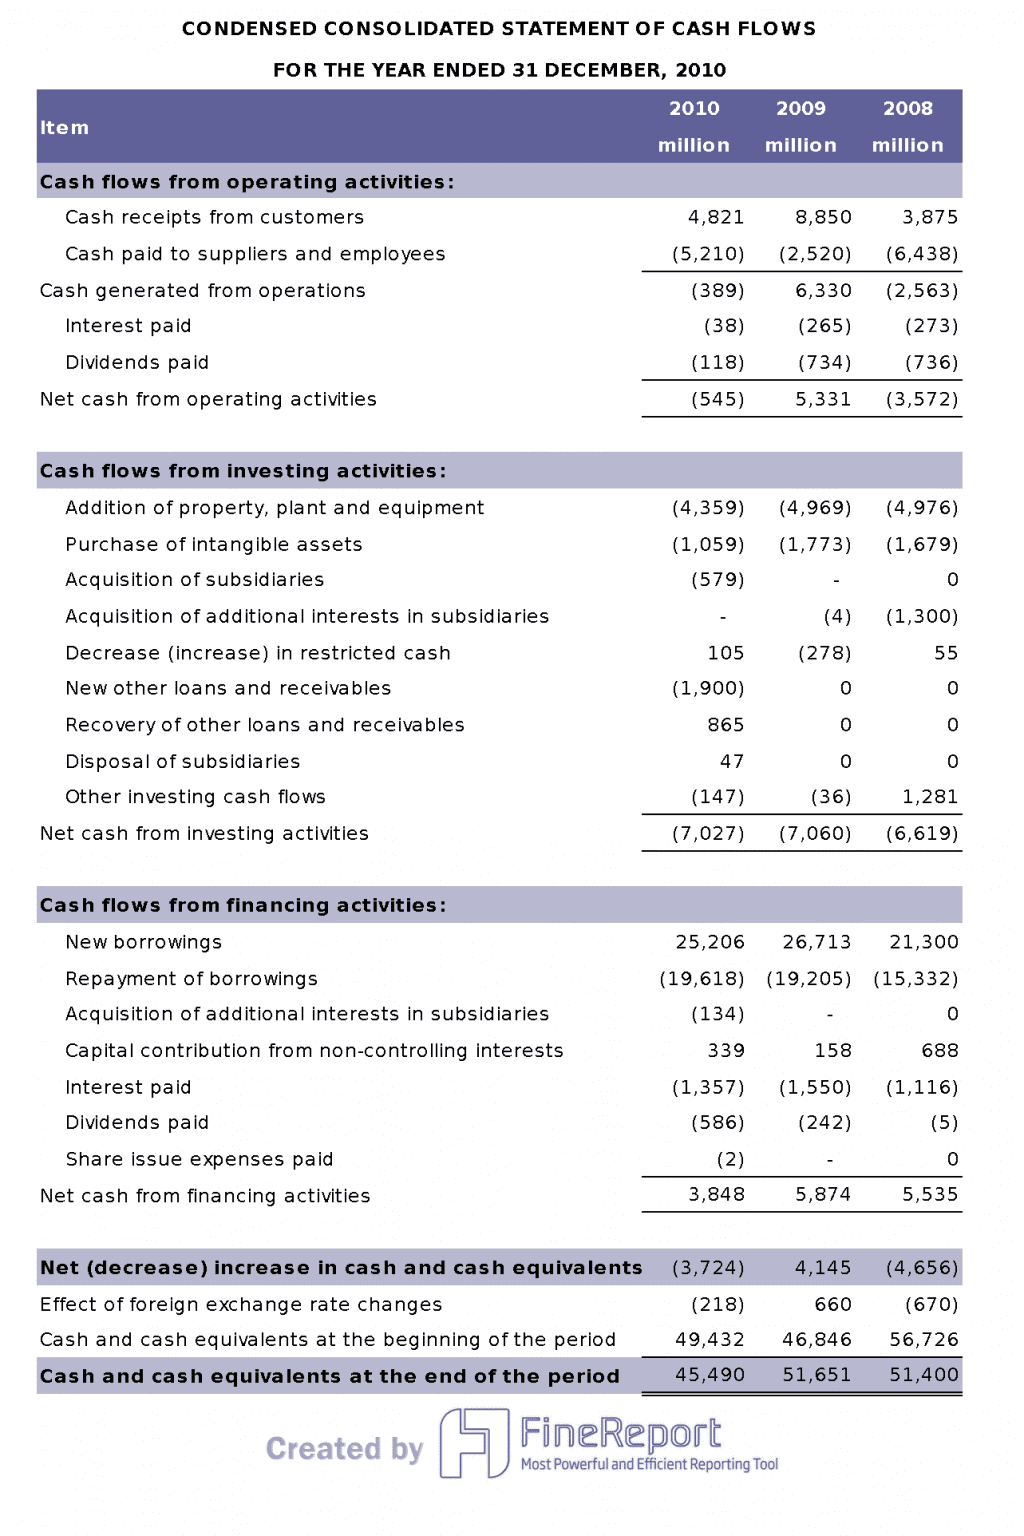
Operating Activities
Operating activities include the cash generated or used by the company’s main business operations. This covers cash received from customers and cash paid for expenses like wages, rent, and supplies. Monitoring operating activities on cash flow statements helps you see if the business generates enough cash from its core operations.
Investing Activities
Investing activities show cash spent on or received from buying and selling long-term assets, such as property, equipment, or investments. These activities indicate how a company invests in its future growth. Reviewing investing activities on cash flow statements helps you understand the company’s investment strategy.
Financing Activities
Financing activities involve cash flows related to borrowing money, repaying loans, issuing stock, or paying dividends. These activities reveal how a company raises capital and manages its financial structure. By analyzing financing activities on cash flow statements, you can see how the business funds its operations and growth.
Tip: FineReport’s real-time data integration ensures your cash flow statement always reflects the latest transactions, helping you make timely decisions.
Statement of Equity Overview
The statement of equity, also called the statement of changes in equity, shows you how a company’s ownership value changes over time. You can see how profits, losses, dividends, and new investments affect the total equity. This statement helps you track the movement in share capital, retained earnings, and other equity items. When you review this report, you get a clear picture of how the company manages its profits and how these actions impact your ownership interest.
You will find this statement important if you are a shareholder. It gives you insight into the company’s financial health and performance. You can see how much value your investment holds and how the company’s actions—like issuing new shares or paying dividends—change your stake. The statement starts with the opening balance of equity, adds net income, includes any new contributions, and subtracts distributions or withdrawals. This process leads to the ending equity for the period.
FineReport streamlines the creation of the statement of equity. You can pull data from multiple sources, automate calculations, and visualize changes in equity with clear tables and charts. This makes it easier for you to understand complex movements in ownership value.
Share Capital
Share capital represents the money that shareholders invest in the company by purchasing shares. You can think of it as the foundation of the company’s equity. When a business issues new shares, the share capital increases. If the company buys back shares, the share capital decreases. Tracking share capital helps you see how much money owners have put into the business and how ownership changes over time.
Tip: FineReport allows you to display share capital changes in a clear, customizable table, making it easy to spot trends and analyze ownership shifts.
Retained Earnings
Retained earnings show the profits that the company keeps instead of paying out as dividends. These earnings help the business grow, fund new projects, or strengthen its financial position. Each period, the company adds net income to retained earnings and subtracts any dividends paid to shareholders. By looking at retained earnings, you can see how much profit the company reinvests for future growth.
FineReport can automatically update retained earnings in your statement of equity. You can track changes over time and compare them with other companies in your industry.
Other Equity Items
Other equity items include reserves, accumulated other comprehensive income, and adjustments from share-based payments or foreign currency translation. These items may not fit under share capital or retained earnings, but they still affect the total equity. You should pay attention to these items because they can impact the value of your ownership, especially during periods of market change or company restructuring.
FineReport helps you organize and present these items clearly. You can use visual tools to highlight significant changes and ensure you do not miss important details.
The statement of equity gives you a complete view of how ownership value changes. It helps you make informed decisions about your investment and understand the company’s financial stability.
Financial Statements Integration

How Statements Work Together
You can understand a company’s financial story best when you see how the main statements connect. Each statement gives you a different piece of the puzzle. The income statement shows how much profit or loss the business made during a period. The cash flow statement reveals how money moved in and out, helping you see if the company can pay its bills. The balance sheet gives you a snapshot of what the company owns and owes at a specific time. The statement of equity explains how ownership value changes.
When you look at these statements together, you get a complete view of the company’s financial health. For example, net income from the income statement increases retained earnings on the statement of equity. Cash from operations on the cash flow statement helps you check if profits are turning into real cash. The balance sheet shows the results of all these activities in assets, liabilities, and equity.
Here is a table that summarizes how each statement fits into financial reporting:
| Financial Statement | Description |
|---|---|
| Income Statement | Shows profit and loss over a period, detailing revenue, expenses, and net income. |
| Cash Flow Statement | Illustrates cash inflows and outflows, indicating available working capital at a given time. |
| Balance Sheet | Displays assets, liabilities, and equity, providing a snapshot of the company's financial position. |
| Statement of Change in Equity | Details changes in share capital and retained earnings, reflecting equity changes among shareholders. |
You can use these statements together to spot trends, compare periods, and make better decisions. When you see how they link, you can answer questions like, “Did profits turn into cash?” or “How did new investments affect ownership?”
FineReport for Financial Data Management
FineReport helps you manage and integrate all your financial data in one place. You can connect data from different sources and create reports that update in real time. This tool supports teamwork by letting you set data permissions and collaborate securely. You can handle large amounts of data without slowing down, and you can enter or change data easily on your computer or mobile device.

FineReport’s validation checks help you keep your data accurate. You can trust the numbers in your reports because the system checks for errors as you enter information.
Here is a table that shows how FineReport improves your financial data management:
| Feature | Benefit |
|---|---|
| Enhanced Collaboration | Advanced data permissions and collaborative features for secure teamwork. |
| Optimized for Large Datasets | Efficient handling of extensive datasets with superior real-time analysis capabilities. |
| Robust Data Entry | Easily add, delete, or modify data on PCs or mobile devices, ensuring data accuracy with validation checks. |
You can automate report creation and distribution, which saves you time and reduces mistakes. FineReport lets you focus on analyzing results instead of collecting data. This makes your financial reporting process faster, more accurate, and easier to manage.

Key Financial Terms
Assets vs. Liabilities
You need to understand the difference between assets and liabilities to read financial statements. Assets are resources your company owns that have value, such as cash, inventory, or equipment. Liabilities are what your company owes to others, like loans or unpaid bills. The balance sheet equation—Assets = Liabilities + Shareholders’ Equity—shows how these two terms connect.
When you compare assets and liabilities, you can measure your company’s financial health. If assets are much higher than liabilities, your business is in a strong position.
Here is a table that shows important ratios you can use to analyze assets and liabilities:
| Ratio | Description | Implication on Financial Health |
|---|---|---|
| Current Ratio | Compares current assets to current liabilities. | Higher ratio means better short-term stability. |
| Debt-to-Equity Ratio | Compares total liabilities to shareholders' equity. | Lower ratio means less financial risk. |
| Quick Ratio | Measures ability to pay short-term debts with liquid assets. | Above one means strong financial health. |
You should review your balance sheet regularly. This helps you check if your company can pay its bills and stay solvent. Investors and creditors also look at these numbers to decide if your business is a safe bet.
Profit vs. Cash Flow
Profit and cash flow are two terms you will see often in financial analysis. Profit is the money left after you subtract all expenses from revenue. Cash flow shows the actual movement of cash in and out of your business. You might earn a profit but still run out of cash if customers do not pay on time.
You need to track both profit and cash flow to manage your business well. Profit tells you if your business is making money. Cash flow tells you if you have enough cash to pay your bills and invest in growth.
Here is a table that compares two companies with the same revenue but different profit and cash flow situations:
| Company | Revenue | Profit | Cash Collected | Cash in Bank | Expenses Due |
|---|---|---|---|---|---|
| A | $2M | $500K | $200K | $200K | $800K |
| B | $2M | $300K | $1.9M | $1.4M | N/A |
- Company A has a higher profit but less cash on hand because many invoices are unpaid.
- Company B has less profit but much more cash available.
You should always check both numbers. Cash flow analysis helps you spot problems early and avoid running out of money, even if your business looks profitable on paper.
Equity Explained
Equity is the value left in your company after you subtract all liabilities from assets. You can think of equity as what you truly own in the business. It includes items like retained earnings, common stock, and additional paid-in capital.
Here is a table that explains equity and its main components:
| Definition of Equity | Main Components of Equity |
|---|---|
| The value left after subtracting liabilities from assets. | Retained earnings, common stock, paid-in capital, share capital, capital surplus |
Equity is a key indicator of your company’s financial stability. If your equity is positive, your business is healthy. If it turns negative, your liabilities are greater than your assets, which signals financial trouble.
| Topic | Description |
|---|---|
| Equity Definition | The interest left in assets after deducting liabilities. |
| Total Equity and Its Importance | Shows the total worth of your company to owners. |
| Negative Owner’s Equity | Means liabilities are higher than assets, a warning sign. |
| Equity: A Key Indicator | Essential for investment and lending decisions. |
You should monitor equity to see how your business grows over time. Lenders and investors use equity to judge if your company is a good investment or loan risk. By understanding equity, you can make better decisions for your company’s future.
FineReport in Financial Reporting
Automating Financial Statements
You can save time and reduce errors by automating your financial statements with FineReport. The software connects to your business systems and gathers data from different sources. You do not need to copy numbers by hand or worry about mistakes. FineReport generates reports quickly and updates them when your data changes. This automation helps you keep up with new reporting needs and makes your work more accurate. Many finance teams use FineReport to handle complex reporting tasks that used to take hours. Now, you can focus on understanding your numbers instead of collecting them.
FineReport helps you respond to changes in your business. You can adjust your reports easily and meet new requirements without starting from scratch.
Real-Time Data Entry and Aggregation
You can track your financial data as it happens with FineReport’s real-time features. The dashboard lets you see key numbers and trends right away. You do not have to wait for the end of the month to check your results. FineReport works on your computer, tablet, or phone, so you can monitor your business anywhere. The system refreshes your data automatically, which is helpful in busy places like command centers or classrooms.
| Feature | Description |
|---|---|
| Dashboard | Lets you monitor and analyze data in real time, creating a management cockpit for decision makers. |
| Multi-terminal display | Access key indicators on mobile devices, so you can check data anytime and anywhere. |
| Monitor refreshing | Updates key indicators instantly in different settings, keeping you informed at all times. |
You can enter new data or make changes on the go. FineReport checks your entries for errors, so your reports stay reliable.
Visualization and Analysis
You can turn your financial data into clear visuals with FineReport’s advanced tools. The software offers many types of charts, such as bar graphs, line charts, and even Sankey diagrams. These visuals help you spot patterns and understand complex information quickly. You can use plugins to add more features and customize your reports for your needs.
| Tool Type | Description |
|---|---|
| Advanced Charts | Many chart types for visualizing financial data, making trends easy to see. |
| Plugins | Add-ons for practical applications, improving how you view and analyze data. |
- Sankey diagrams show how money flows through your business, giving you deeper insights than a simple pie chart.
- Parallel graphs help you compare several numbers at once, making it easier to see connections.
FineReport lets you share these visuals with your team. Everyone can understand the results, even if they are not financial experts.
You can see how companies like Founder Securities use FineReport to improve their financial reporting. They track key numbers, analyze trends, and make better decisions faster. With FineReport, you can do the same for your business.
Industry Solutions and Use Cases
Financial Management Challenges
You face many challenges in financial management. These obstacles can slow down your work and make it harder to keep your business on track. Here are some of the most common issues you might encounter:
- Complex revenue recognition for long-term projects can make it difficult to track income accurately.
- Managing work-in-progress (WIP) accounting often requires careful monitoring and frequent updates.
- Handling employee-related costs can become confusing, especially when you deal with multiple departments or changing payroll rules.
- Accurate financial reporting is essential, but manual processes increase the risk of errors.
- Billing cycles can impact your cash flow, making it hard to predict when you will have enough money to cover expenses.
You need to solve these problems to keep your business healthy and competitive. If you do not address them, you may struggle with late payments, missed opportunities, or compliance issues.
FineReport Solution Overview
FineReport helps you overcome these financial management challenges with a set of powerful tools. You can use FineReport to automate your reporting, which reduces errors and saves time. The software connects to your existing data sources, so you do not need to enter information twice. You can track revenue, expenses, and cash flow in real time.
FineReport enhances operational efficiency and supports market growth. You can optimize your processes and focus on what matters most—growing your business. The platform also helps you with funnel analysis and competitive intelligence. This is especially useful if you manage large amounts of data or need to compare performance across different teams.
You can customize reports and dashboards to fit your needs. FineReport lets you set up permissions, so only the right people see sensitive information. You can access your reports on any device, which means you stay informed wherever you are. The system checks your data for accuracy, helping you trust your numbers.
FineReport gives you the flexibility to adapt as your business changes. You can add new data sources, update templates, and scale your reporting as you grow.
Customer Story: Founder Securities
Founder Securities, a leading financial services company, wanted to improve its data-driven decision-making. You can learn from their experience. They used FineReport to streamline their workflows and make financial data more accessible. Over 2,000 employees gained the ability to analyze data independently, which improved both speed and accuracy.
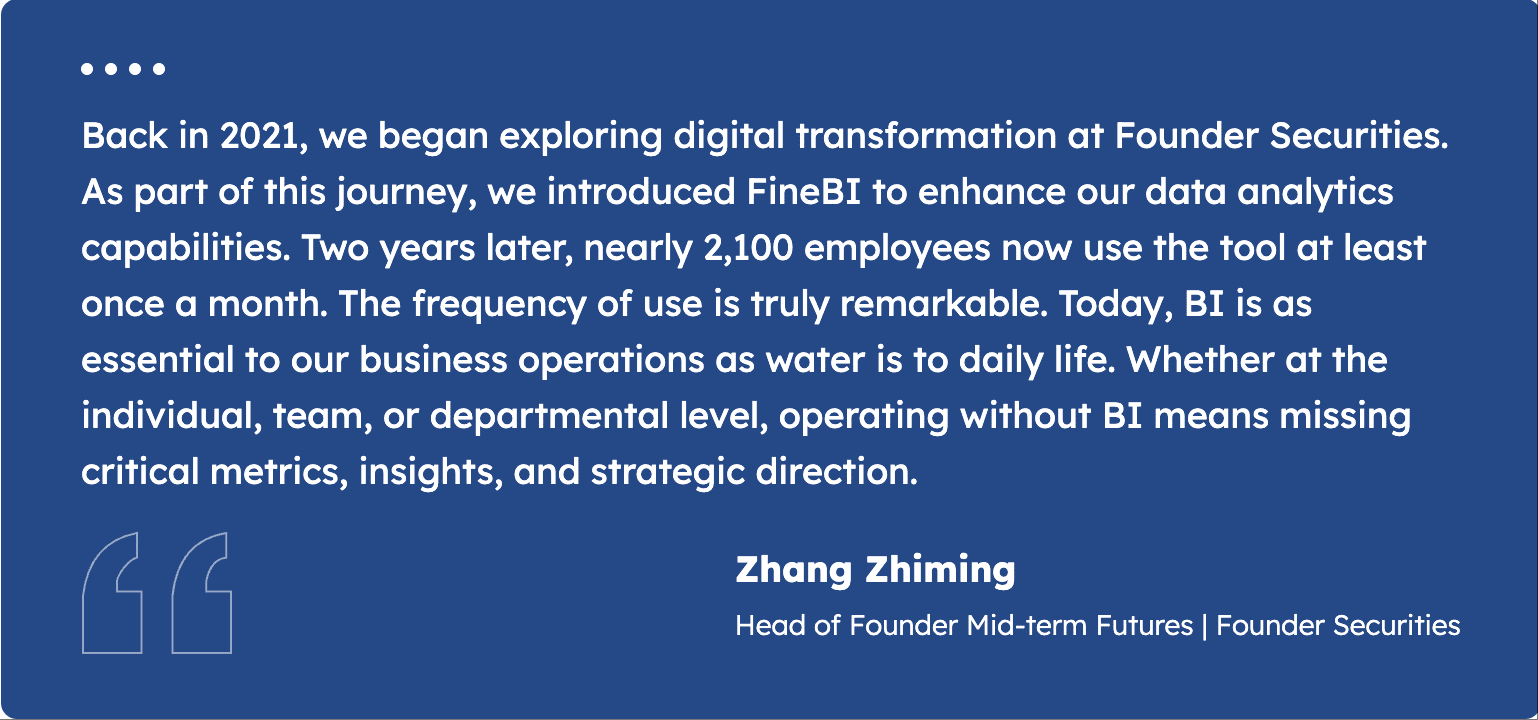
During a major merger, Founder Securities needed to migrate 50,000 user accounts. FineReport played a key role in this process. The company used the platform to segment customers, monitor migration progress, and ensure business continuity. The Operations Center completed the migration without disrupting client activities.
Founder Securities now uses FineReport to monitor customer behavior, analyze trends, and make better decisions. You can see how a modern reporting tool transforms financial management and supports sustainable growth.
You gain valuable insight when you understand the types of financial statements and their definitions. These reports help you evaluate a company’s financial health and make informed decisions. Investors and lenders rely on them to judge business performance. You benefit most when you review multiple statements together.
- Financial statements provide standardized reports for clear analysis.
- You can use them to track assets, liabilities, and equity.
- FineReport streamlines your reporting process and improves accuracy.
- Modern tools help you manage data and visualize results.
Take advantage of solutions like FineReport to boost efficiency and support better financial management.


FAQ

The Author
Lewis Chou
Senior Data Analyst at FanRuan
Related Articles

Best Reporting Tools for In-House Teams: 7 Options Compared for Dashboards, Scheduled Reports, and Operational Reporting
If you are searching for the $1 for in house teams , you are likely trying to solve a practical problem: how to give internal stakeholders reliable dashboards, recurring reports, and operational visibility without creati
Yida YIn
Jul 02, 2026

Best Finance Reporting Software for CFOs in 2026: 7 Tools Compared for Automation, Governance, and Reporting Depth
If you are searching for finance $1 , you are likely trying to solve a familiar CFO problem: finance data exists across ERP systems, spreadsheets, and BI dashboards, but producing reliable, board ready, repeatable report
Yida Yin
Jul 02, 2026

7 White Label Reporting Tool Options Compared: What Agencies and SaaS Teams Should Evaluate Before Buying
A white label $1 is software that lets you deliver dashboards, reports, or analytics experiences under your own brand instead of the vendor’s. If you are a marketing agency, consultancy, SaaS company, or product team, yo
Yida Yin
Jul 01, 2026