Data discovery tools help you quickly find, organize, and analyze data across sources so you can uncover insights, trends, and anomalies for smarter decisions.Here are the top 10 data discovery tools for businesses in 2026:
FineReport by FanRuan
Microsoft Power BI
Tableau
Qlik Sense
Looker
Alation
Collibra
Atlan
Informatica Data Discovery
BigID
When you choose the right tool, you get a clear view of your data, spot trends, and find outliers fast. You can see the bigger picture, make smarter decisions, and boost compliance. In retail, these tools help you understand what customers want. In finance, they make risk management easier. Healthcare organizations use them to improve patient care.
What Are Data Discovery Tools?
Definition and Purpose
When you hear about data discovery tools, you might wonder what they actually do. These tools help you find, organize, and understand your data, no matter where it lives. You can use data discovery software to search through databases, spreadsheets, and even cloud storage. The goal is simple: make your data easy to find and use.
Data discovery tools let you uncover patterns, spot trends, and highlight outliers. You get to see the big picture and the tiny details. With these tools, you can make smarter choices for your business.
Here’s a quick look at why businesses rely on data discovery solutions:
Purpose
Description
Informed decision making
Uncover patterns, trends, and outliers for data-driven choices.
Enhanced efficiency
Streamline processes and save money by finding inefficiencies.
Competitive advantage
Identify market trends and understand customer behavior.
Solid security
Spot risks early, including market volatility and cybersecurity threats.
Increased agility
Monitor trends in real time and respond quickly to changes.
Innovation
Fuel new ideas and business models with fresh insights.
Why Businesses Need Data Discovery
You face a lot of challenges when you manage data. Sometimes, your data sits in silos, making it hard to get a complete view. You might deal with poor data quality, which can lead to mistakes. As your business grows, your data grows too, and that can slow things down. Security and compliance also become more important.
Data discovery tools solve these problems. They help you break down silos and unify your data. You can automate quality checks and keep your data accurate. These tools scale with your business, so you never fall behind. You also get better security and can meet compliance rules with ease.
When you use data discovery solutions, you speed up how you collect and process information. You can spot issues before they become big problems. You get clear insights into customer behavior, so you can respond faster and smarter. Leaders use these tools to dig deep into their business models and find ways to improve. You get the power to innovate and stay ahead of the competition.
Key Features of the Best Data Discovery Tools
Essential Capabilities for Business Users
When you look for data discovery tools, you want features that make your work easier and faster. The best tools help you connect to all your data, clean it up, and turn it into useful information. You get ai-powered insights that show you patterns and trends you might miss. With customizable dashboards, you can see the information that matters most to you.
Automated data tagging. Metadata intelligence helps you organize your data quickly.
Built-in governance and access control. You keep your data secure and only share it with the right people.
Take a look at this table to see how these capabilities help you:
Evidence
Description
Self-Service Analytics
You can analyze data quickly and make better decisions for your team.
Data Preparation
You clean and transform data without waiting for IT support.
Data Integration
You find trends by combining data from different sources.
Increased Agility
You adjust to market changes fast and stay ahead.
Enhanced Collaboration
You share visual stories and insights with others easily.
Benefits for Organizations
When you use advanced data discovery solutions, your whole organization wins. You get ai-powered insights that help you make smarter choices. Customizable dashboards let you track key metrics and spot problems before they grow. Your business intelligence improves because you see the big picture and the small details.
Here are some benefits you can expect:
Improved decision-making. You get actionable insights that guide your strategy.
Compliance with regulatory standards. You validate your data and meet rules with confidence.
Faster return on investment. You save time and money by using a powerful data analytics platform.
Increased revenue and reduced costs. You make better choices and avoid mistakes.
Check out this table for a quick summary:
Benefit
Description
Improved Decision-Making
You use insights to make smart strategic moves.
Enhanced Lead Generation
You find new customers by analyzing interactions.
Compliance with Regulatory Standards
You keep your data complete and accurate for audits.
With the right data discovery tools, you unlock the full power of your data analytics platform. You get ai-powered insights, customizable dashboards, and a boost in business intelligence. Your team works together, your data stays secure, and your business grows stronger.
Top 10 Data Discovery Tools in 2026
Choosing the best data discovery tools can feel overwhelming. You want a solution that fits your business, scales with your needs, and helps you make sense of your data. Here’s a look at the top 10 data discovery solutions for 2026, each with unique strengths. Let’s break down what makes each tool stand out and how you can use them to unlock powerful insights.
Define your objectives to clarify what you need from the tool.
2
Map your data landscape to ensure compatibility with existing systems.
3
Separate must-haves from nice-to-haves to focus on essential features.
4
Shortlist and test tools in real scenarios to evaluate performance.
5
Evaluate scalability, support, and cost to ensure long-term viability.
1. FineReport by FanRuan
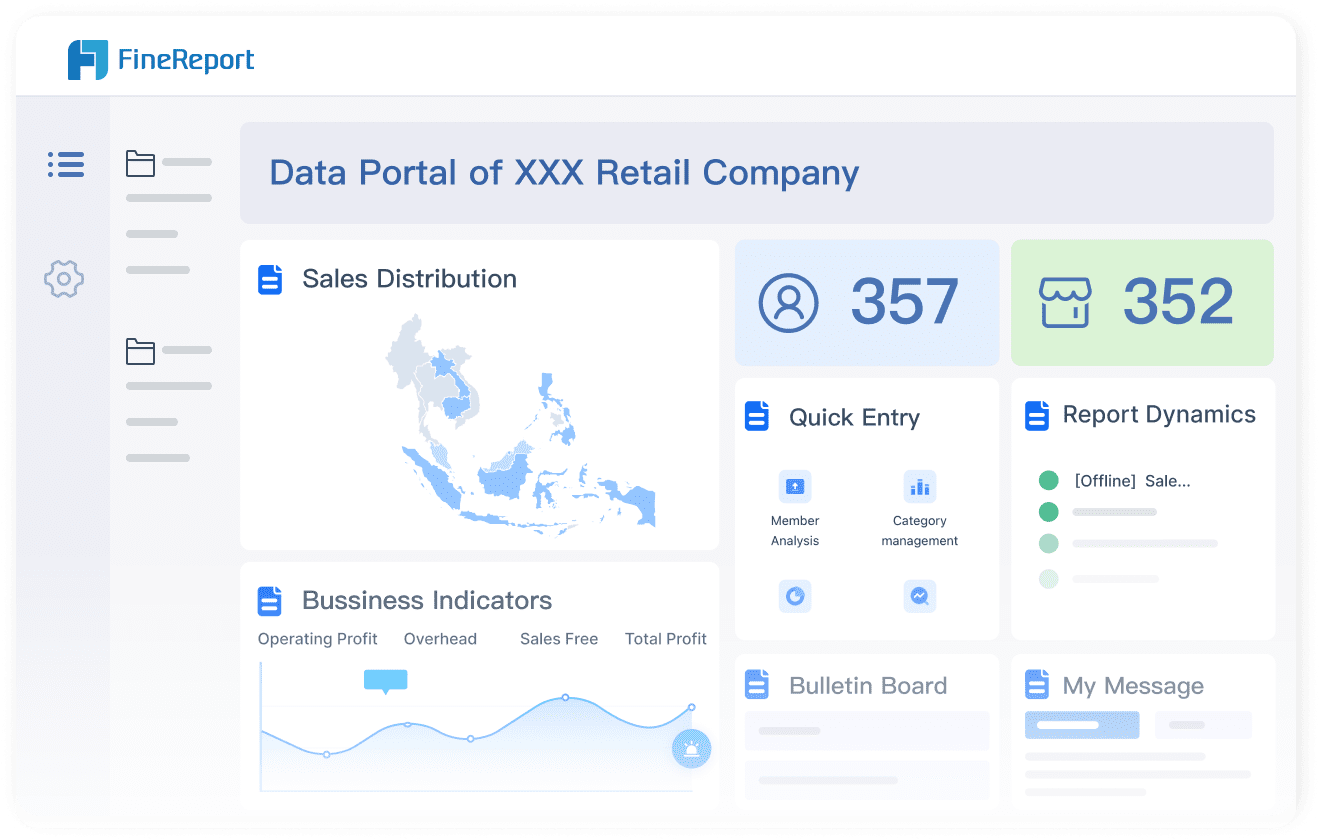
FineReport by FanRuan leads the pack when you need a flexible, enterprise-level reporting and dashboard platform. You get a drag-and-drop designer that feels familiar, like working in Excel, but with much more power. FineReport connects to hundreds of data sources, including databases, files, and cloud platforms. You can create pixel-perfect reports, interactive dashboards, and even 3D visualizations.
You don’t need to write code to build complex reports. The platform supports real-time data integration, so you always see the latest numbers. You can automate report generation and schedule delivery to your team. FineReport’s decision-making platform lets you manage users, permissions, and data security in one place. You can access reports on any device, including mobile, which keeps you informed wherever you go.
If you want to combine data from different systems, FineReport makes it easy. You can build multi-source reports and dashboards that show everything at a glance. The platform’s data entry forms help you collect and manage information efficiently. FineReport stands out among data visualization tools because it offers advanced features like 3D dashboards, mobile BI, and seamless integration with FineBI for self-service analytics.
Tip: FineReport is trusted by over 15,000 companies worldwide. You can use it to streamline reporting, boost collaboration, and drive smarter decisions.
2. Microsoft Power BI
Microsoft Power BI is a favorite for many businesses. You get a cost-effective solution that integrates deeply with Microsoft products like Excel and Azure. Power BI offers rich visualization options, including charts, maps, and dashboards. AI-powered analytics help you spot trends and predict outcomes.
Seamlessly integrates with other Microsoft products like Excel and Azure.
Rich Visualization
Offers a variety of visualization options for data representation.
AI-Enhanced Analytics
Features like predictive analytics and anomaly detection enhance data insights.
Weaknesses of Power BI
Description
Limited NoSQL Support
Struggles with NoSQL databases and REST API integration.
Steep Learning Curve
Advanced features require knowledge of DAX, which can be complex.
Microsoft-Centric Ecosystem
Best performance in Windows and Azure environments, limiting cross-platform use.
You can use Power BI to create interactive dashboards and share insights across your organization. If you already use Microsoft tools, Power BI fits right in.
3. Tableau
Tableau makes data discovery simple and visual. You get an intuitive interface that lets you drag and drop data to create charts and dashboards. You don’t need advanced technical skills to get started. Tableau helps you uncover insights quickly and share them with your team.
Enables advanced data transformations and modeling directly within Qlik Sense, allowing for tailored data models.
Associative Data Modeling
Allows dynamic and flexible data exploration, enabling users to make associations on the fly to uncover insights.
Insight Advisor
Provides intelligent, context-aware suggestions based on data analysis activities, helping users uncover hidden insights.
QIX Engine
A high-speed, in-memory engine that enables rapid data discovery and analysis, ensuring fast queries and visualizations.
Centralized Sharing and Collaboration
Facilitates easy sharing of insights and collaboration on projects, enhancing teamwork and data-driven decision-making.
Embedded Analytics
Integrates Qlik Sense analytics into existing applications, enhancing user productivity by providing insights within familiar workflows.
Extensions and Custom Applications
Offers extensive customization options through extensions and custom application development, allowing organizations to tailor the platform to their needs.
Row-Level Security
Provides comprehensive security features, ensuring users only see data they are authorized to access, enhancing data governance and compliance.
You can embed Qlik Sense analytics into your own apps and customize the platform to fit your business.
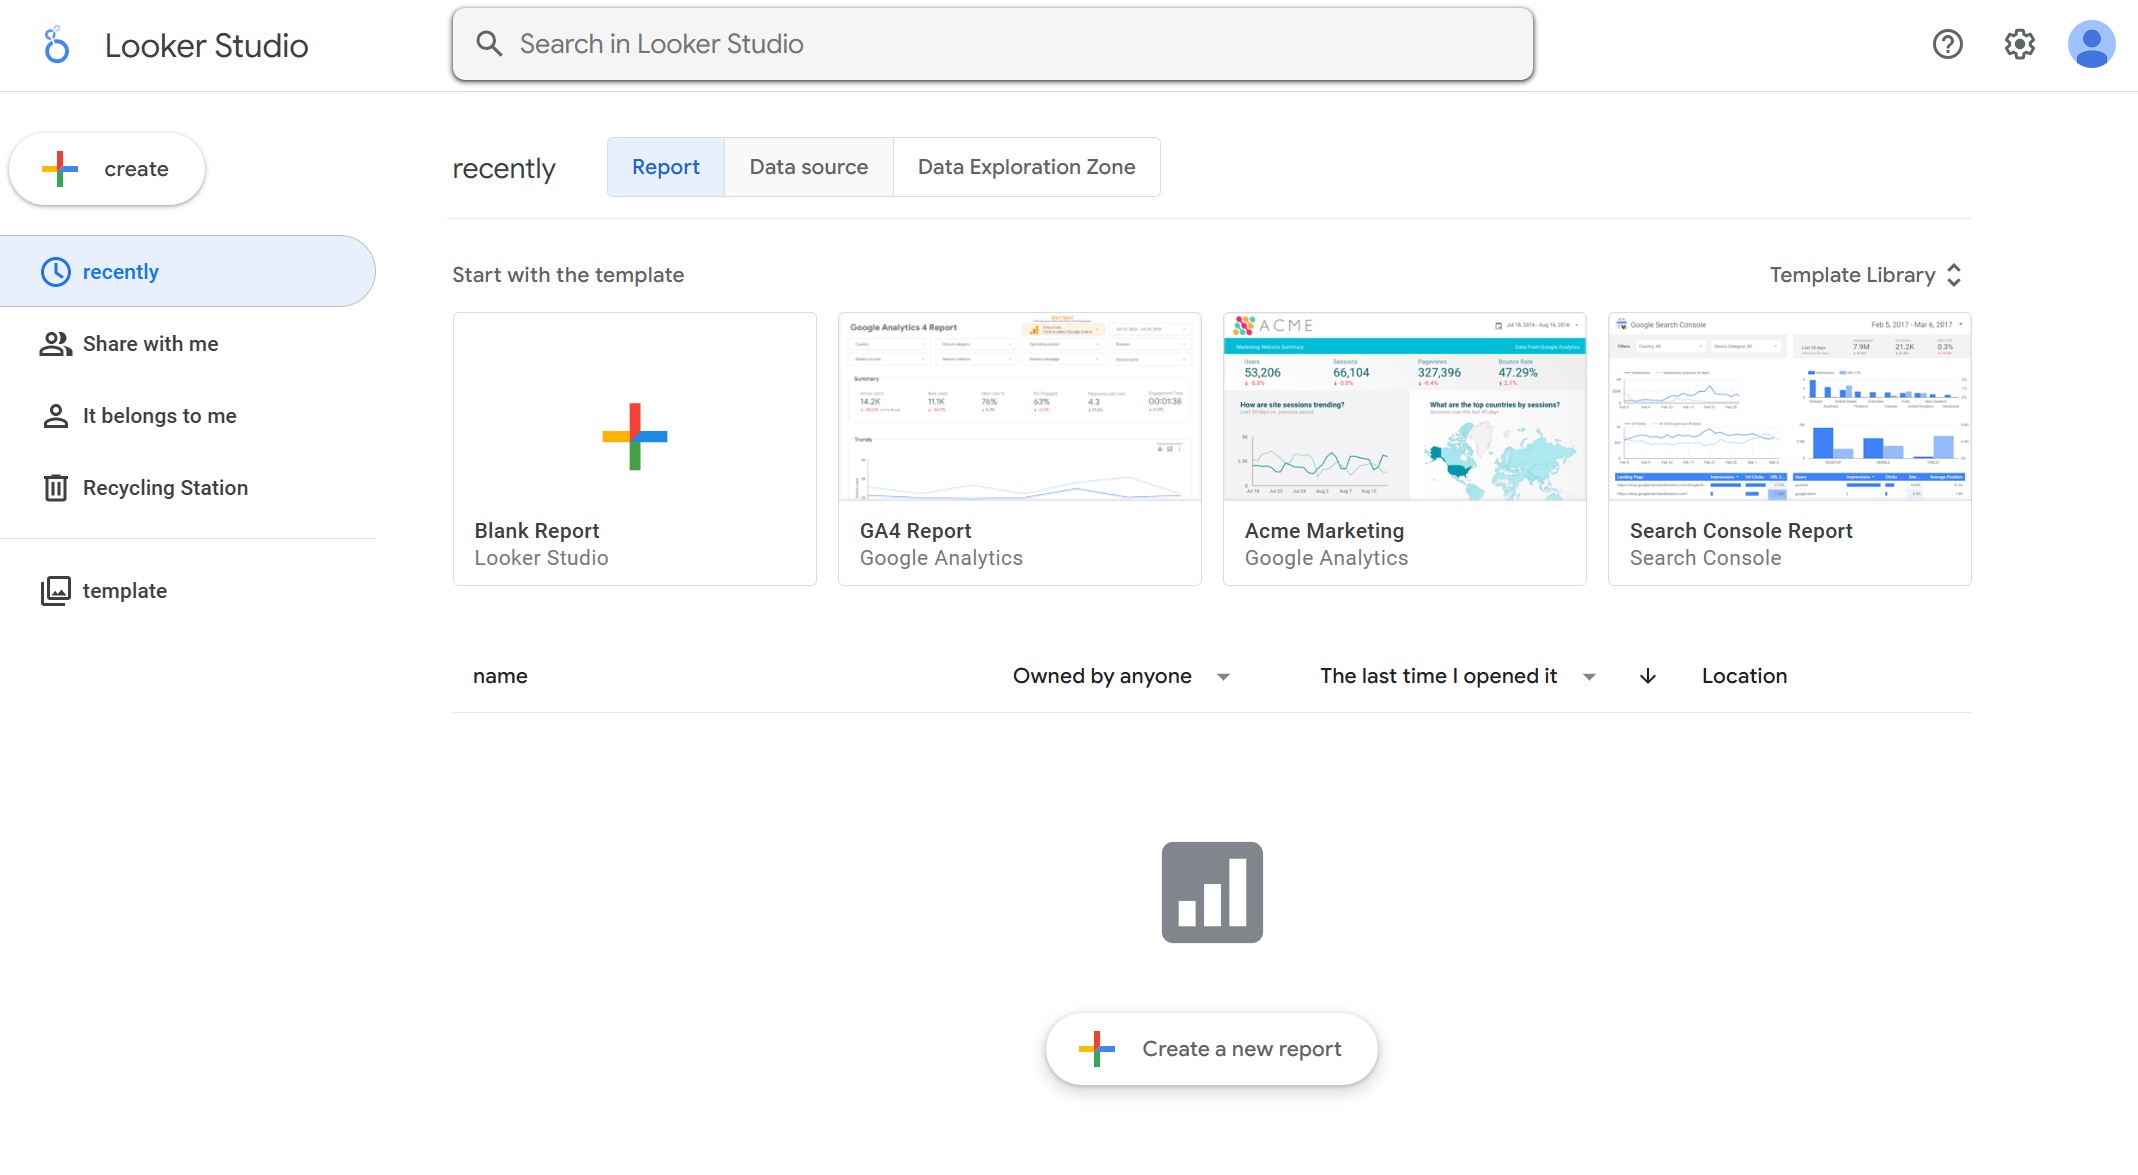
5. Looker
Looker, now part of Google Cloud, takes a code-based approach to data modeling. You use LookML to define metrics and build a single source of truth for your organization. Looker supports real-time data querying, especially with BigQuery, so you always see up-to-date information.
You can embed analytics into your own products and customize dashboards for different teams. Looker is a great fit if you want strong integration with Google Cloud and a unified view of your data.
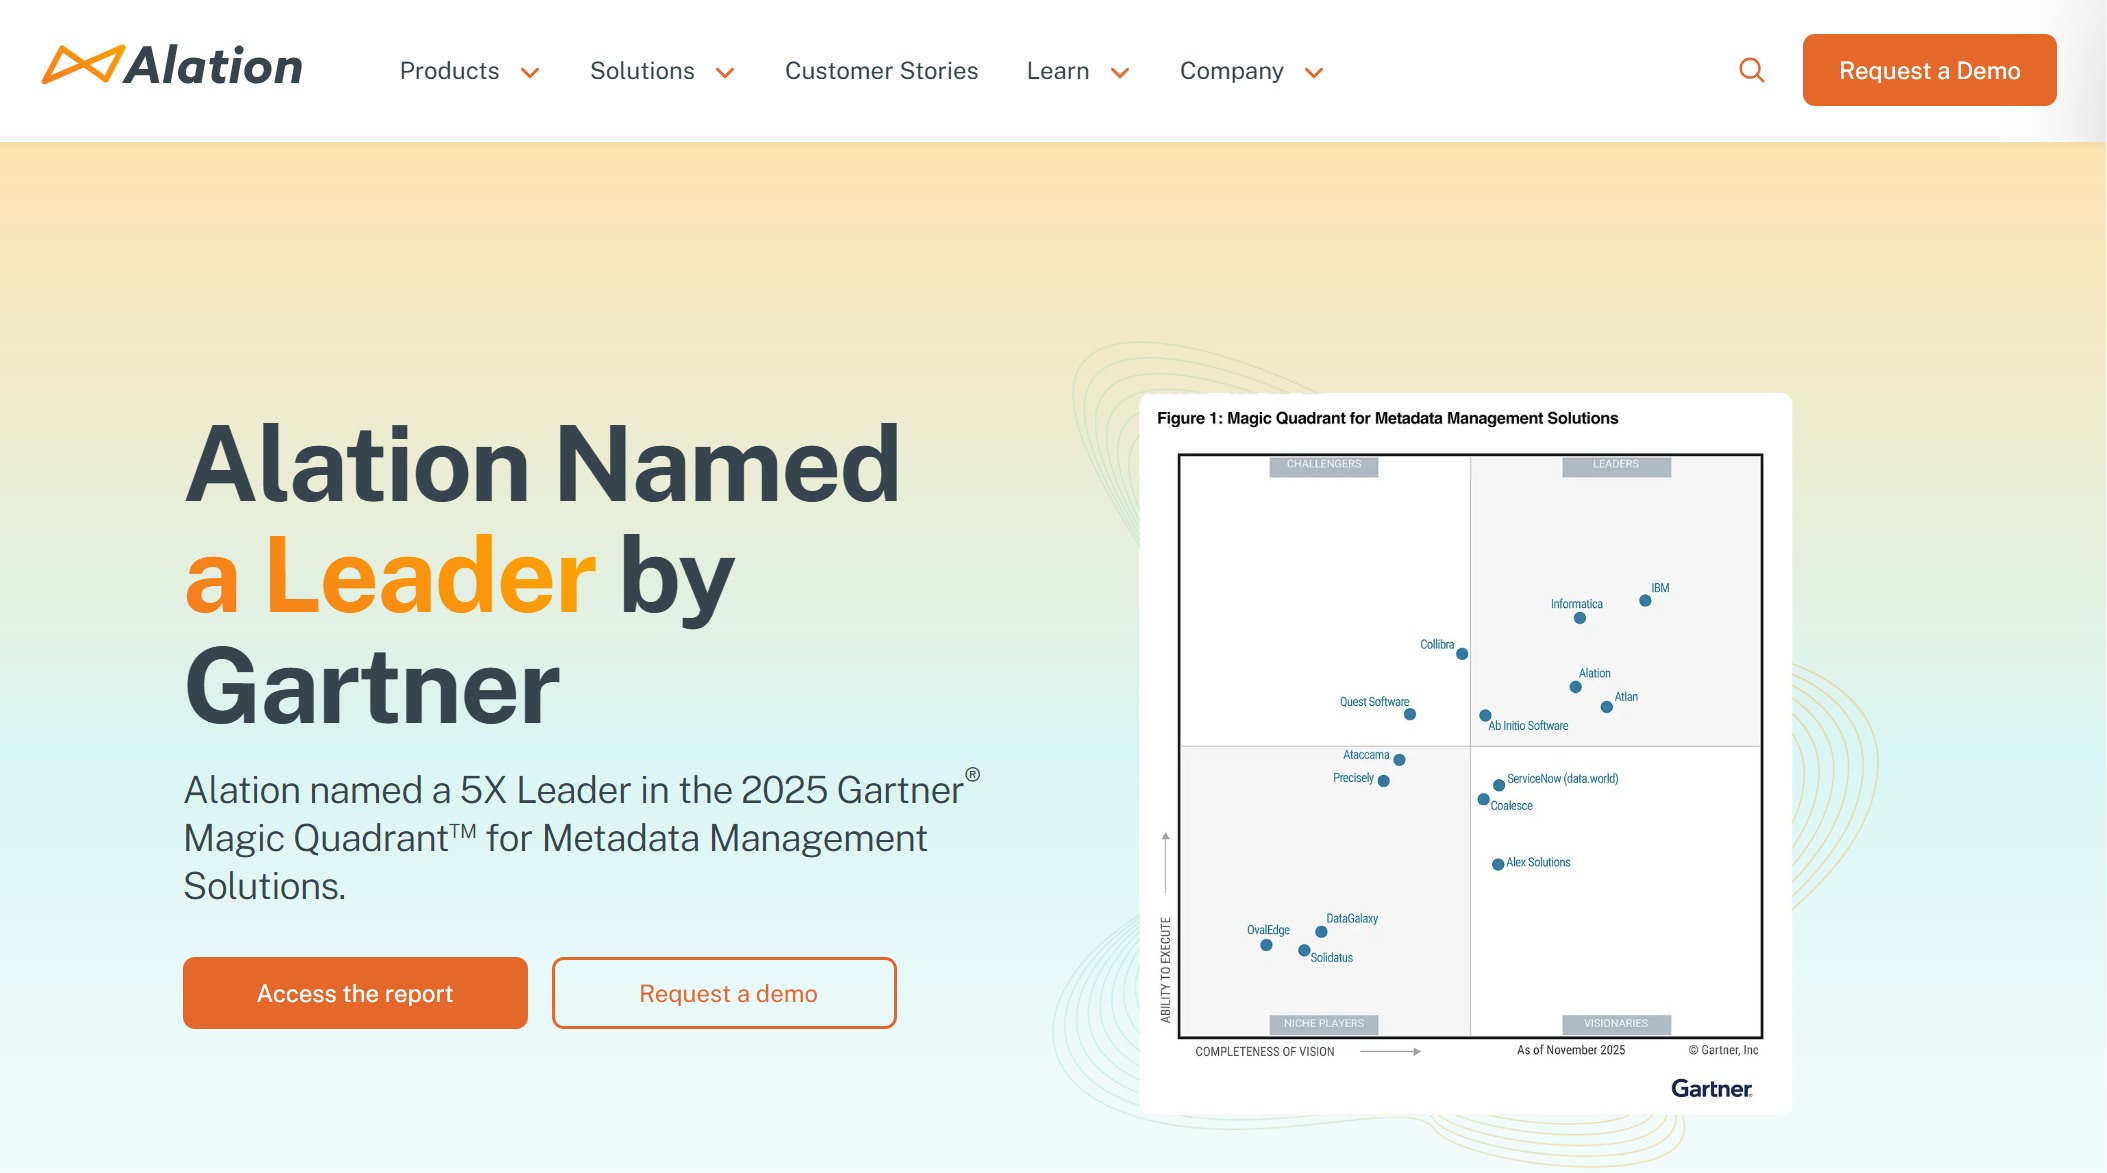
Centralized library for organizing and accessing data across the organization.
Data lineage
Visual mapping of data flow, transformations, and usage, providing context and quality insights.
Data integration with BI tools
Seamless integration with BI tools like Tableau and Power BI for easy data discovery and analysis.
Effortless metadata management
Automatic classification and tagging of data assets, enhancing searchability and reducing manual effort.
Data stewardship
Management of data accuracy and compliance through assigned stewardship roles and dashboards.
Alation makes it simple to manage metadata and ensure data quality. You can connect it to your favorite BI tools for deeper analysis.
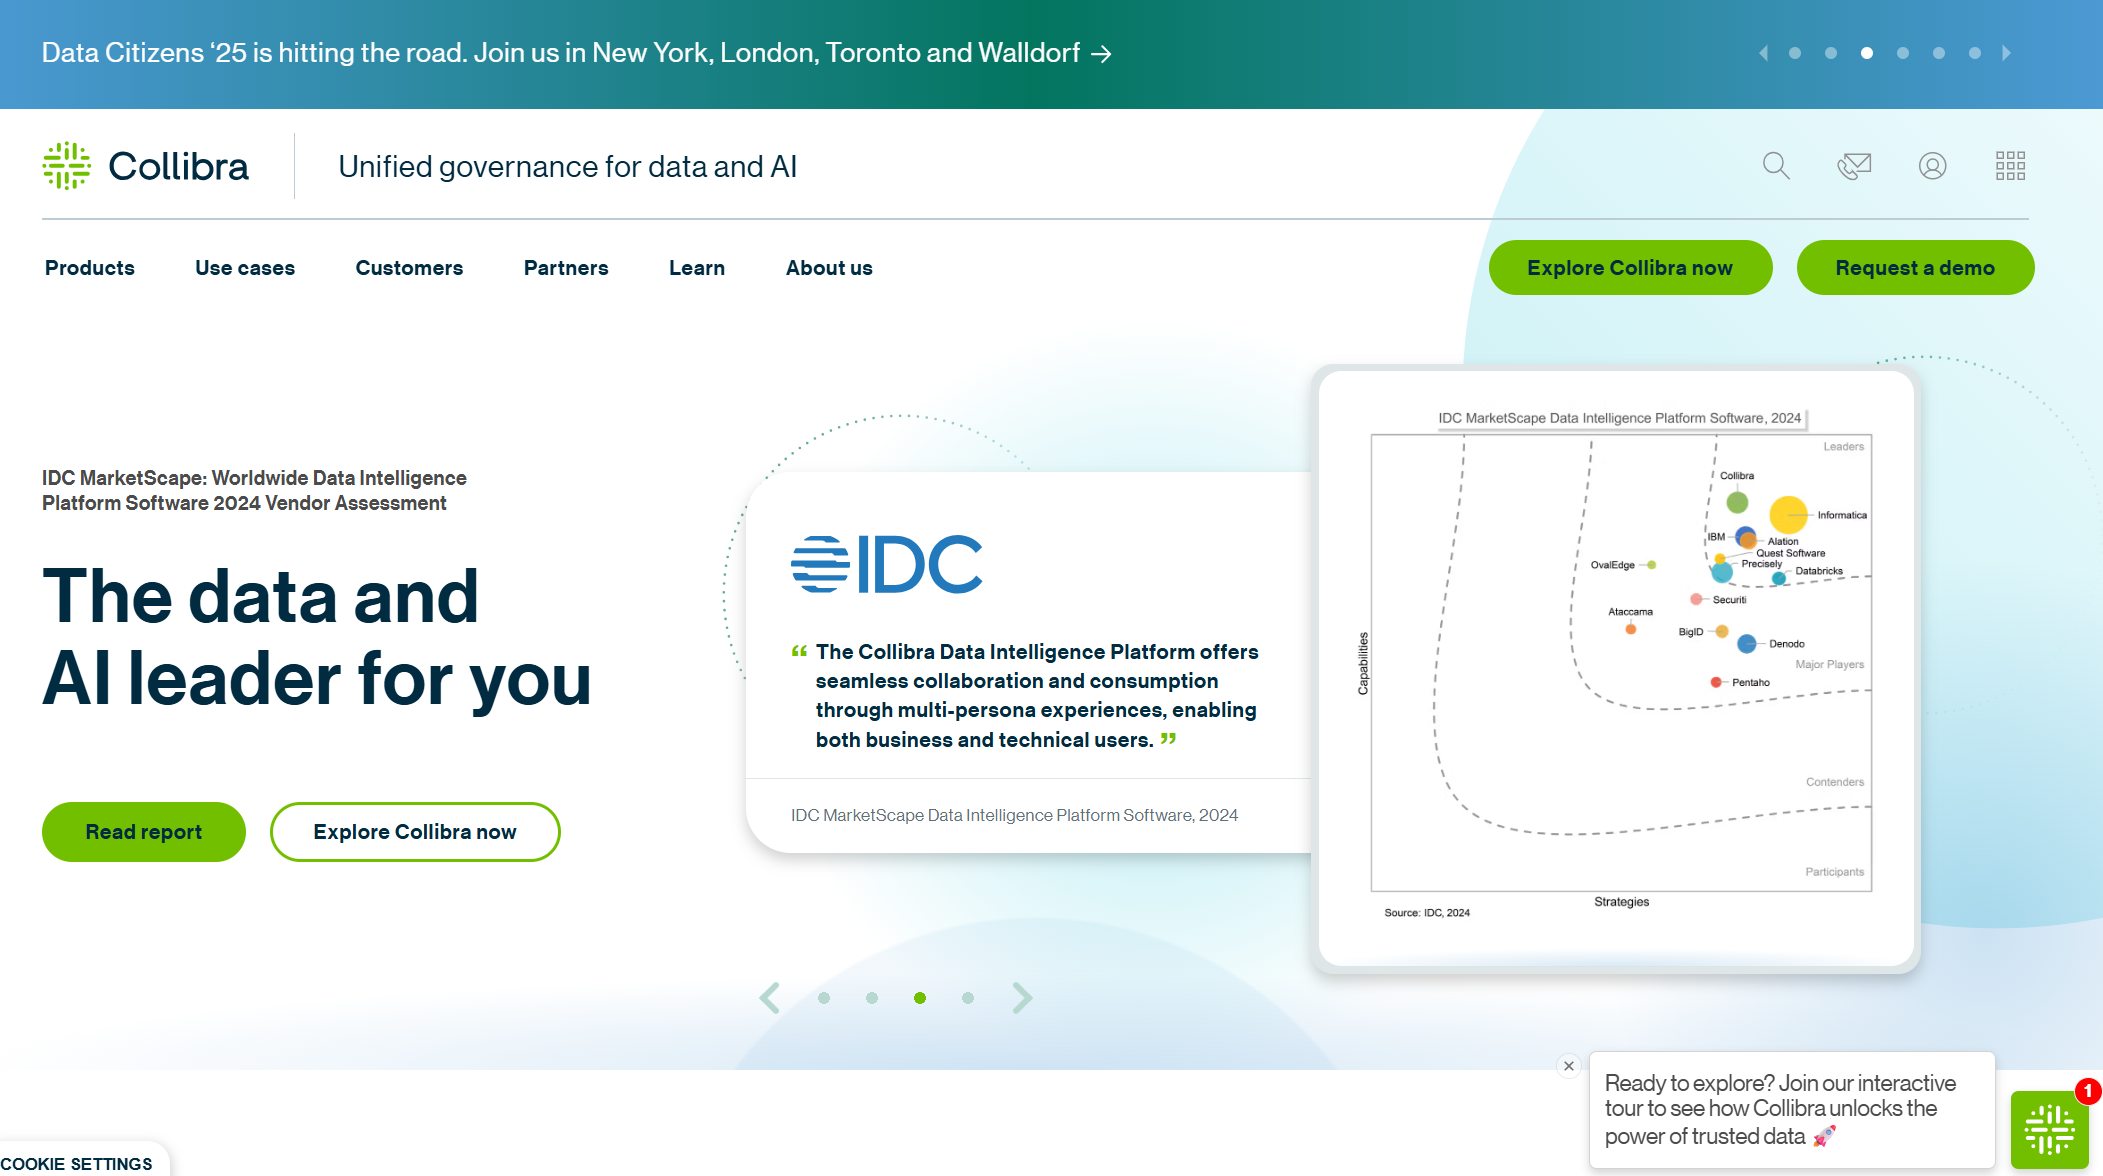
7. Collibra
Collibra focuses on data governance and discovery. You get a data marketplace that connects discovery, access, and governance in one place. Collibra’s centralized data catalog serves as a single source of truth, which boosts productivity and reduces IT overhead.
Seamless integration between data discovery, access, and governance.
Centralized Data Catalog
Serves as a single source of truth, reducing IT overhead and enhancing productivity.
Workflow Designer
Allows for custom workflows to automate and standardize governance processes.
Data Quality Monitoring
Provides real-time insights into data quality, linking issues to specific data assets.
AI Governance Support
Helps document training data for AI models, ensuring compliance with ethical guidelines.
Collibra’s Data Quality and Observability module links quality issues to specific data assets.
You get real-time insights into data quality.
Observability features help you spot anomalies in data pipelines.
Collibra is a smart choice if you want to automate governance and keep your data clean.
8. Atlan
Atlan is built for collaboration. You get active metadata management, which keeps your data catalog up-to-date as workloads run. Atlan tracks data lineage, so you can audit and analyze the journey of your data.
Automatically ingests and updates metadata as data workloads run, keeping the catalog up-to-date.
Data Lineage Tracking
Allows users to trace the origin and journey of data through pipelines for auditing and impact analysis.
Collaboration Tools
Users can add documentation, comments, or Q&A to data asset pages and integrate with platforms like Slack.
Search and Filter Capabilities
Intuitive interface with powerful search and filter options to quickly find relevant data assets.
Custom Categorization
Supports tagging and categorization of assets to align with business terms and taxonomy.
Data Governance Features
Includes a business glossary and policy management for compliance and consistency.
You can add comments, documentation, and even Q&A to data assets. Atlan integrates with Slack, making teamwork easy.
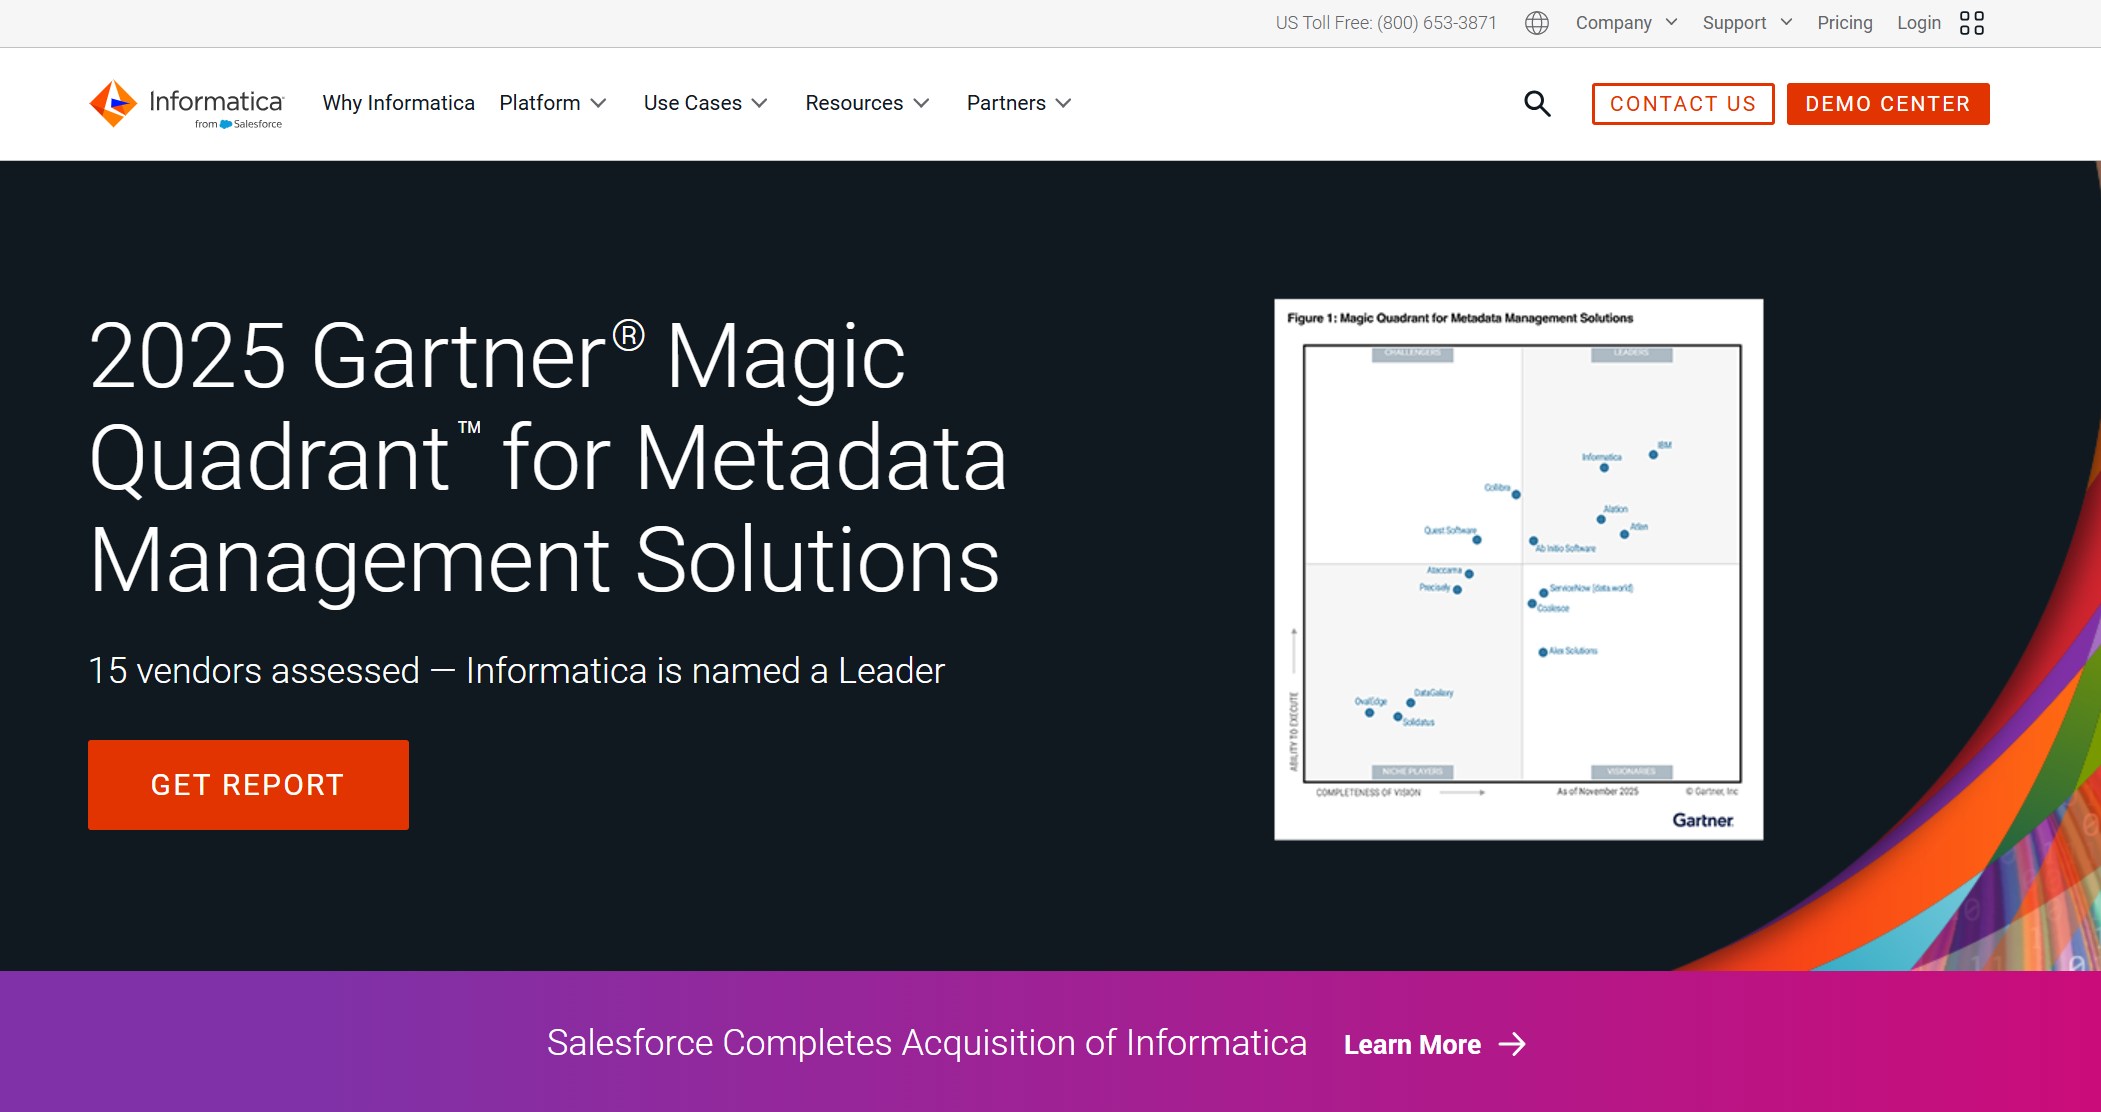
9. Informatica Data Discovery
Informatica Data Discovery is designed for large enterprises. You can find relevant data quickly, understand its context, and identify gaps. The platform helps you make informed choices and improves operational efficiency by reducing search time and automating processes.
Accelerated Projects: Faster access means quicker results.
Informatica helps you protect sensitive data, minimize redundancy, and prioritize what matters most.
10. BigID
BigID puts privacy and compliance front and center. You get automated privacy operations, including data discovery and subject request workflows. BigID tracks and manages consent, making it easier to comply with regulations like GDPR and CPRA.
BigID inventories all personal data across your IT infrastructure.
You can scan for personal identifiable information (PII) and map data to regulatory policies.
The platform automates privacy operations and deletion workflows.
AI-driven insights help you stay compliant and reduce risk.
BigID provides apps to mitigate security and privacy risks for both structured and unstructured data.
If privacy and compliance are top priorities, BigID gives you the tools to manage and protect your data.
Note: Each of these best data discovery tools brings something special to the table. You can choose the right solution by matching your business needs with the strengths of each platform. Whether you want advanced data visualization tools, seamless integration, or strong governance, you’ll find a tool that fits.
Tool Comparison: Data Discovery & Visualization Tools
Feature Comparison Table
You want to see how the top data discovery tools stack up. Here’s a quick table that compares their best uses, standout features, pricing, and ratings. This helps you pick the right tool for your business needs.
Automated data discovery, reporting, and dashboards
Multi-source integration, real-time reporting, mobile BI
Custom
4.8/5
Tableau
Data visualization needs
Interactive dashboards
Starts at $15/mo
4.7/5
Qlik Sense
Data exploration and analytics
Associative data engine
Starts at $30/mo
4.6/5
Power BI
Microsoft ecosystem users
Microsoft integration
Starts at $9.99/mo
4.6/5
Looker
In-database analytics
Embedded analytics
Custom
4.6/5
You’ll notice that each tool brings something special to the table. Tableau shines with real-time data analytics and a drag-and-drop interface. Power BI stands out for its deep Microsoft integration and row-level security. Looker lets you explore data directly in your database and adapts to changing sources.
Unique Advantages of FineReport
FineReport gives you a big edge in the data discovery process. You can connect to hundreds of data sources and blend them into one view. The platform supports automated data discovery, so you don’t waste time searching for information. You get real-time data analytics, which means you always see the latest numbers.
You can use FineReport for data discovery and classification across your business. The drag-and-drop designer makes it easy to build dashboards and reports. You don’t need to code. FineReport’s mobile BI lets you check reports on your phone or tablet, so you stay informed wherever you go.
If you want to speed up your data discovery process, FineReport’s automated data discovery features help you find and classify data fast. You can set up self-service analytics for your team, so everyone can explore data on their own. The platform also supports predictive analytics, helping you spot trends before they happen.
FineReport works well for self-service BI and automated data discovery. You can use it for data discovery and classification, real-time reporting, and predictive analytics. This makes it a top choice for businesses that want to stay ahead.
How to Choose the Best Data Discovery Tool
Assessing Business Needs
You want a data discovery tool that fits your business like a glove. Start by thinking about your goals. What problems do you need to solve? Do you want to improve reporting, boost collaboration, or strengthen data discovery and governance? Make a list of your must-haves before you start shopping.
Scalability and integration capabilities. Make sure the tool can grow with you and handle more data as your business expands.
User-friendliness and training requirements. Choose a tool that everyone can use, from beginners to experts.
Data security and compliance features. Check if the tool keeps your data safe and helps you meet regulations.
If you know what you need, you can narrow down your choices and avoid wasting time.
Scalability and Integration
Your business will change and grow. You need a tool that can keep up. Some platforms offer hundreds or even thousands of connectors, making it easy to link your data from different sources. Others focus on fast data transfer or distributed processing.
Quick and straightforward data transfer to cloud platforms
Informatica
Grid computing; Distributed data processing
Thousands of pre-built connectors for diverse systems
You want a solution that connects to your current systems and can handle more data as you grow. If you plan to expand, pick a tool that won’t slow you down.
Ease of Use and Cost
Nobody likes a tool that’s hard to learn. If your team spends weeks in training, you lose time and money. Easy-to-use platforms help you get started fast and keep support costs low. Pricing can vary a lot, so check what fits your budget.
Ease of use can lower your total cost of ownership. If your team can use the tool without much help, you save on training and support. Look for clear interfaces and helpful guides.
Tip: Try a demo or free trial before you commit. You’ll see if the tool matches your workflow and budget.
Real-World Success: FanRuan Customer Story
BOE Technology Group Case Study
Let’s look at how BOE Technology Group changed the way it works with data. You might know BOE as a leader in the IoT and semiconductor display industry. They faced big challenges. Data sat in different places. Teams used different definitions for the same metrics. Many employees relied on paper reports or spreadsheets. This made it tough to get a clear view of the business.
BOE decided to use FineReport and FineBI to solve these problems. They built a data warehouse to bring all their information together. Over 200 model designs helped automate data integration. Teams created a unified system for metrics. Now, everyone uses the same definitions. BOE set up KPI dashboards and cross-factory benchmarking. You can see how these changes made it easier to track performance and spot risks early.
Impact of FineReport and FineBI
You want to know what happened next. BOE saw a 5% drop in inventory costs. Operational efficiency jumped by 50%. Managers started using dashboards to monitor business in real time. They could compare performance across factories and take action faster.
FineReport made report creation simple. You get an intuitive drag-and-drop interface. You can connect to databases and Excel sheets. This means you handle data from many sources without extra effort. Interactive dashboards let you monitor key metrics and make smart decisions. FineReport works for both technical and non-technical users. You can build systems for attendance or quality management.
Here’s a quick table showing the practical benefits:
You create complex reports with a simple drag-and-drop interface.
Versatility in Data Handling
You connect to databases and Excel for complete reporting.
Interactive Dashboards
You monitor data in real time to support decision-making.
You also get faster data analysis compared to old tools like Excel. Built-in funnel models help you with data funnel analysis. With FineReport and FineBI, you unlock better data exploration and analysis. You see the big picture and the details, helping your business grow.
Choosing the right data discovery tool can change how you run your business. You get tools that fit different needs, with FineReport by FanRuan standing out for flexibility and powerful features. Check out the table below to see what matters most:
Try a pilot project to see how the tool works for you.
Review the pricing to make sure it fits your budget.
Check how well the tool connects with your current systems.
You can use the comparison guide to help you decide. Talk with your team and test a few options. The right tool will help you unlock new insights and grow your business.
Access a wealth of case studies, industry insights, and solution guides to accelerate digital transformation.
FAQ
What is a data discovery tool?
A data discovery tool helps you find, organize, and understand your business data. You can spot trends, outliers, and patterns quickly. These tools make it easier to make smart decisions.
How do I choose the right data discovery tool?
Start by listing your business needs. Look for tools that connect to your data sources, offer easy dashboards, and fit your budget. Try a demo before you decide.
Can I use FineReport on my phone or tablet?
Yes! You can access FineReport dashboards and reports on your mobile devices. Stay informed and make decisions wherever you are.
Do I need coding skills to use FineReport?
No coding needed. FineReport uses a drag-and-drop designer. You can build reports and dashboards without writing code.
What industries use data discovery tools?
You’ll find these tools in retail, finance, healthcare, manufacturing, and more. Any business that wants to use data for better decisions can benefit.