You can now explore data and make decisions faster with self-service analytics. This approach puts analysis in your hands instead of waiting for IT support.
Analytics adoption rates have reached about 20% in organizations.
90% of business users rely on self-service analytics for rapid choices.
The shift to user-driven tools means you experience decision-making that is 60% faster.
Metric
Improvement Factor
Customer Acquisition Rates
23x
Decision-Making Speed
60% faster
Platforms like FineBI give you the power to analyze data, even without technical skills.
What Is Self-Service Analytics?
Definition and Core Concepts
Self-service analytics gives you the ability to explore and analyze data without relying on IT experts. You can create your own reports, dashboards, and visualizations using easy-to-use tools. This approach helps you answer business questions quickly and make decisions based on facts.
You will find several core concepts at the heart of self-service analytics:
Data accessibility lets you reach the information you need, when you need it.
A single source of truth ensures everyone uses consistent data definitions.
Empowerment means you can make data-driven decisions on your own.
Advanced analytics, such as predictive analysis, help you look ahead and understand trends.
Visibility into business process performance allows you to monitor and improve outcomes.
Tip: Self-service analytics platforms often include features like drag-and-drop dashboards, real-time filtering, and interactive charts. These tools make it easy for you to explore data and discover insights.
You can see the essential components of self-service analytics in the table below:
Component
Description
Data Modeling
Tools and techniques necessary for transforming data for analysis.
Data Presentation and Analysis
Focuses on tools and techniques for presenting and visualizing data.
Users
Specifies the user groups in a self-service business intelligence environment.
Data Governance
Guidelines governing aspects like data quality and protection.
Architectural Elements
Components that support self-service business intelligence from a technical or organizational perspective.
Many companies now create environments where you can generate reports and analytics independently. This shift enhances usability and gives you a personalized decision-making experience.
Self-Service vs. Traditional Analytics
You may wonder how self-service analytics compares to traditional analytics. The main difference is who controls the process and how quickly you get results.
Traditional analytics relies on IT professionals and data analysts. You must wait for them to build reports and dashboards. This process takes time and often requires advanced technical knowledge. Customization is limited, and you may not get the exact insights you need.
Self-service analytics changes the game. You, as a business user, can access data and create reports without technical skills. The platforms are user-friendly and designed for non-technical users. You get faster results and can tailor dashboards to your needs.
Here is a comparison table to help you understand the differences:
Point of Difference
Traditional BI
Self Service BI
User Type
Designed for IT professionals and data analysts.
Accessible to non-technical users, like business teams.
Speed
Time-consuming due to reliance on IT for reports.
Faster, enabling independent report creation.
Complexity
Requires advanced technical knowledge.
User-friendly with intuitive interfaces.
Customization
Limited customization options.
High customization; users can tailor dashboards easily.
Examples
Legacy systems like SAP Business Objects.
Tools like Tableau and Power BI.
You will notice that self-service analytics platforms give you more flexibility. You can create your own reports and dashboards. Modern tools use technology to make data accessible across departments. You can perform sophisticated analysis and generate insights on your own.
Note: Self-service analytics platforms help you monitor business processes and outcomes. You can improve performance by acting on insights quickly.
Self-service analytics puts you in control. You no longer need to wait for IT. You can explore data, customize your analysis, and make decisions faster.
Why Self-Service Analytics Matters
Business Impact and Agility
You want your organization to move quickly and make smart choices. Self-service analytics helps you achieve this goal. When you have instant access to data, you respond faster to new opportunities or threats. You do not need to wait for IT teams to build reports. This leads to faster decision-making and increased productivity.
Here are some ways self-service analytics improves your business:
You make decisions quickly because you see the data right away.
Technical teams focus on important projects instead of basic reporting tasks.
Departments understand their own data and performance better.
You save money by reducing the need for specialized analysts.
Your company gains a competitive advantage by reacting to market trends faster.
A recent study shows how self-service analytics boosts agility:
Benefit
Description
Faster Decision-Making
You shorten the time between collecting data and acting on insights.
Empowerment of Users
You analyze data independently, without relying on experts.
Rapid Response to Changes
Your organization adapts quickly to new market conditions.
Self-service analytics reduces bottlenecks in data analysis. You and your team can access information when you need it. This democratizes data across your organization and helps you respond swiftly to operational challenges.
Empowering Users and Teams
You do not need to be a data specialist to use self-service analytics. These platforms let you explore and visualize data on your own. You make data-driven decisions without waiting for help. By 2026, most organizations will rely on self-service analytics so non-technical users can analyze data independently.
Data democratization means everyone in your company can interact with information. You use user-friendly interfaces to find answers and share insights. This approach supports business intelligence and encourages collaboration.
FineBI makes this possible for many industries and departments. You get a simple interface that lets you analyze data without IT support. This shift empowers you and your team to make decisions quickly and efficiently. FineBI helps move your organization toward a future where self-service analytics is the standard, not the exception.
Self-service analytics platforms help you unlock the power of your data. You can move through several stages to turn raw information into actionable insights. FineBI, for example, guides you through a clear workflow that covers data integration and preparation, visual exploration and dashboard creation, and secure publishing with governance.
Data Integration and Preparation
You start by connecting to your data sources. FineBI supports over 30 database types, including SQL datasets, Excel files, multidimensional databases, and program datasets. You can bring together information from different systems without needing advanced technical skills.
FineBI provides an SQL writing interface for data retrieval, allowing for data processing.
Excel datasets
You can upload Excel datasets, which are commonly used in business environments.
Multidimensional databases
FineBI supports connections to multidimensional databases through the FineReport designer.
Program datasets
Additional support for program datasets is available via the FineReport designer.
Over 30 database types
FineBI can connect to more than 30 different types of databases for seamless integration.
You do not need to wait for IT to access your data. Self-service analytics platforms let you handle data preparation and integration on your own. You can clean, transform, and organize your data using automated tools. This process helps you create analysis-ready datasets quickly.
Feature
Self-Service Analytics Platforms
Traditional BI Tools
User Empowerment
Designed for business users to access data independently
You can generate actionable insights quickly. You reduce bottlenecks in data access and analysis. You explore and visualize data with little or no coding. This approach makes data preparation and integration much easier for everyone.
Tip: When you use FineBI, you can preview your data at every step. This ensures your data preparation and integration meet your needs before you move on to analysis.
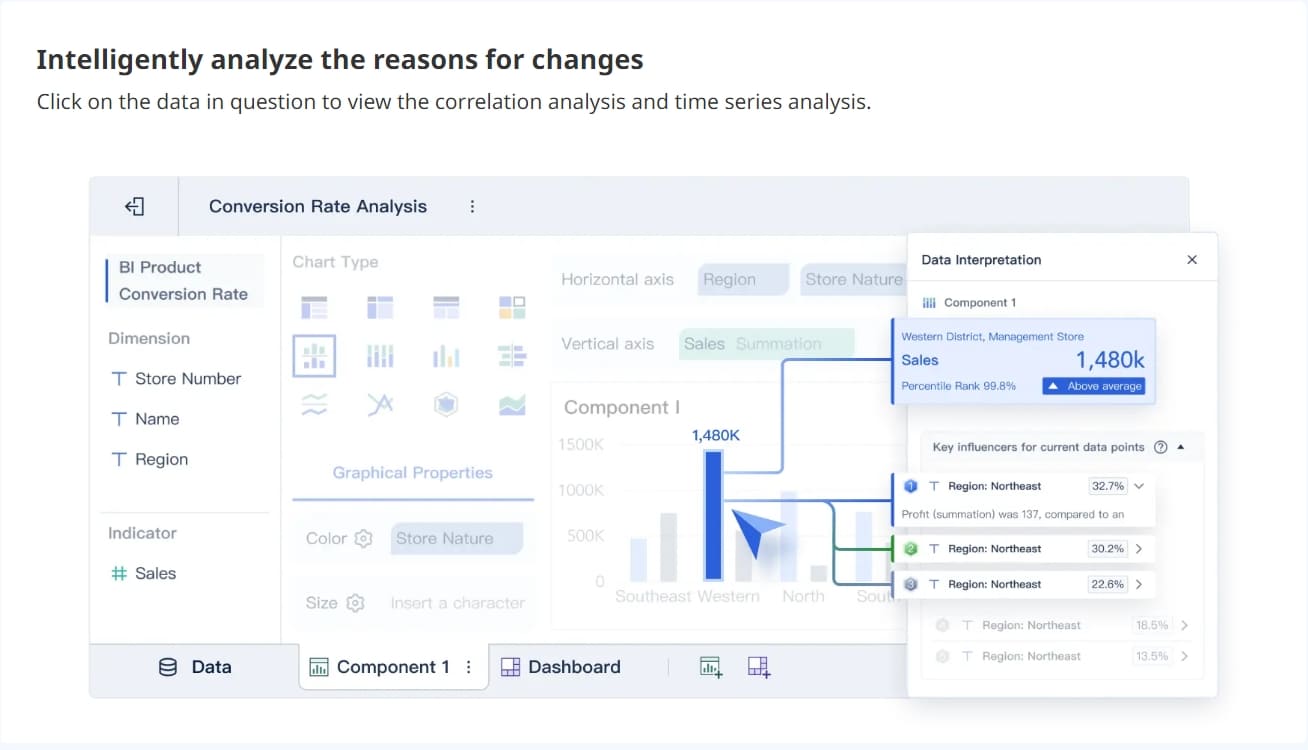
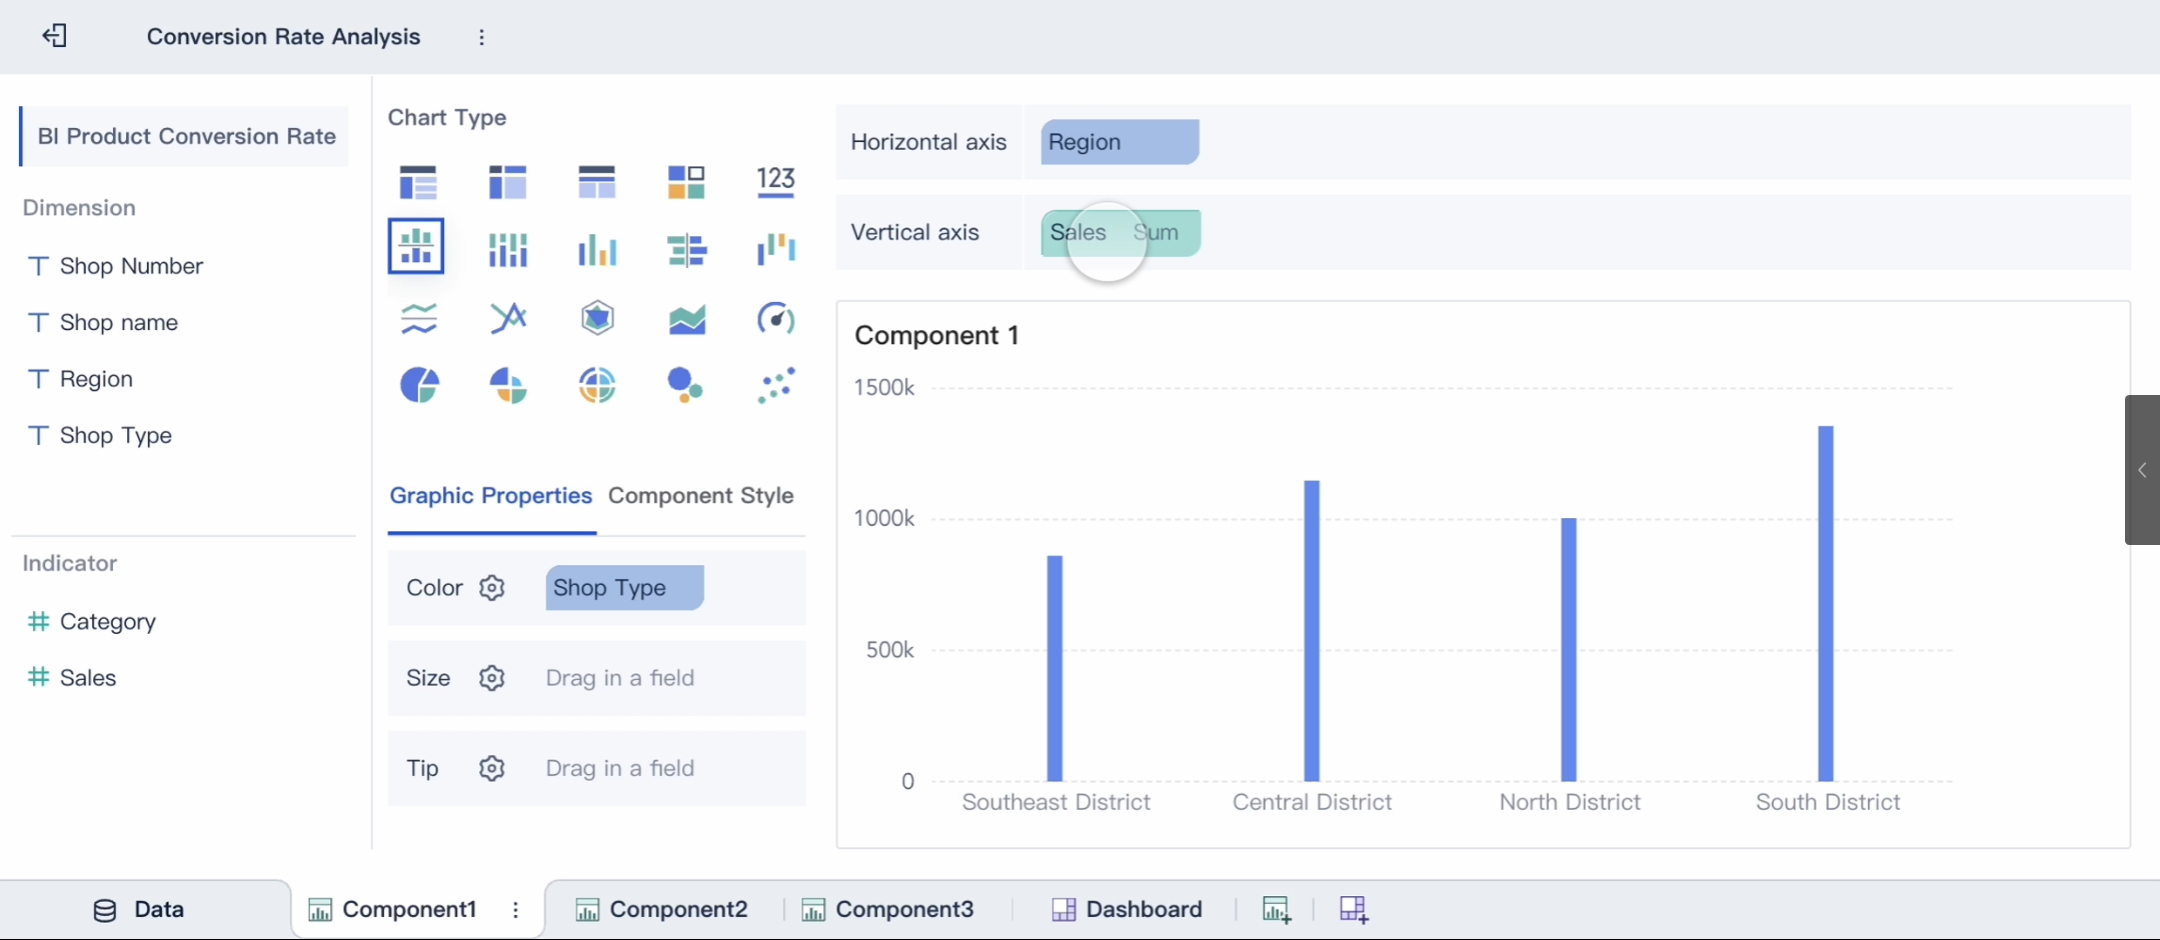
Visual Exploration and Dashboard Creation
Once your data is ready, you can start exploring it visually. FineBI and other self service analytics platforms offer drag-and-drop interfaces. You build interactive dashboards by selecting charts, tables, and other components. You do not need to write code or rely on technical experts.
You can use visualization tools to create dashboards that show key metrics and trends. You can apply filters, drill down into details, and customize layouts. Interactive dashboards help you see patterns and make decisions faster.
Platform
Key Features
Microsoft Power BI
Familiar interface, tight integration with Microsoft products, strong semantic modeling, extensive connectors
Tableau
Intuitive drag-and-drop interface, powerful visualization engine, strong community support
FineBI stands out by letting you create interactive dashboards that update in real time. You can share these dashboards with your team, helping everyone stay informed and aligned. You can also use visualization tools to highlight important data points and trends.
Note: Interactive dashboards make it easy for you to monitor business performance and respond to changes quickly.
Publishing and Governance
After you build your dashboards, you need to share them securely. Self-service analytics platforms like FineBI provide built-in governance features. You control who can view, edit, or share your analytics content.
Role-based permissions limit access to sensitive information.
Encryption protects your data during transfer and storage.
Audit logs track user behavior to support compliance and governance.
Publishing workflows allow stakeholders to verify data and reports before sharing.
You can trust the analytics you publish. FineBI enforces policies for data quality and usage. You can log data access and ensure compliance with regulations. This process helps you maintain control over your data while empowering users to make informed decisions.
Tip: When you use FineBI, you can set up alerts and notifications for critical metrics. This keeps your team aware of important changes and supports proactive decision-making.
You move through each stage—data preparation and integration, visual exploration, and secure publishing—using self-service analytics. You gain the ability to analyze, share, and act on data without barriers. FineBI makes this process simple and effective for everyone in your organization.
Key Features of Self Service Analytics Strategy
Intuitive Interfaces and Usability
You need user-friendly tools to make data analysis simple and accessible. The best self service analytics tools focus on easy navigation and clear design. When you use a platform like FineBI, you can build dashboards and reports without any coding. Zero-code features let you explore data, create visualizations, and answer business questions on your own. This approach helps you work faster and encourages more people in your company to use analytics.
A simple and engaging interface increases adoption rates. You feel more confident when you can find what you need quickly. User-friendly tools also help you personalize dashboards and reports for your specific needs. Here is a table showing important features for usability:
Feature
Description
User Accessibility
Centralized data and intuitive tools for quick access.
User-Friendly Interface
Visually appealing and easy to use, even for beginners.
Personalization
Lets you customize reports for different use cases.
You can see how user-friendly tools empower everyone, not just analysts, to make better decisions.
Data Security and Governance
You want to trust the data you use. Strong data security and governance features protect your information and ensure compliance with regulations. FineBI uses role-based access control, so only authorized users can view or edit sensitive data. The platform also tracks user activity with audit logs and maintains high data quality through validation and cleaning.
Here is a table that outlines key controls:
Control Type
Description
Access Control
Limits data access with authentication and permissions.
Data Quality Control
Validates and cleans data for accuracy.
Auditing and Logging
Tracks who accesses or changes data for accountability.
User-friendly tools make it easy for you to manage permissions and monitor data usage. You can focus on analysis, knowing your data is safe.
Collaboration and Real-Time Insights
You achieve more when you work together. Collaboration and sharing features in FineBI let you and your team edit dashboards at the same time. You can share reports with a single click and manage permissions for each user. These user-friendly tools support real-time updates, so everyone sees the latest data.
You can collaborate on folders and analysis subjects, making teamwork smooth and efficient. Real-time insights help you respond quickly to changes and spot trends as they happen. FineBI’s customer stories show how companies like Macao Water improved decision-making by using user-friendly tools for collaboration and sharing.
User-friendly tools also support predictive analytics, helping you look ahead and plan for the future. When you combine easy-to-use features with strong collaboration, your organization becomes more agile and data-driven.
Benefits, Challenges, and Best Practices
Major Benefits for Organizations
You gain many advantages when you adopt a self service analytics strategy. You improve data accessibility for everyone in your organization. You empower teams to find answers without waiting for IT. This approach leads to faster decision-making and higher productivity. Here are some key benefits:
You provide 24/7 support at scale, so users always have information.
You reduce support ticket volume because users solve common questions themselves.
You speed up onboarding and adoption with easy guides and templates.
You empower users and teams, streamlining workflows and boosting productivity.
You unlock data-driven insights that help you improve products and services.
A strong self service analytics strategy ensures data accessibility, which means everyone can participate in data-driven decisions. You see innovation rise as more people explore data and share ideas.
Common Challenges and Solutions
You may face challenges when you start your self service analytics strategy. Maintaining data quality and governance is crucial. Some users may resist new tools. Different levels of data literacy can slow adoption.
One common issue is data inconsistency. When teams use different reports or definitions, trust in analytics drops. You may see conflicting numbers in meetings, which creates confusion.
To overcome these challenges, you can:
Build a strong data governance framework for quality and consistency.
Invest in data literacy so everyone understands how to use data.
Encourage collaboration between business and data teams.
Focus on actionable insights, not just perfect data.
Best Practices for Implementation
You can follow best practices to make your self service analytics strategy successful. The table below shows important steps:
Best Practice
Description
User Enablement
Offer training, templates, and guides to boost user confidence and adoption.
Set roles and policies to keep data quality high and definitions consistent.
Structured Rollout
Start with business-critical KPIs and align analytics with company goals.
You should also communicate quick wins, recognize early adopters, and use feedback loops for improvement. Always test and monitor data quality. Standardize master data and use a central semantic layer for consistent definitions.
Future Trends in Self-Service Analytics
You will see new trends shape your self service analytics strategy. AI-driven dashboards will make data accessibility even easier. Platforms will use natural language, so you can ask questions and get answers in plain English. Automated data preparation and modeling will lower the learning curve. You will notice more personalized support and predictive insights. These changes will help you focus on asking the right questions and acting on insights, not just building reports.
Self-service analytics platforms like FineBI change how you use data. You gain faster insights and make better decisions. These tools empower everyone, not just IT experts.
You access analytics easily, no matter your technical skill.
You reduce delays by creating reports yourself.
AI-driven dashboards help you see trends quickly.
To stay competitive, build a strong foundation and plan for growth.
Phase
Actions
Foundation
Define core metrics, monitor data quality, create a data catalog, set governance rules
Enhanced Self-Service
Use modern BI tools, offer conversational interfaces, automate anomaly detection
Proactive Intelligence
Add AI agents, real-time analytics, and embed insights in daily work
Autonomous Systems
Enable AI to act, optimize, and support advanced analytics
Explore FineBI to unlock your team’s full potential and prepare for the future of analytics.
Access a wealth of case studies, industry insights, and solution guides to accelerate digital transformation.
FAQ
What is self service analytics?
You use self service analytics to explore and analyze data without waiting for IT. This approach lets you create reports and dashboards on your own. You make decisions faster and gain more control over your business insights.
How does FineBI ensure enhanced data accessibility?
FineBI connects to many data sources, including databases and files. You access all your information in one place. This setup gives you enhanced data accessibility and helps you find answers quickly.
Can I use FineBI if I have no coding experience?
Yes, you can. FineBI uses a drag-and-drop interface. You build dashboards and reports without writing code. The platform guides you through each step, making analytics easy for everyone.
How does FineBI keep my data secure?
FineBI uses role-based permissions and audit logs. You control who can view or edit data. The platform tracks user actions and protects sensitive information, so you work with confidence.
What industries benefit most from self service analytics?
You see value in many industries, such as finance, manufacturing, healthcare, and retail. Any organization that wants faster decisions and better teamwork benefits from self service analytics.