Big data analytics tools give you the power to turn raw information into data-driven insights. You can make smarter decisions, streamline your business, and gain an edge over competitors. Nearly 67% of top-performing companies rely on data analytics tools to guide their choices.
Here are 10 best big data analytics tools you should try:
FineBI
Apache Hadoop
Apache Spark
Microsoft Power BI
Tableau
Google BigQuery
Amazon Redshift
IBM Cognos Analytics
Qlik Sense
ThoughtSpot
These big data analytics tools help you optimize operations, personalize customer experiences, and respond to real-time data. As you explore the possibilities, consider how big data analytics can transform your approach and meet your unique needs.
Top Big Data Analytics Tools
When you search for theTop Big Data Analytics Tools, you look for solutions that help you turn large volumes of information into actionable insights. These tools allow you to process, analyze, and visualize data from many sources. The Top Big Data Analytics Tools include platforms that support real-time data, advanced visualizations, and seamless integration with your existing systems.
You need to know what makes the Top Big Data Analytics Tools stand out. These tools must handle massive datasets, offer user-friendly interfaces, and provide features that support your business goals. You should consider the following criteria when choosing the best data analytics tools:
Identify essential features required for your business operations.
Assess the data capacity of the tool to handle potential data influx.
Establish a budget that balances quality and affordability.
Review user feedback from reputable sources and consult peers for recommendations.
Utilize trials and demos to evaluate the tool's capabilities in real-world scenarios.
Below, you will find a detailed overview of the top 10 big data analytics tools. Each tool includes a brief description, key features, and a practical business use case.
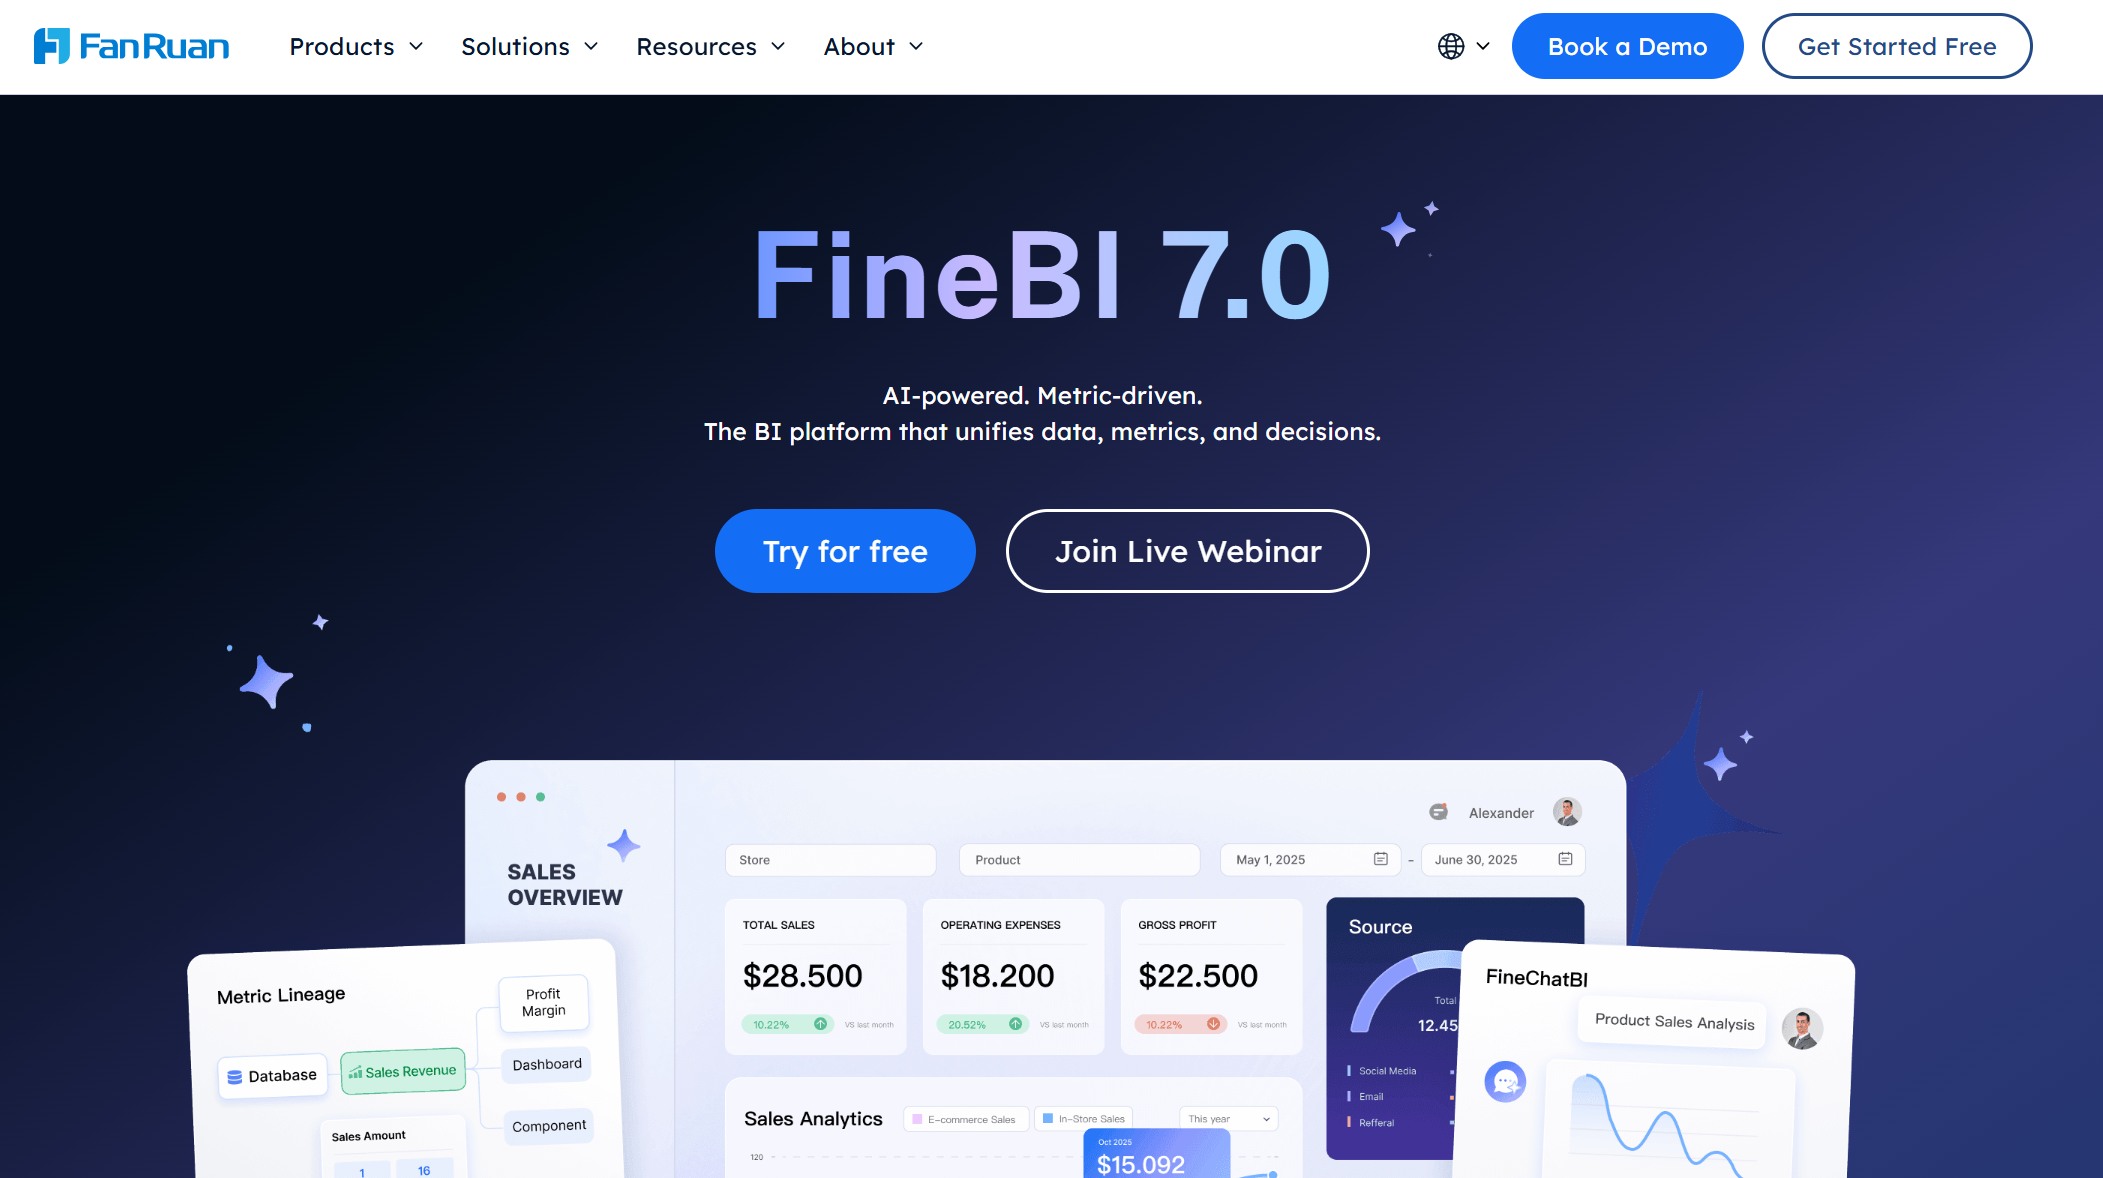
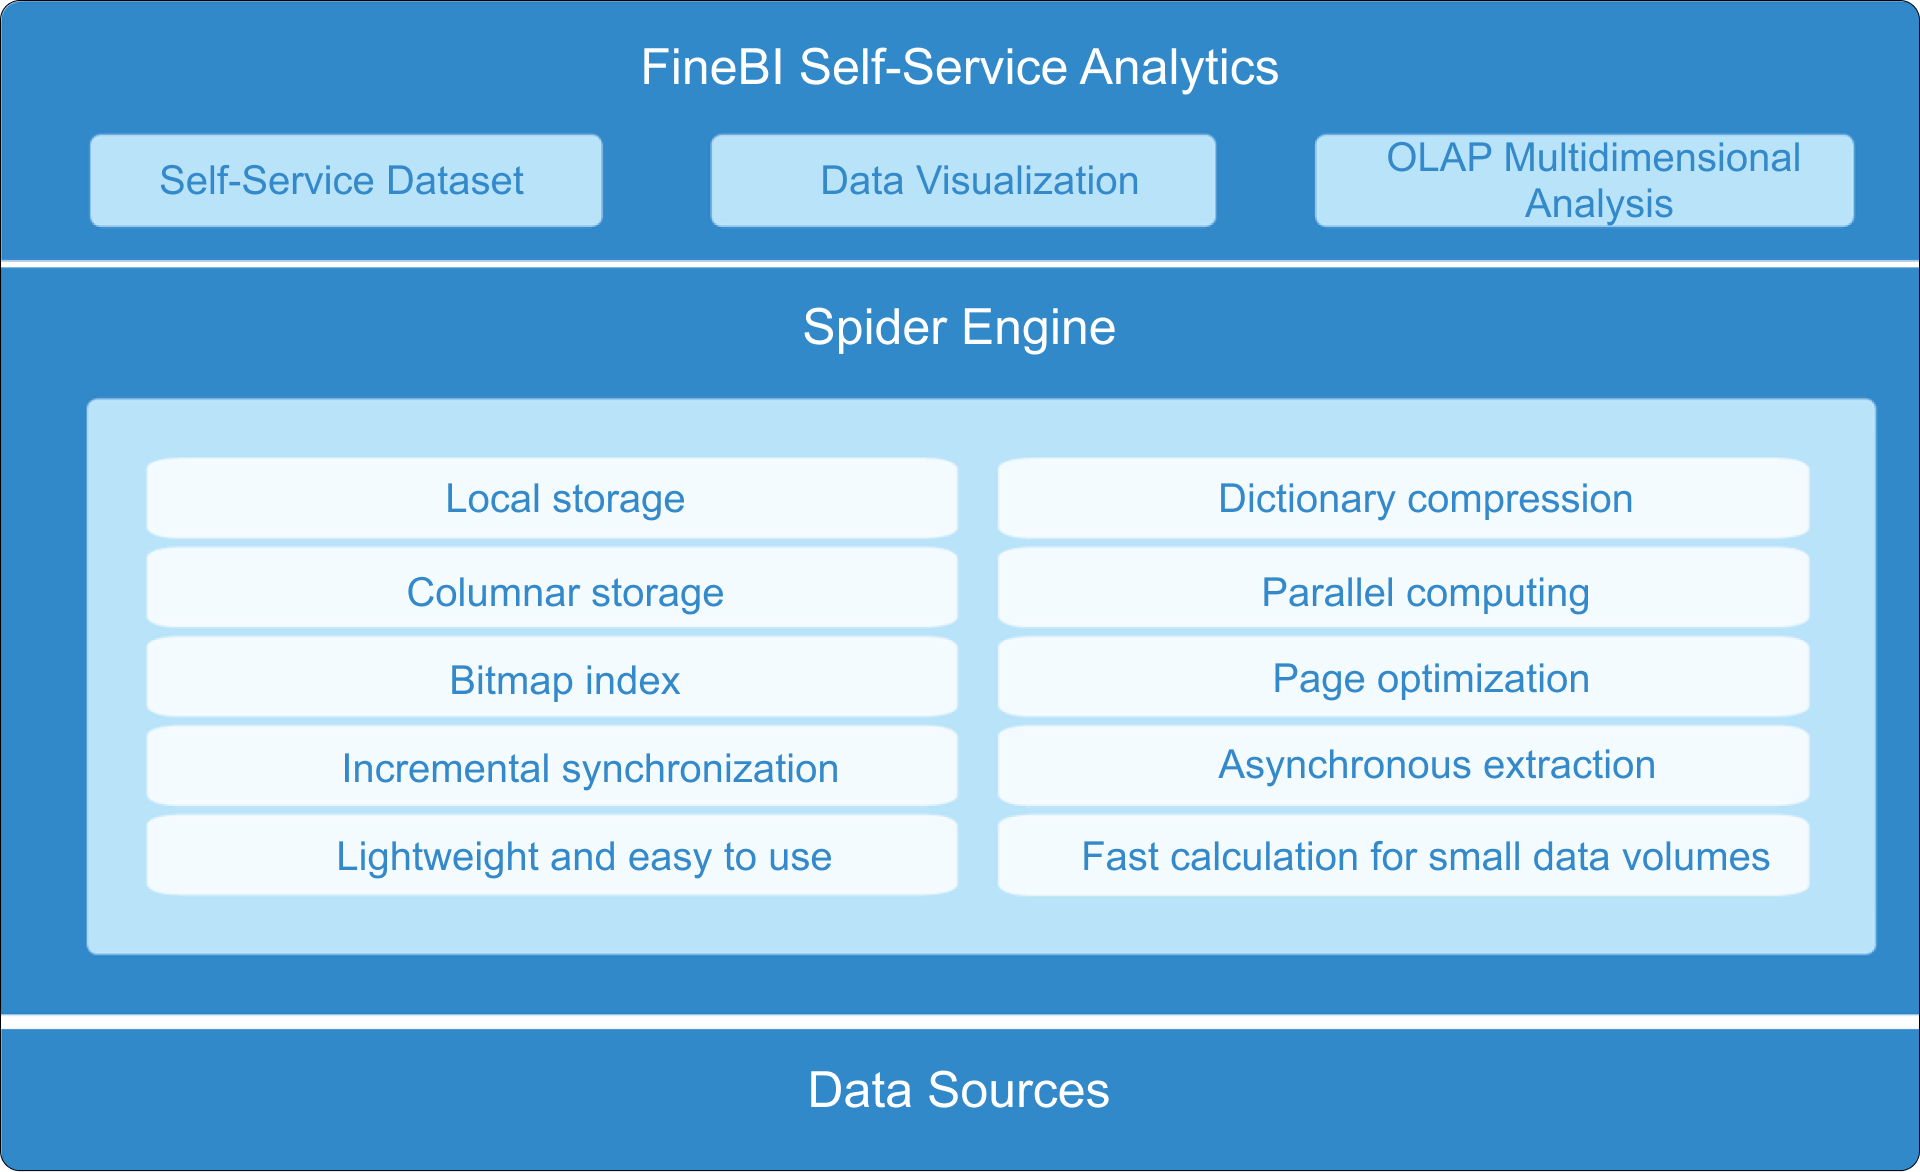
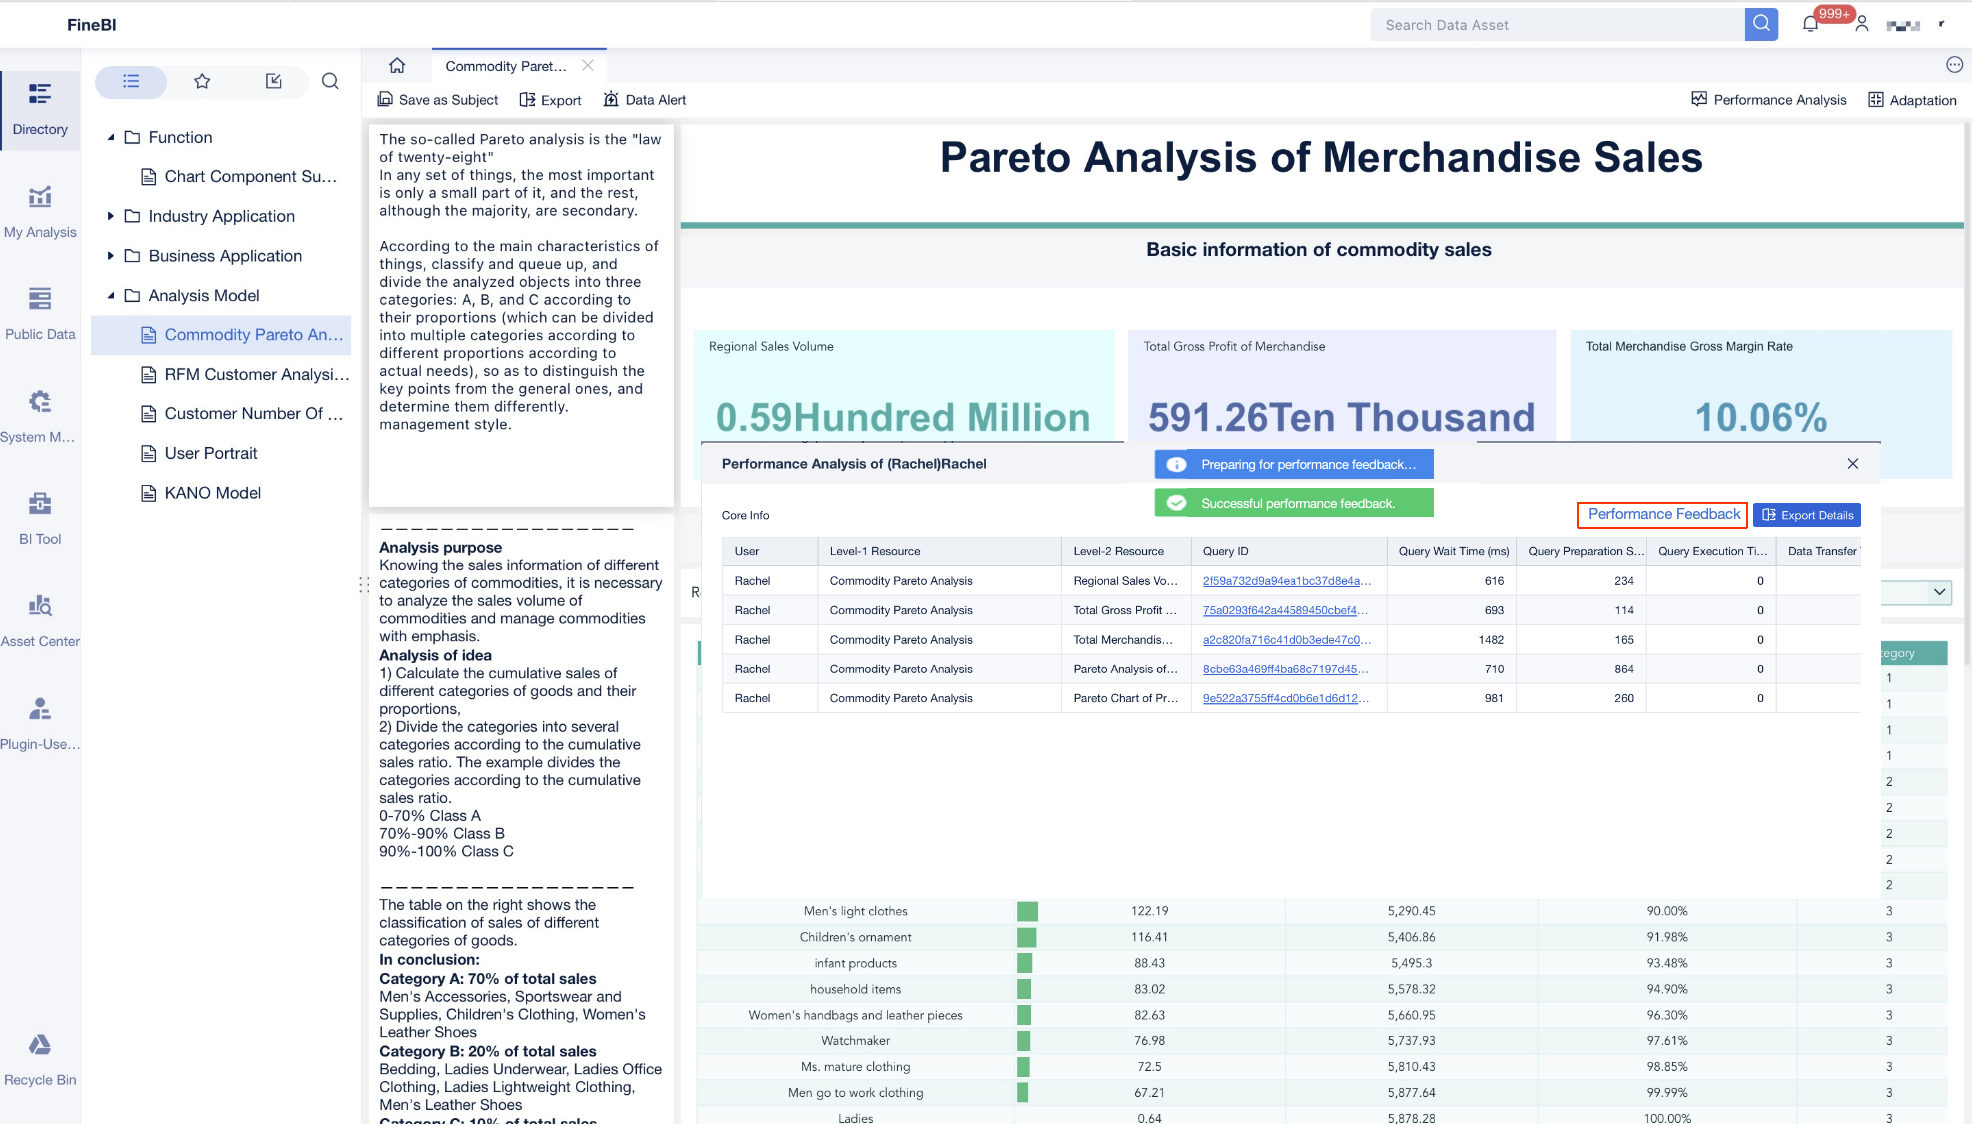
FineBIstands out among big data analytics tools for its self-service analytics, real-time data processing, and advanced visualizations. You can connect FineBI to a wide range of data sources, including big data platforms like Hadoop, Spark, and Snowflake, as well as relational databases.
Enables users to perform exploratory analysis independently without heavy reliance on IT teams.
Real-Time Data Processing
Allows for instant analysis of updated data, facilitating timely decision-making.
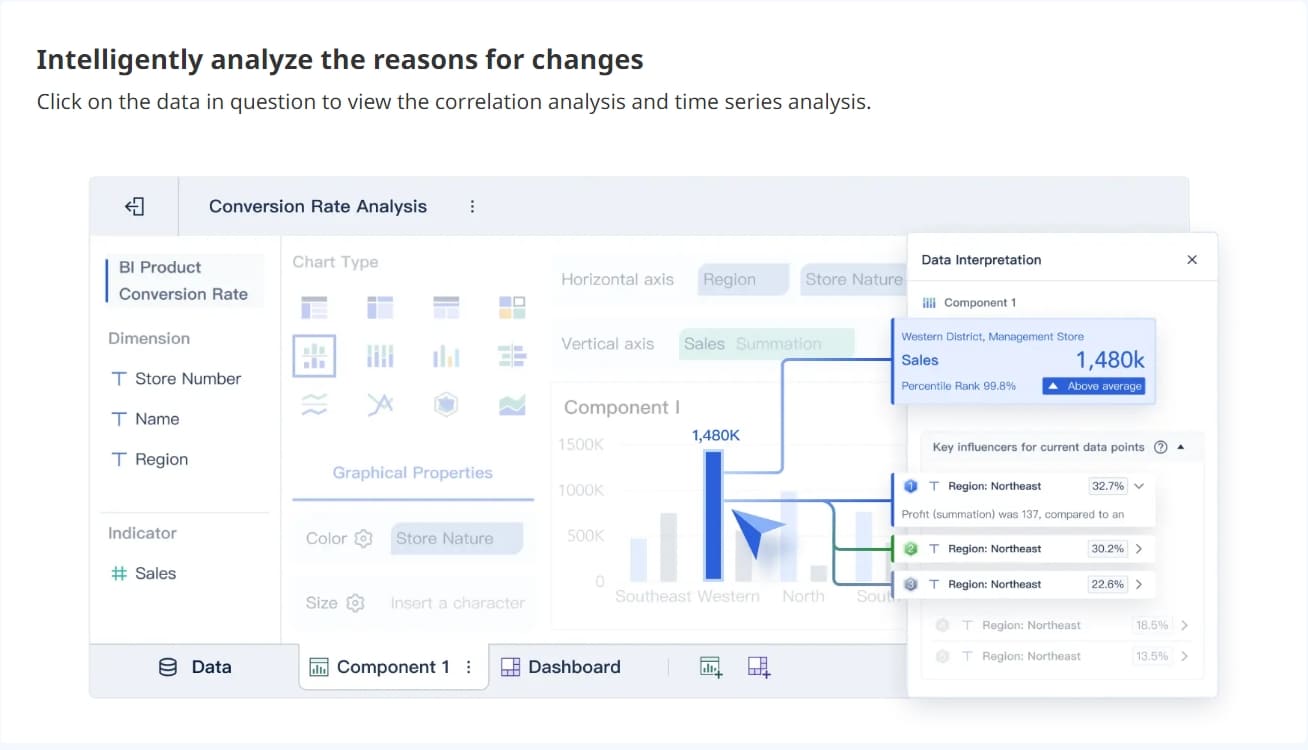
Advanced Visualizations
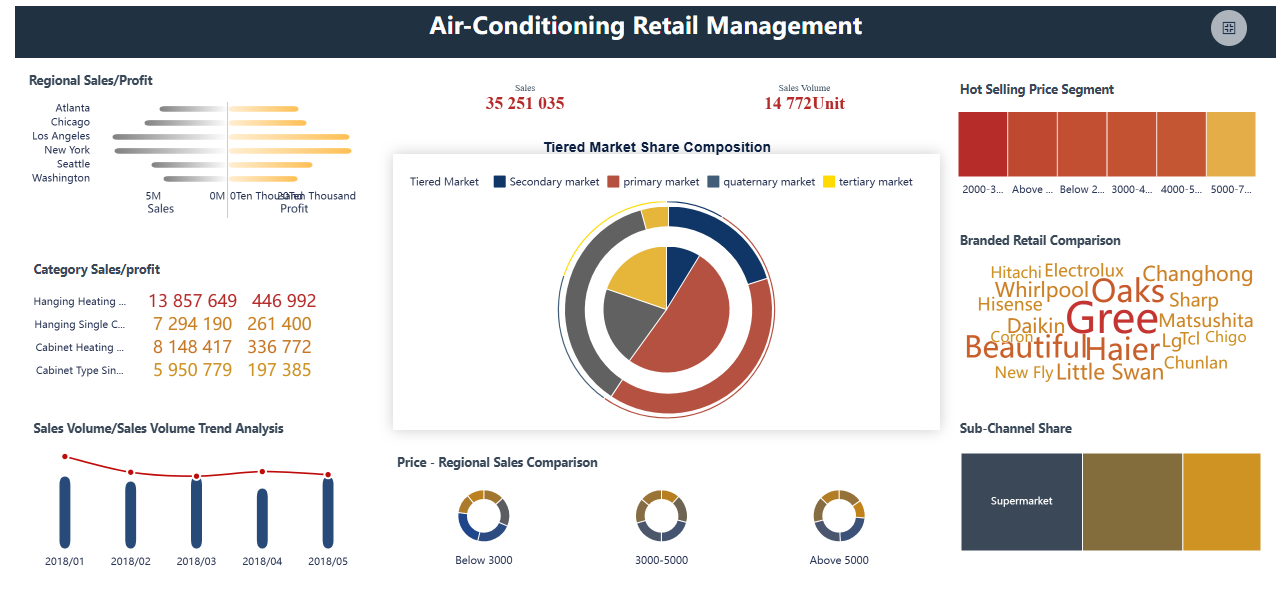
Offers over 60 chart types for creating compelling dashboards and reports.
Data Integration
Connects to various data sources, including big data platforms like Hadoop and relational databases.
Collaboration Tools
Facilitates sharing of dashboards and analysis among team members, enhancing collaboration.
You can use FineBI to build interactive dashboards, track key performance indicators, and share insights across your organization. FineBI’s customer success story with BOE Technology Group shows how the tool helped reduce inventory costs by 5% and increased operational efficiency by 50%. BOE used FineBI to integrate data from multiple sources, standardize metrics, and enable data-driven decision-making. This example demonstrates how FineBIsupports digital transformation and business growth.
Tip: FineBI’s real-time analytics and self-service features make it a strong choice for organizations that want to empower business users and improve collaboration.
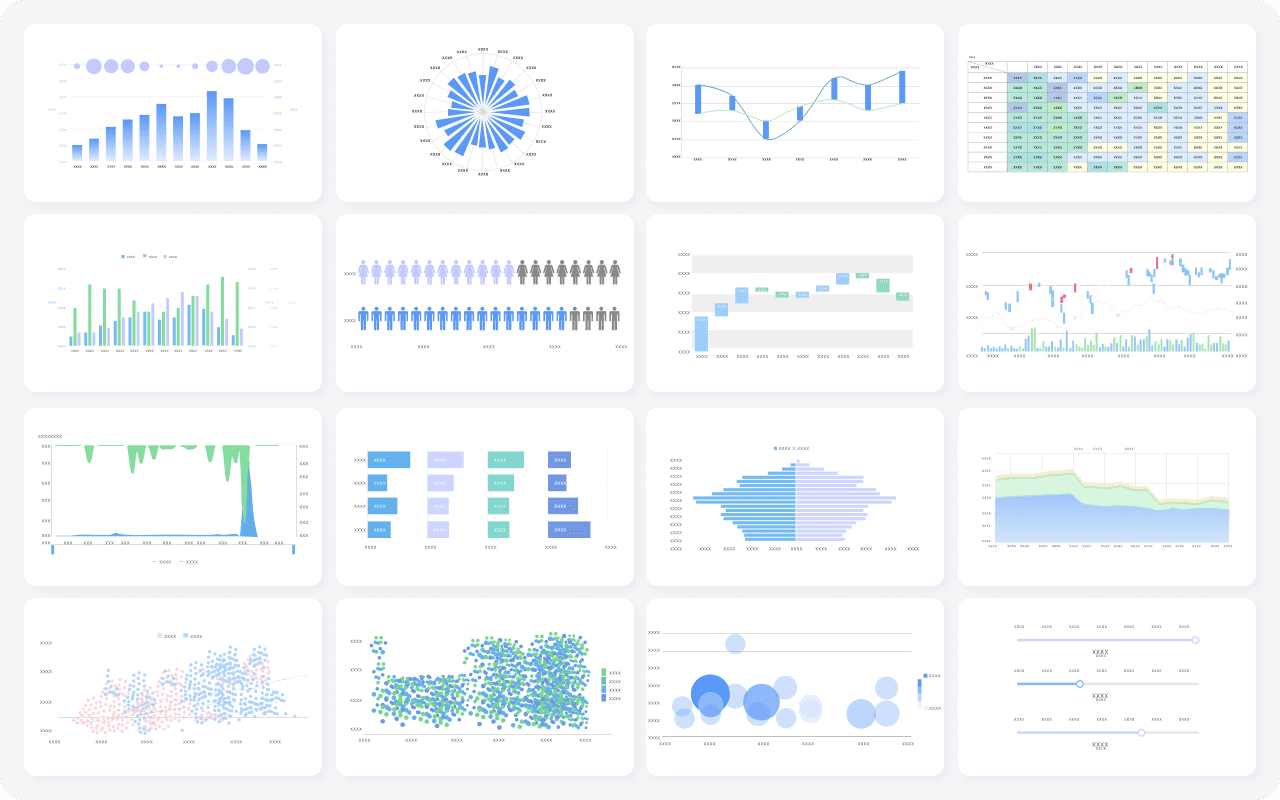
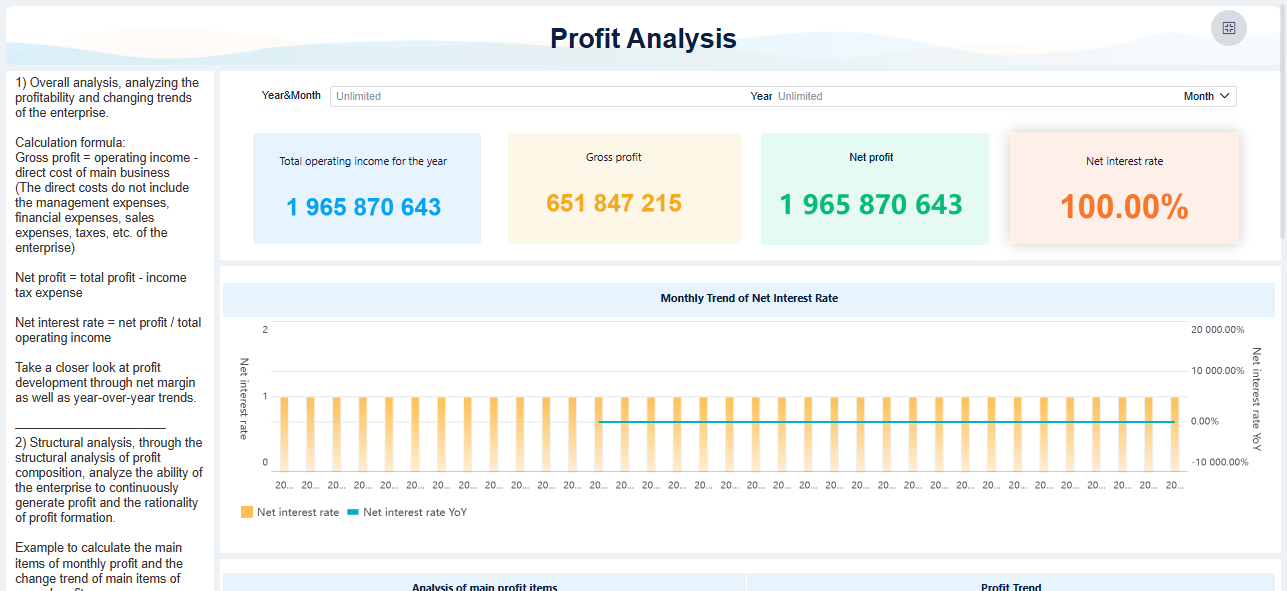
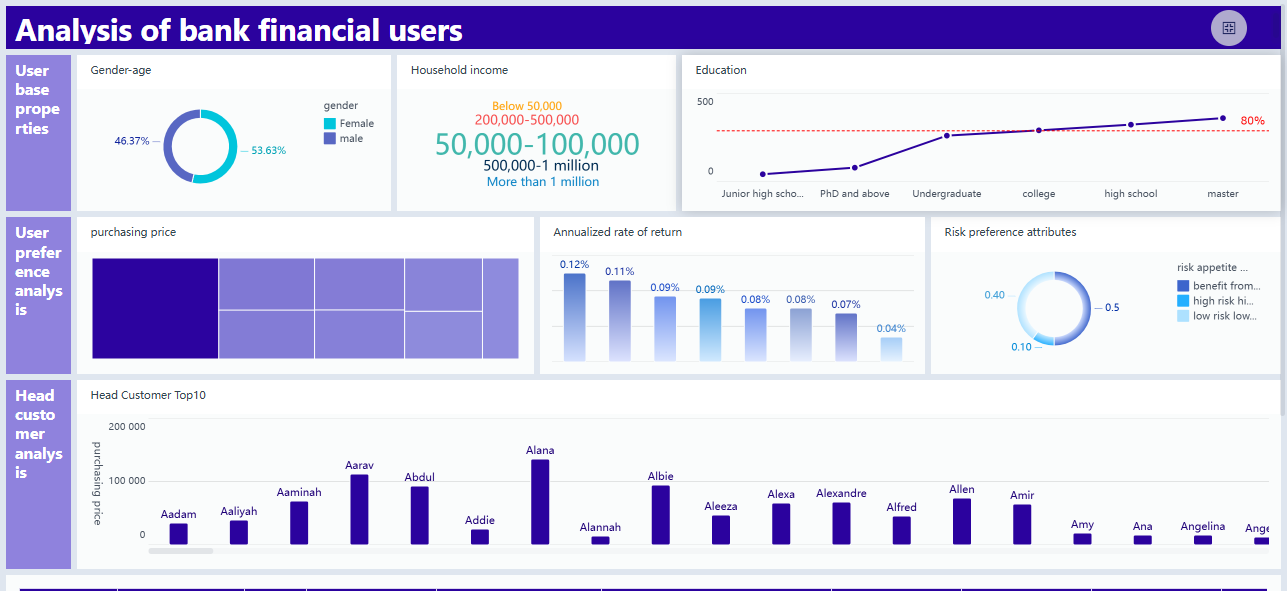
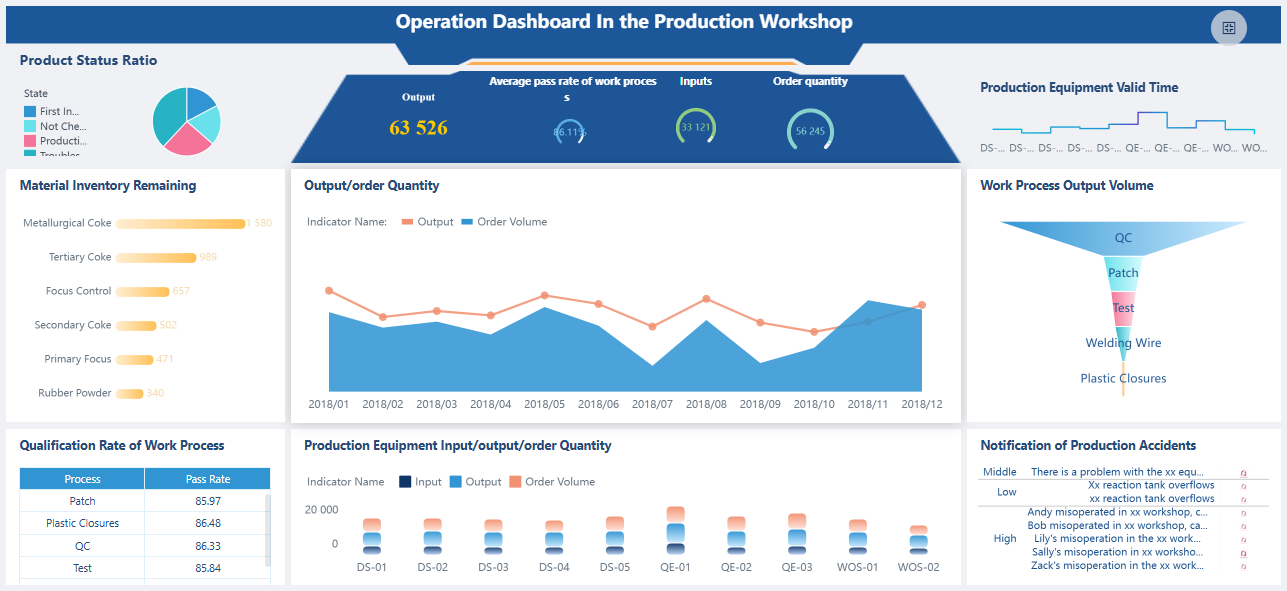
FineBI's Rich Built-in Chart Options For Data Visualization
Apache Hadoop is one of the most recognized big data tools. You can use it to store and process massive datasets across clusters of computers. Hadoop supports various data types and offers high flexibility. Many organizations rely on Hadoop for its open-source framework and scalability.
Apache Spark is a fast and general-purpose cluster computing system. You can use Spark for batch processing, machine learning, and real-time analytics. Spark processes data in memory, which makes it much faster than traditional big data analytics tools.
Support for multiple programming languages, such as Python, Java, and Scala.
Libraries for machine learning, graph processing, and streaming analytics.
A retail company can use Spark to analyze customer purchase trends in real time. This helps you adjust marketing strategies quickly and improve customer satisfaction.
Microsoft Power BI is a leading data analytics tool that helps you visualize and share insights across your organization. You can connect Power BI to a wide range of data sources, including Excel, SQL databases, and cloud services.
Tableau is a popular data analytics platform known for its advanced visualizations and interactive dashboards. You can use Tableau to connect to multiple data sources and create compelling data stories.
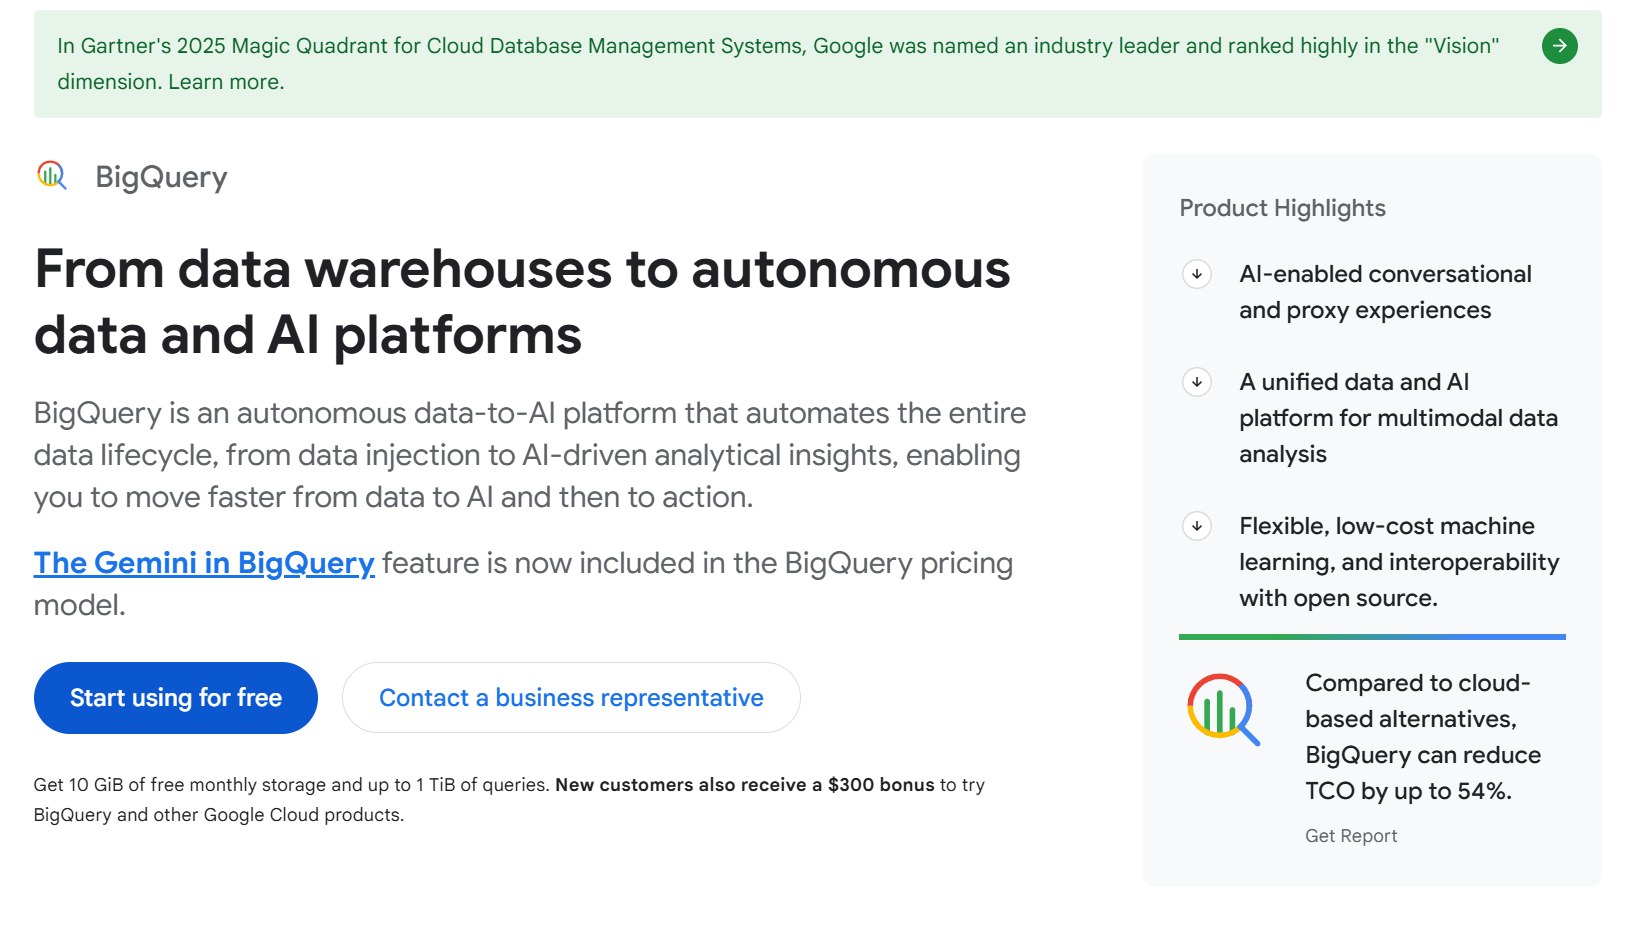
Google BigQuery is a fully managed, serverless data warehouse designed for large-scale data analytics. You can analyze petabytes of data quickly and efficiently.
Amazon Redshift is a cloud-based data warehouse that supports real-time analytics for large datasets. You can integrate Redshift with Amazon Kinesis and Amazon Managed Streaming for Apache Kafka to capture and analyze streaming data.
IBM Cognos Analytics is an enterprise-level data analytics tool that offers advanced reporting, visualization, and AI-driven insights. You can use Cognos to manage data security and governance across your organization.
Qlik Sense is a self-service data analytics tool that empowers you to explore data and generate insights without relying on IT support. The platform’s visual solutions make data exploration intuitive.
ThoughtSpot is a search-driven analytics platform that enables you to ask questions in natural language and get instant answers. The tool integrates with modern data stacks and uses AI to deliver fast, accurate insights.
Empowers users to access data, create visualizations, dashboards, and reports without IT reliance.
Integration with Modern Data Stack
Seamlessly connects with various data platforms, enhancing data analysis efficiency.
AI-Powered Insights
Utilizes natural language processing for faster, more accurate insights, improving decision-making.
User-Friendly Interface
Intuitive design that enables users to easily navigate and utilize analytics tools.
Enhanced Collaboration
Fosters teamwork by allowing multiple users to access and analyze data simultaneously.
Improved Data Literacy
Provides tools that help decision-makers understand and leverage data effectively.
A sales director can use ThoughtSpot to track pipeline performance and identify new opportunities using search-driven analytics.
The global data analytics market continues to grow rapidly. In 2024, the market size reached USD 50.04 billion and is expected to grow to USD 64.75 billion in 2025. By 2034, projections show the market will exceed USD 658.64 billion, with a compound annual growth rate above 25%. Choosing the right data analytics tools will help you stay ahead of trends and drive business success.
When you evaluatedata analytics tools, you need to focus on features that will support your business as it grows. The right tool helps you handle large volumes of information, connect with your existing systems, and empower your team to make informed decisions. FineBI, for example, offers self-service analytics, seamless integration, and robust governance, making it a strong choice for organizations seeking flexibility and control.
Scalability and Performance
Scalability ensures your analytics platform can keep up with your business as data volumes increase. Performance impacts how quickly you can process and analyze information. Consider the following factors:
Factor
Description
Current data volume
Measure how much data you process each day.
Growth projections
Estimate how your data needs will expand in the next few years.
Processing demands
Think about real-time analytics, query complexity, and user concurrency.
Budget constraints
Balance your technical needs with available resources.
Scalability requirements
Assess both current and future infrastructure, storage, and processing needs.
FineBI's high-performance engine supports real-time data analysis and dashboarding for thousands of users, making it suitable for large organizations.
Integration is essential for connecting your analytics tool to all your data sources. You want a platform that supports data quality, consistency, and timeliness.
Integration Capability
Description
Data Quality Management
Monitor completeness and analyze data for accuracy.
Consistency and Standardization
Apply rules to ensure data is uniform across systems.
Timeliness Management
Track data freshness and enable real-time processing.
Validity and Format Compliance
Validate data formats and business rules.
FineBIconnects to over 60 data sources, including big data platforms like spark and Hadoop, as well as cloud and relational databases.
A user-friendly interface encourages everyone in your organization to engage with data analysis. Tools that offer drag-and-drop features, natural language queries, and intuitive dashboards make analytics accessible to non-technical users. FineBI's self-service design and real-time insights help you make faster decisions and foster collaboration.
Tip: Easy-to-use data analytics platforms increase adoption rates and help teams uncover trends and insights quickly.
Security and Governance
Security and governance protect your business data and ensure compliance. Strong governance practices lead to higher business value and reduce the risk of costly errors.
Evidence Type
Description
Data Governance Impact
Mature governance increases business value from analytics investments.
Market Growth Prediction
Data governance is a rapidly growing market.
Cost of Poor Data Quality
Poor data quality can be expensive for organizations.
AI Integration Benefits
AI in governance reduces compliance incidents and improves data quality.
FineBIoffersenterprise-grade governance, including role-based access control and audit trails, so you can manage sensitive information with confidence.
Big data analytics transforms how you operate by enabling smarter, faster decisions across industries. You can use these solutions to uncover patterns, predict outcomes, and improve collaboration. The following examples show how organizations apply big data analytics to solve real-world challenges.
Real-Time Decision Making
You need to make decisions quickly in today’s fast-paced environment. Real-time analytics gives you the ability to process and act on information as it arrives. For example, banks use real-time processing to generate reports that reveal market trends and customer interactions. This approach helps you respond to changes instantly and improve your strategy.
Many organizations, such as JPMorgan Chase, have expanded their analytics user base dramatically. By adopting real-time dashboarding, they reduced manual reporting time from months to weeks. In the financial sector, companies like USAA use real-time analytics to assess customer satisfaction through instant survey feedback. Tableau dashboards help management visualize team performance and satisfaction in real time. These tools allow you to make informed decisions without delay.
Predictive analytics helps you anticipate future events by analyzing historical and current data. In healthcare, you can use predictive analytics to optimize hospital operations, estimate patient demand, and reduce wait times. Hospitals also use these tools to create personalized care plans and forecast disease onset, which leads to proactive care.
Application Area
Description
Operational Efficiency
Estimate patient demand, reduce wait times, and allocate resources effectively.
Personalized Health Care
Develop custom care plans based on individual patient data.
Early Preparation
Forecast disease onset for proactive intervention and prevention.
Manufacturers use predictive analytics to improve quality control and forecast demand. Companies like Tesla collect sensor data to enhance car manufacturing and performance. You can apply similar methods to anticipate equipment failures and optimize your supply chain.
Big data analytics encourages collaboration between departments. When you share insights across teams, you improve communication and coordination. For example, in large enterprises, procurement, IT, finance, and operations departments benefit fromshared analytics. This teamwork leads to cost savings and better demand planning.
Collaborative analytics ensures all teams stay aligned and informed.
You can identify workflow gaps and share insights across functions.
Verified data fosters transparency and cohesive strategies among departments.
Retailers like Walmart use advanced technologies to personalize shopping experiences, while logistics companies such as Maersk use big data analytics to manage disruptions and reduce waste. By integrating data from different sources, you enable every department to contribute to business growth.
Selecting the rightdata analytics tools for your organization requires a clear understanding of your goals and challenges. You want a solution that fits your current needs and supports future growth. The right choice will help you unlock the full value of big data analytics, streamline operations, and stay ahead of trends.
Assessing Business Needs
Start by evaluating your existing infrastructure and data environment. Determine how well a tool fits with your current systems and whether it supports your preferred deployment, such as a cloud-based platform or on-premises solution. Consider the experience of your users. Some teams may need advanced data visualization, while others require simple dashboarding. Make sure the tool aligns with your security requirements and data transformation needs. For example, FineBI helped BOE Technology Group integrate data from multiple sources, standardize metrics, and improve operational efficiency. This approach enabled BOE to achieve measurable business outcomes.
Review your infrastructure and deployment options.
Match the tool’s features to your team’s skills and needs.
Ensure compatibility with your data sources, such as snowflake or Hadoop.
Evaluating Cost and ROI
You need to look beyond the initial price tag. Consider both upfront and ongoing costs, including licenses, training, and maintenance. Measure the benefits, such as increased efficiency, cost savings, and risk reduction. Use clear metrics to calculate return on investment. The table below outlines key factors:
Category
Description
Initial Investment
Upfront costs like software licenses and hardware.
Ongoing Costs
Maintenance, training, and subscription fees.
Benefit Metrics
Revenue growth, cost savings, improved efficiency, and risk reduction.
Steps to Calculate ROI
Define objectives, set a time frame, and use ROI = (Net Benefits / Total Costs) * 100.
Vendor Support and Community
Strong vendor support and an active user community can make a big difference. You benefit from faster problem resolution, better communication, and ongoing improvements. Engaged vendors often provide resources, updates, and best practices. Community forums and knowledge bases help you solve issues and learn from others. This support transforms a simple purchase into a strategic partnership.
Future-Proofing Analytics Strategy
Plan for the future by choosing tools that scale with your business. Look for solutions that let you maintain ownership of your data and adapt to new technologies, such as cloud-based data analytics or advanced visualization. Building scalability into your analytics infrastructure from the start prevents costly changes later. You want a platform that grows with your needs and supports innovations in data visualization capabilities and data analytics solutions.
Tip: Prioritize tools that offer flexibility, strong integration, and advanced data visualization to ensure long-term success with big data tools.
Choosing the right analytics platform drives business growth and innovation. You gain measurable improvements in efficiency, decision-making, and market advantage. See the long-term benefits across sectors:
Sector
Benefits
Retail
Personalized experiences, efficient operations
Entertainment
Better decisions, crisis prediction
Transportation
Higher efficiency, improved customer insights
E-commerce
Stronger competitive strategies
To maximize impact, analyze your current performance, set clear benchmarks, and align tool selection with your business goals. Explore the recommended solutions to unlock your organization’s full potential.
Access a wealth of case studies, industry insights, and solution guides to accelerate digital transformation.
FAQ
What makes the Top 10 Big Data Analytics Tools different from traditional analytics tools?
You get advanced features such as real-time processing, AI-driven insights, and seamless integration with cloud and big data platforms. These tools support larger datasets and offer more user-friendly interfaces than older solutions.
How do I choose the right tool from the Top 10 Big Data Analytics Tools?
You should assess your business needs, data sources, and user skills. Look for tools that match your integration requirements, budget, and scalability goals. Try demos or free trials to see which platform fits best.
Can non-technical users work with the Top 10 Big Data Analytics Tools?
Yes, many tools offer self-service analytics, drag-and-drop dashboards, and natural language queries. You can explore data and create reports without coding or IT support.
Are the Top 10 Big Data Analytics Tools secure for sensitive business data?
You benefit from enterprise-grade security features, including role-based access control, audit trails, and data encryption. These tools help you protect sensitive information and meet compliance standards.
How do the Top 10 Big Data Analytics Tools support real-time decision-making?
You can process and analyze data as it arrives. Real-time dashboards and alerts help you respond quickly to changes in your business environment.