Looking for the best sales dashboards for 2026? You want tools that help you track sales, boost performance, and make smarter decisions. Sales dashboards are essential because they turn raw data into clear insights. Here are the top 10 best sales dashboards for 2026:
FineBI
Salesforce
HubSpot
Microsoft Power BI
Tableau
Zoho CRM
Pipedrive
InsightSquared
Klipfolio
Monday.com
Many companies struggle with sales forecasting—only 9% hit accurate predictions, while most miss by over 10%. When you use dashboards with real-time data and AI, you can improve sales forecasting and team results. FanRuan’s FineBI brings innovation to sales analytics with self-service features and real-time integration, making your sales process easier and more reliable.
Best Sales Dashboards for 2026
Choosing the best sales dashboards for 2026 can feel overwhelming. You want tools that give you real-time data, help your team perform better, and turn numbers into clear actions. Let’s break down the top sales dashboards you should consider this year.
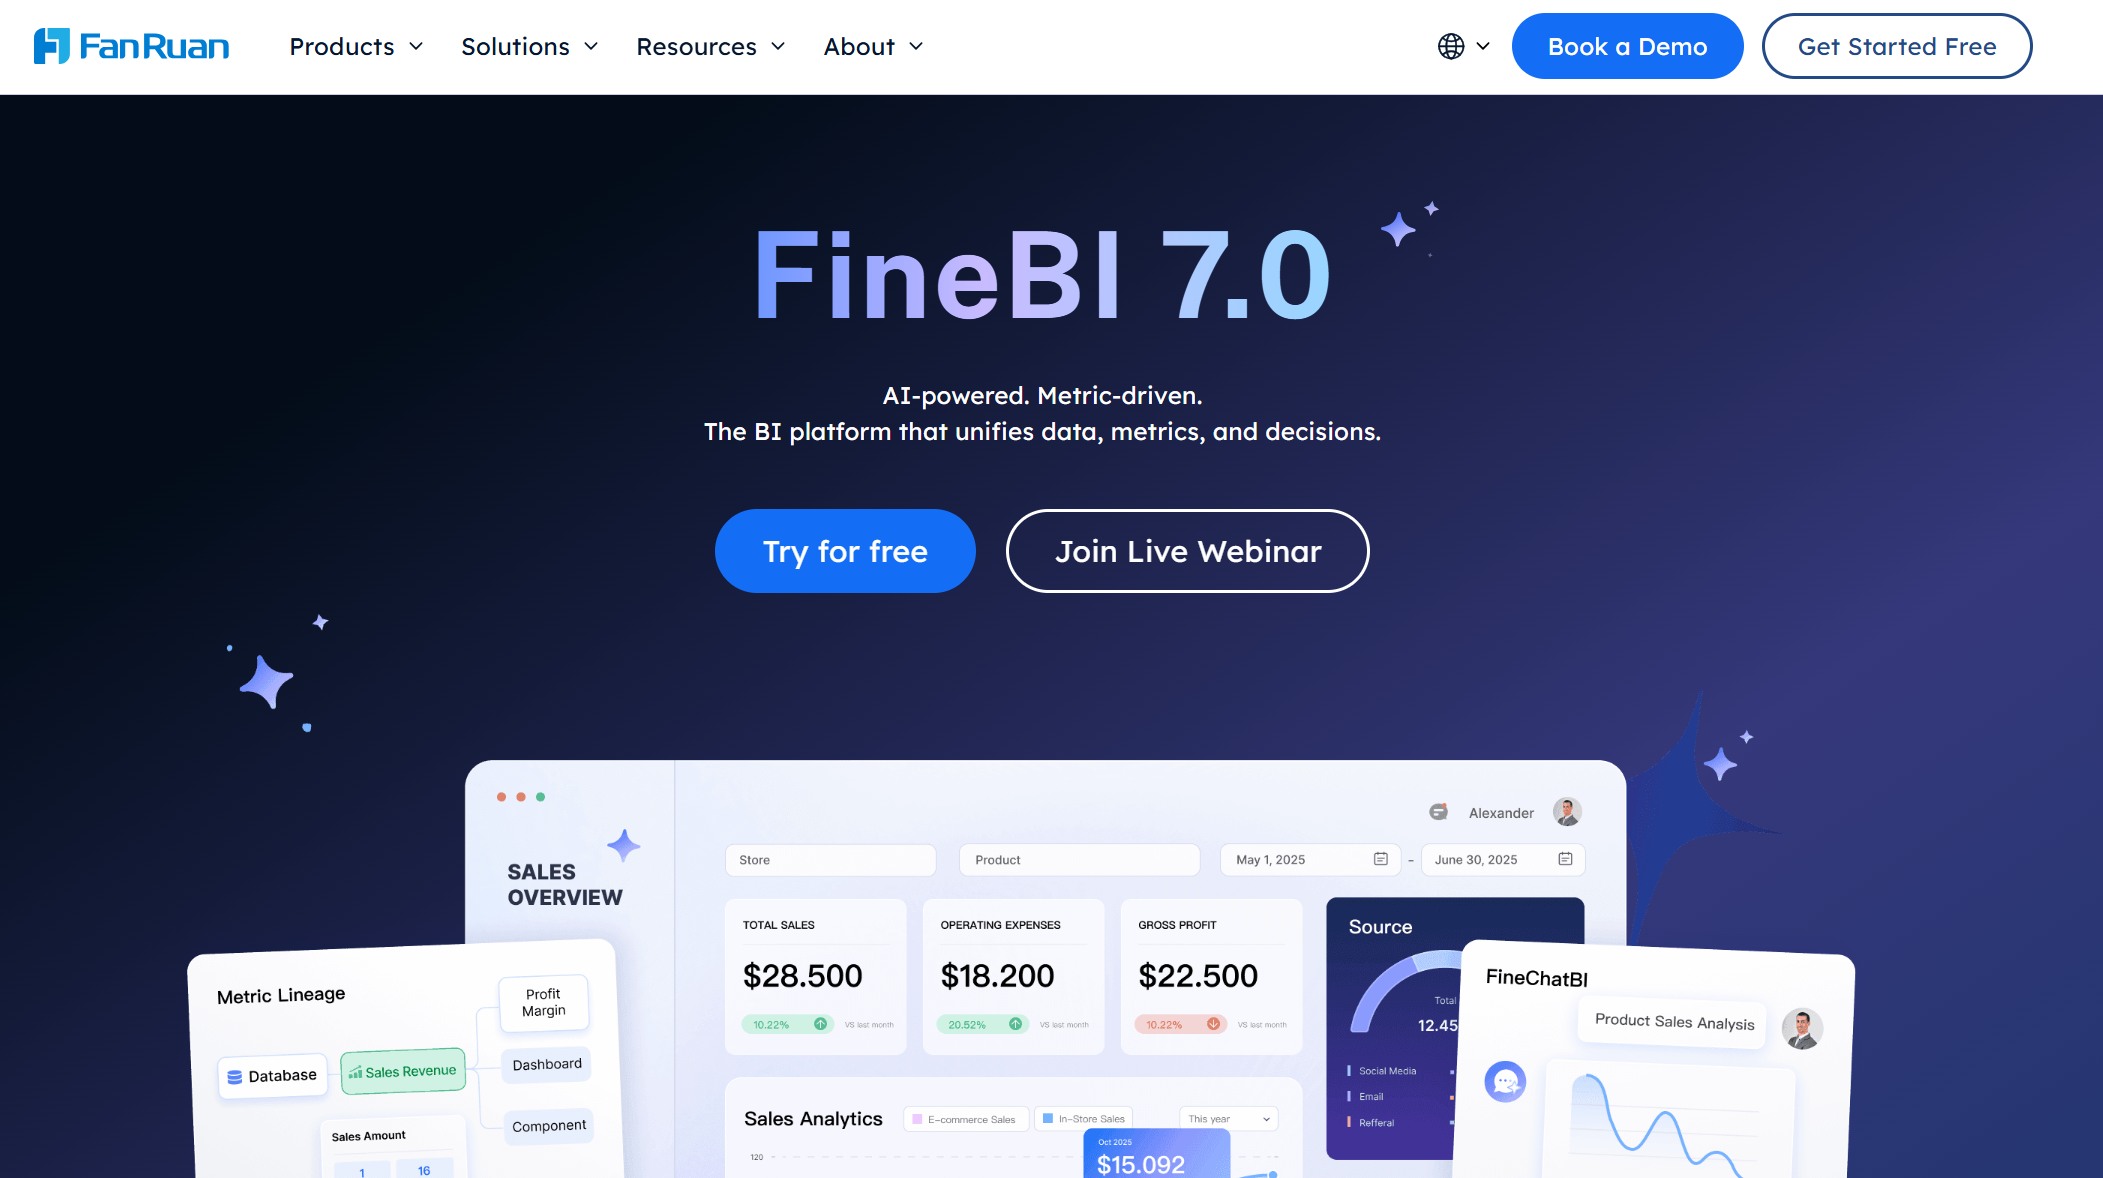
1.FineBI by FanRuan
FineBI by FanRuan is a standout among the best sales dashboards for 2026. You get self-service analytics, real-time data integration, and enterprise-grade features—all in a user-friendly package. FineBI connects to over 60 data sources, including relational databases, big data platforms, and cloud warehouses.
You can build dashboards with drag-and-drop simplicity, apply real-time filters, and share insights securely across your organization. FineBI’s sales dashboard empowers you to track KPIs, spot trends, and make decisions faster. If you want a sales dashboard that combines agility with enterprise-level governance, FineBI is your go-to solution.
Tip: FineBI’s real-time data integration means you always work with the latest numbers, so your sales strategy stays sharp.
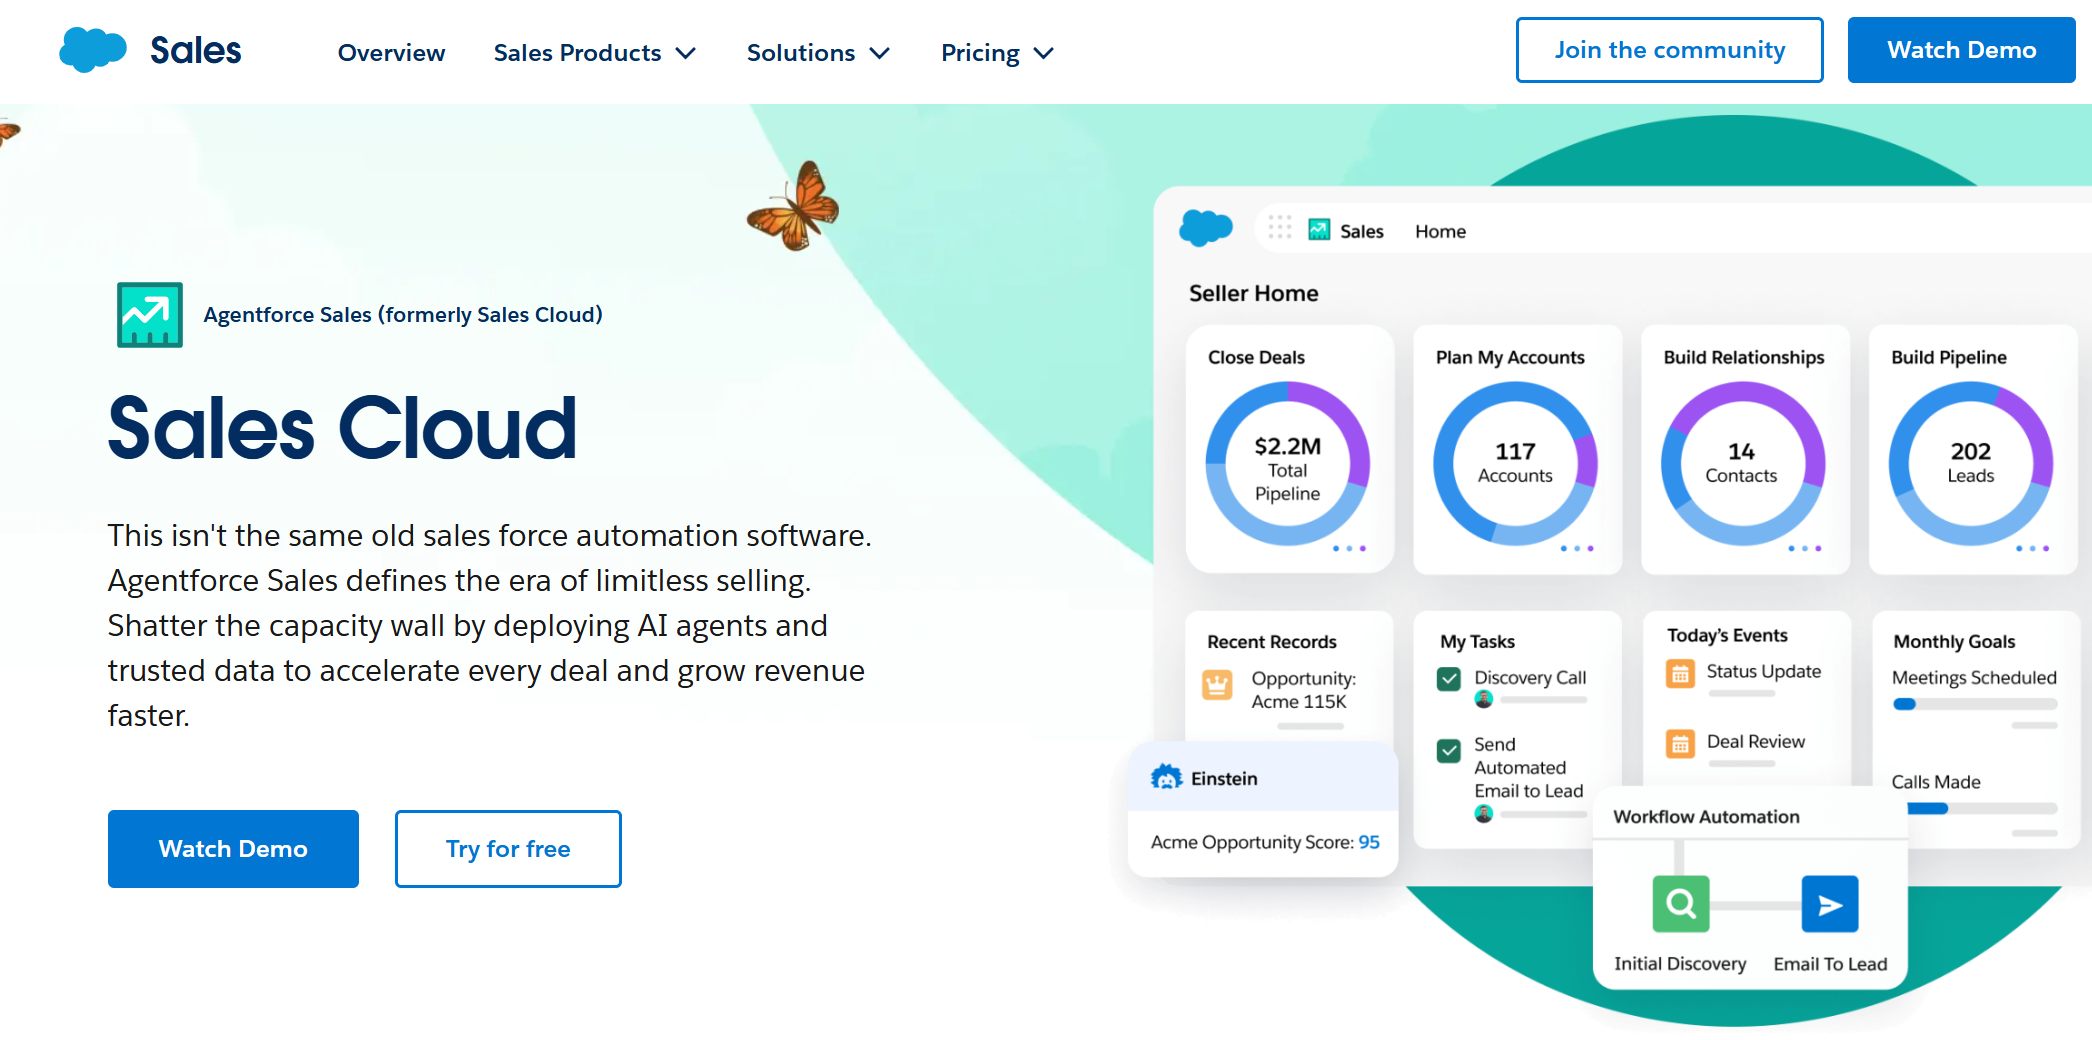
2.Salesforce Sales Cloud Dashboard
Salesforce Sales Cloud stands out as one of the top sales dashboards for 2026. You get advanced forecasting, end-to-end CRM integration, and dashboards you can customize for your team. The AI-driven insights and automation features make your sales process smoother. Users love the flexibility—92% rate it 4 stars or higher on G2, with an average rating of 4.4 out of 5.
“What I like about Salesforce Cloud is that it keeps all our customer information in one place... It’s super flexible too. We’ve been able to customize it to fit exactly how we work... The automation and AI features are awesome.”
You can track every part of your sales pipeline, automate repetitive tasks, and get instant updates on your team’s performance. If you want a sales dashboard that grows with your business, Salesforce Sales Cloud is a solid choice.
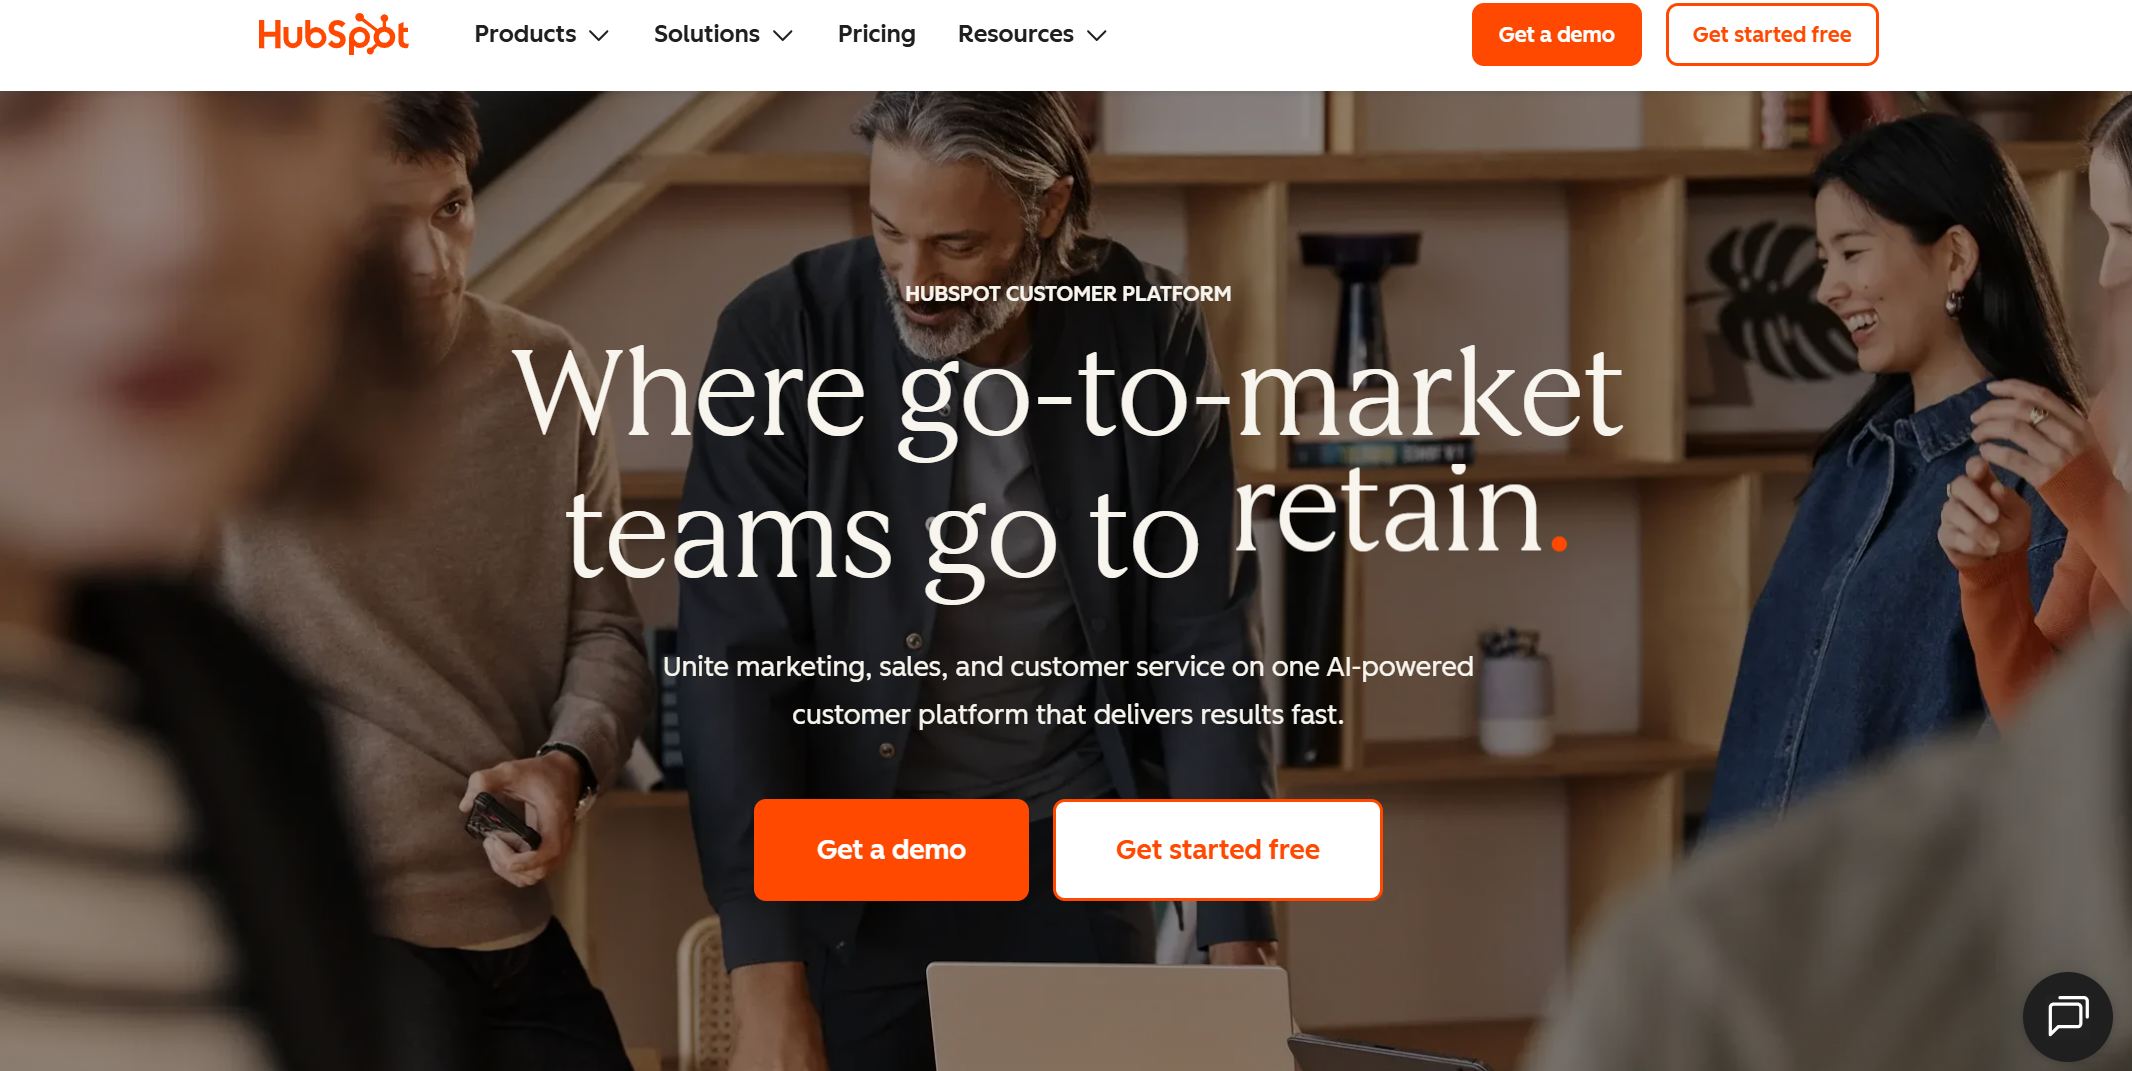
3.HubSpot Sales Dashboard
The hubspot sales dashboard is a favorite for teams that want everything in one place. You can connect with over 1,500 apps, including LinkedIn Sales Navigator, Stripe, Aircall, PandaDoc, and Google Workspace. Most integrations come with your plan, but some advanced tools may have extra costs.
Sales Hub Professional: $90/month per user (billed annually) with a $1,500 onboarding fee
Sales Hub Enterprise: $150/month per user (billed annually) with a $3,500 onboarding fee
The hubspot sales dashboard gives you a clear view of your pipeline, tracks deals, and helps you manage contacts without hassle. You can automate follow-ups, schedule meetings, and see which deals need attention. If you want a sales dashboard that’s easy to use and connects with your favorite tools, hubspot sales dashboard is a great pick.
4.Microsoft Power BI Sales Dashboard
With Microsoft Power BI, you get a sales dashboard that updates in real time. The live data connection means you always see the latest numbers. You can make decisions based on up-to-the-minute information, not yesterday’s news. Power BI connects to your data sources and refreshes automatically, so your sales team works with the most current data.
You can build custom reports, track sales trends, and share insights with your team. If you want a sales dashboard that’s always up to date, Power BI is a smart choice.
5.Tableau Sales Dashboard
Tableau gives you a sales dashboard that’s all about customization and interactivity. You can track total sales, monthly targets, conversion rates, and see which regions or products perform best. Filters let you switch between regions, time periods, or product lines with a click.
You can adjust parameters to view sales or profit metrics, making the dashboard practical for daily decisions. Tableau’s visual approach helps you spot trends and act fast. If you want a flexible sales dashboard that grows with your needs, Tableau is worth a look.
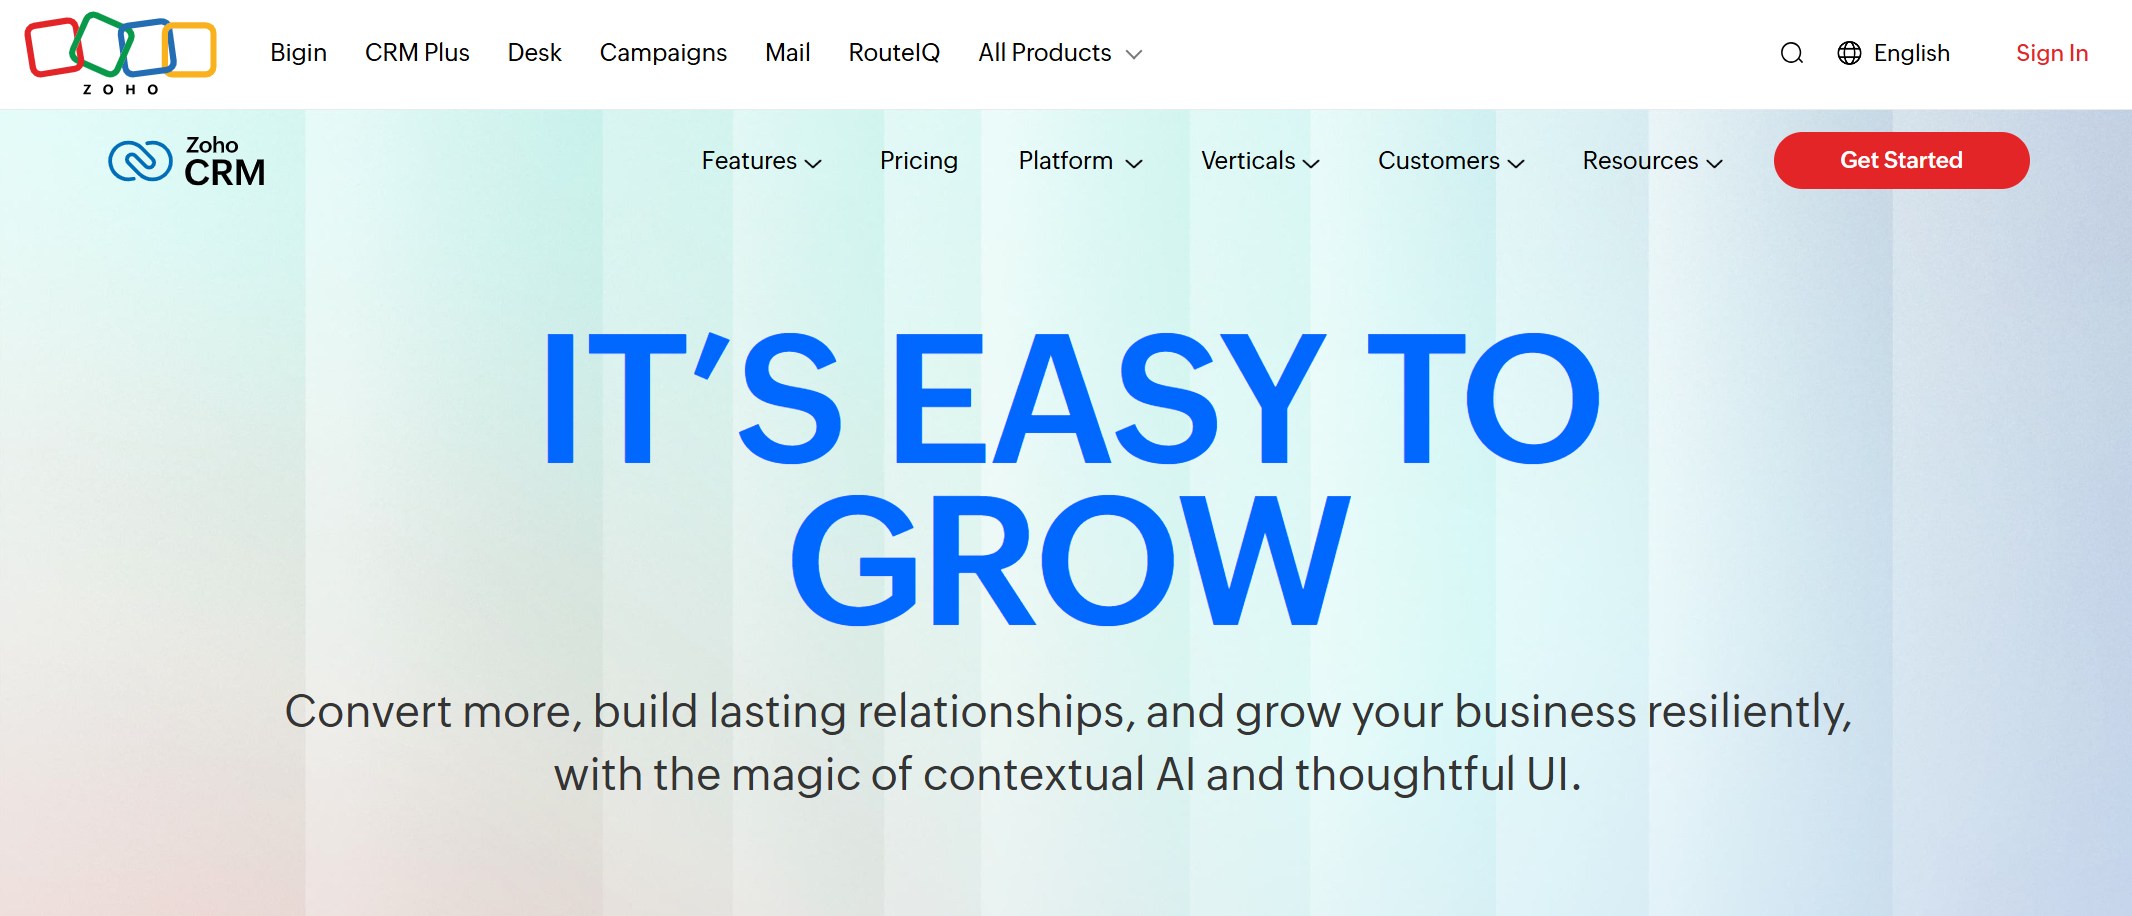
6.Zoho CRM Sales Dashboard
Zoho CRM offers a sales dashboard that makes pipeline management and reporting simple. Here’s a quick look at what you get:
Feature
Description
Real-Time Data
Ensures current information is always available for decision-making.
Variety of Charts
Offers multiple chart types to simplify complex data interpretation.
Easy Drag-and-Drop Interface
Allows users to customize dashboards without technical skills, enhancing usability.
Multiple Module Data
Combines data from various modules for a comprehensive view of business performance.
KPI Tracking
Measures team performance against set parameters, aiding in performance evaluation.
Anomaly Detection
Identifies discrepancies in business processes, highlighting potential issues.
Target Meter
Enables setting and tracking of targets for teams, facilitating goal-oriented management.
Funnel Visualization
Helps visualize different stages of the sales process, optimizing pipeline management.
Cohort Analysis
Analyzes customer behavior and trends over time, providing insights for strategic decisions.
Quadrant Analysis
Divides data into quadrants for effective metric analysis, such as campaign effectiveness.
Zone Analysis
Categorizes data from different operating zones to identify performance areas needing improvement.
Stage Component
Tracks progress through sales stages, providing insights into conversion rates and process efficiency.
You can drag and drop to build your dashboard, track KPIs, and spot issues before they become problems. Zoho CRM’s sales dashboard is perfect if you want a tool that’s both powerful and easy to use.
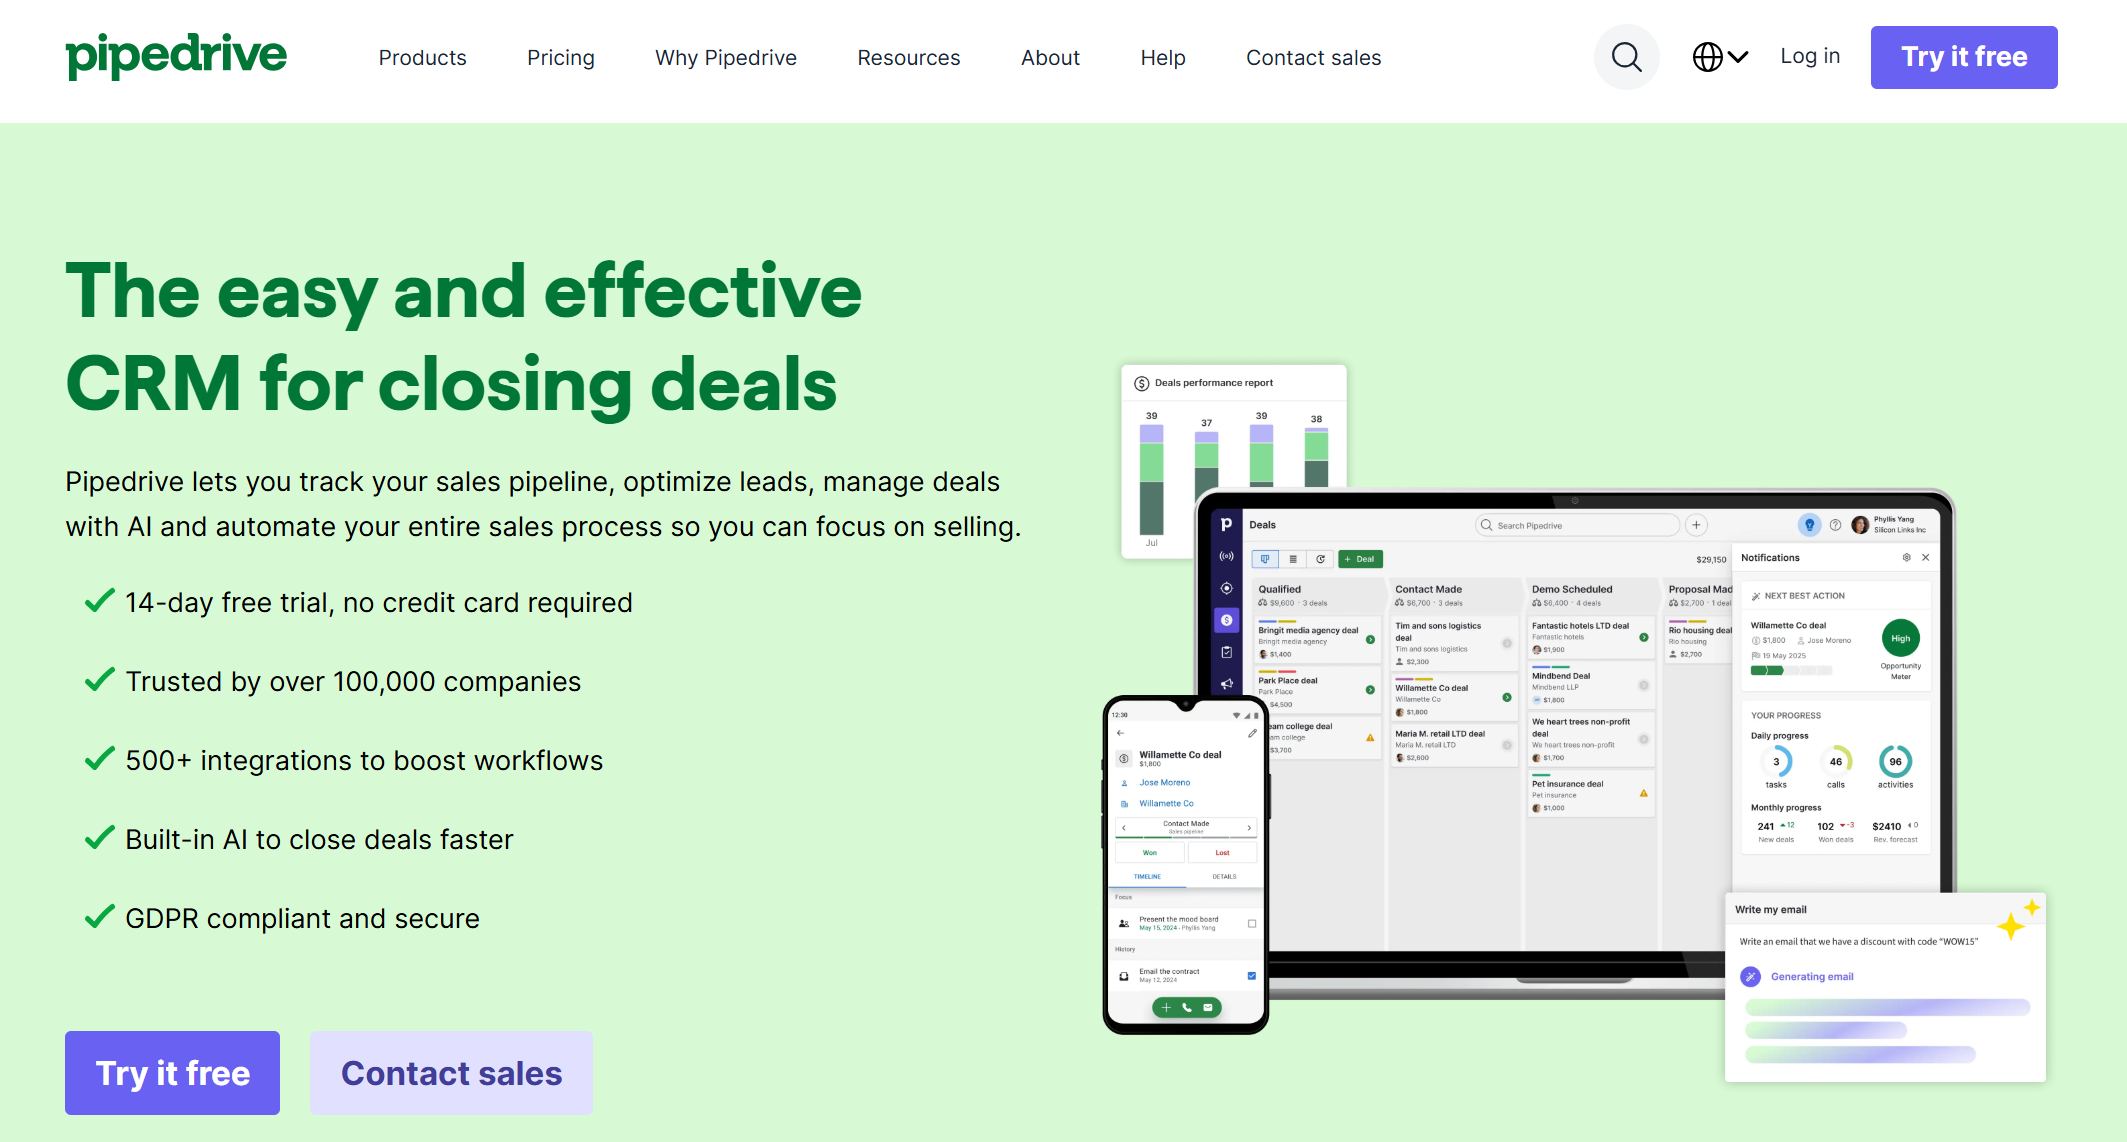
7.Pipedrive Sales Insights Dashboard
Pipedrive’s sales dashboard is built for small and medium-sized businesses. You get 11 pre-defined reports covering activities, pipeline performance, and sales results. These reports aren’t overly complex, so you won’t feel overwhelmed.
Pipedrive is user-friendly and helps you organize customer interactions and streamline your sales process. The platform’s reporting tools let you track sales performance and activity metrics without extra hassle. If you want a sales dashboard that’s simple and effective, Pipedrive is a great fit.
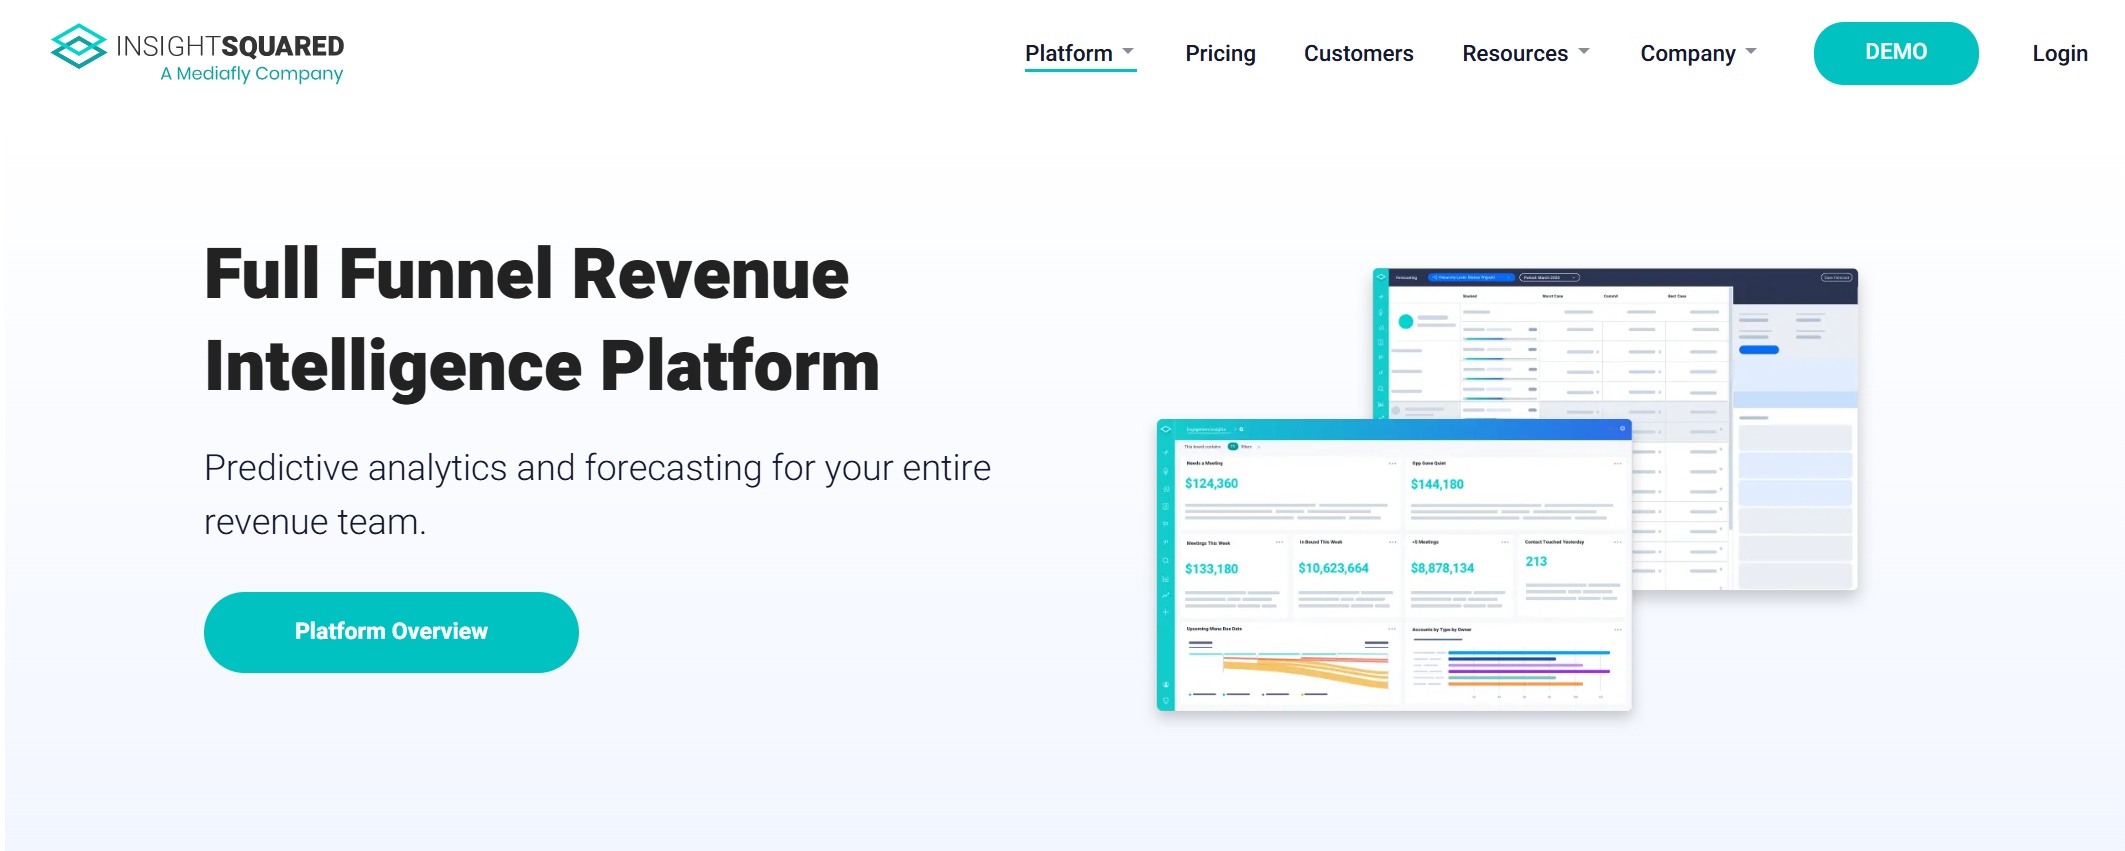
8.InsightSquared Revenue Intelligence
InsightSquared brings AI to your sales dashboard. You can automate forecast submissions, validate deal health with machine learning, and get a full view of your sales activities. The dashboard replaces error-prone spreadsheets and gives you an unbiased look at your pipeline.
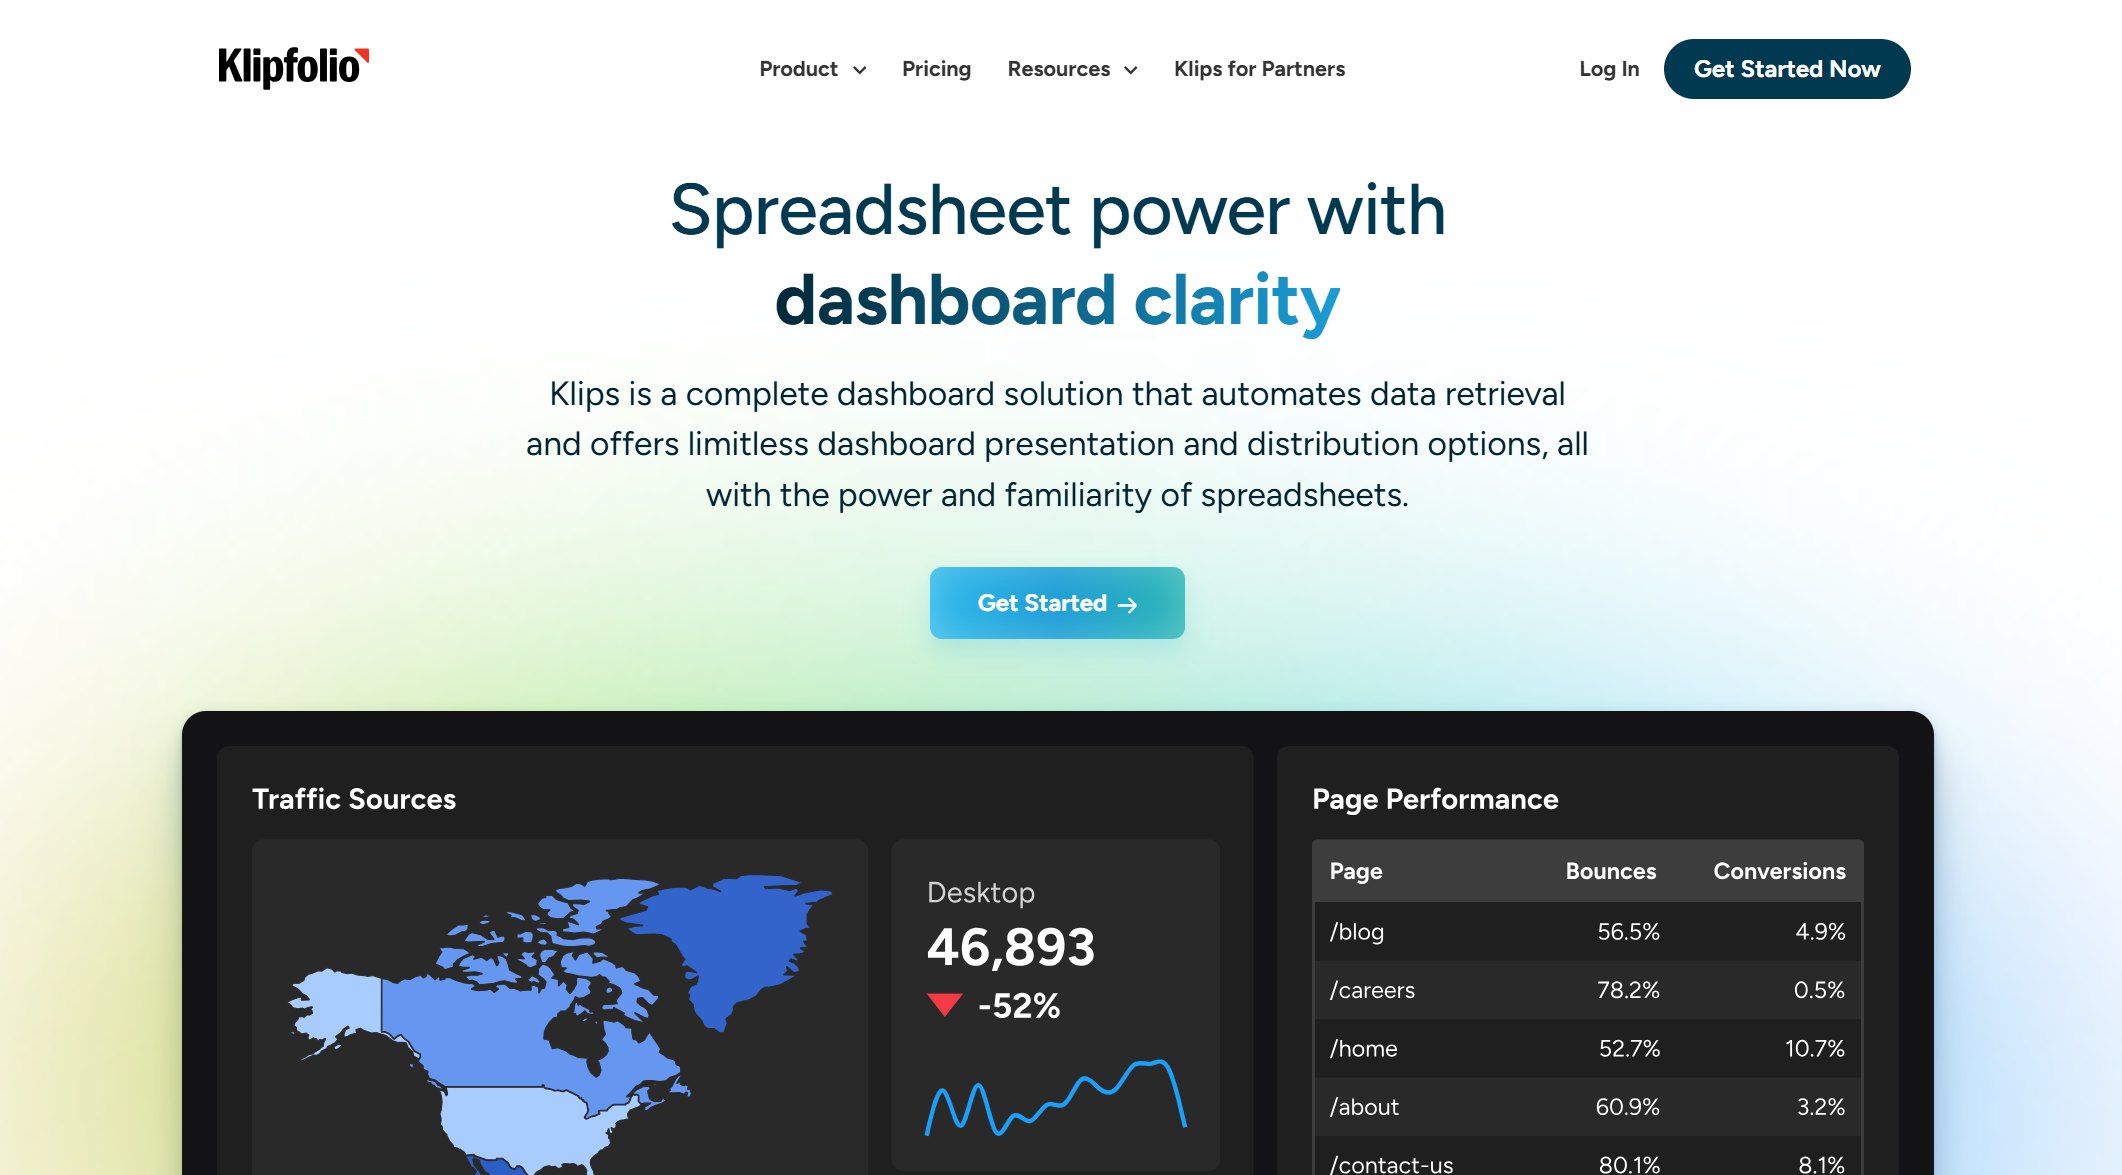
You can build custom dashboards, set goals, and monitor your team’s progress. Klipfolio makes it easy to see where you stand and what you need to do next.
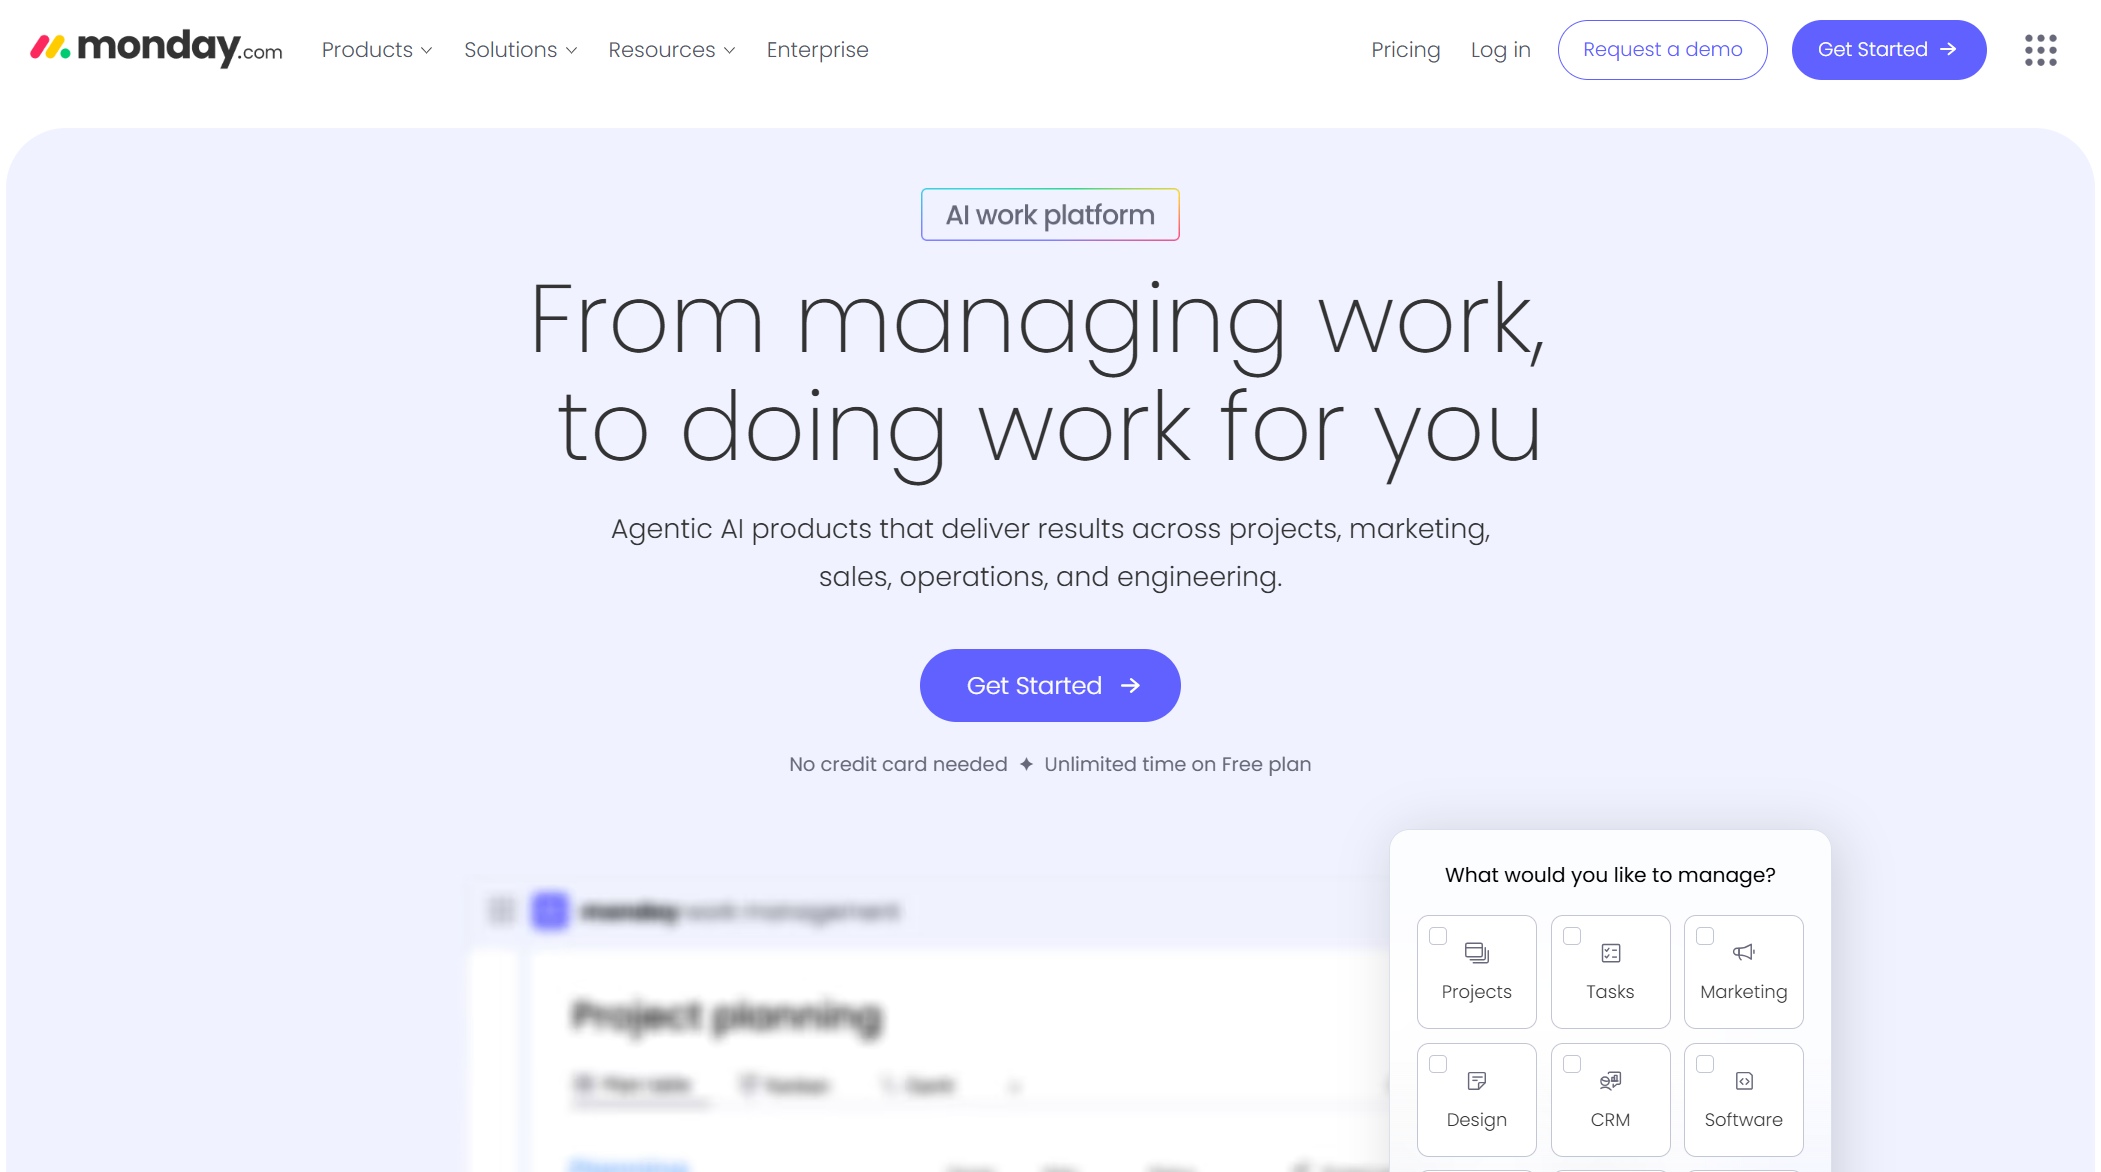
10.Monday.com Sales CRM Dashboard
Monday.com gives you a sales dashboard that’s all about teamwork and automation. You get AI-led automations to boost productivity, customizable dashboards for a unified view, and integration with over 200 work apps. You can access your dashboard from anywhere, even on your phone.
Automation handles repetitive tasks like follow-ups and scheduling.
Live data updates automatically.
Role-based views keep everyone focused on what matters.
Monday.com’s sales dashboard helps your team stay organized and efficient, so nothing falls through the cracks.
When you look for the best sales dashboards, focus on these criteria:
Real-time data
Enhanced team performance
Integration of multiple metrics
Actionable insights
Simplicity without sacrificing power
The right sales dashboard will help you monitor performance, forecast accurately, and drive growth in 202.
Why Sales Dashboards Matter
Real-Time Insights for Teams
You want your sales team to move fast and stay ahead. Sales dashboards give you real-time data, so you always know what’s happening. When you see live numbers, you can spot problems before they get big. Your team can shift from reacting to issues to preventing them. Everyone, from sales reps to managers, sees the same numbers. This keeps your team on the same page and helps you work together better. No more confusion from old spreadsheets or missing updates. You focus on closing deals and improving your sales tracking.
Tip: Real-time data means fewer surprises and more chances to win. Teams using dashboards respond faster and make smarter moves.
Improved Forecasting and Pipeline Management
Sales forecasting dashboard tools help you predict what’s coming next. You get a clear view of your pipeline management and can see which deals need attention. AI-powered dashboards can cut forecasting errors by up to 50%. Companies using these tools report forecasting accuracy as high as 79%. You can trust your numbers and plan with confidence. For example, Paycor saw a 141% jump in deal wins after using dashboards for pipeline management. When you use a sales forecast dashboard, you make better decisions and hit your targets more often.
AI-powered forecasting tools reduce errors by 20-50%.
Traditional methods reach 10-25% error rates, while AI dashboards drop that to 5-15%.
Companies using dashboards report higher accuracy and better results.
Data-Driven Decision-Making
Sales dashboards turn raw data into clear actions. You get instant insights that help you adjust your strategy and boost sales performance. Dashboards pull together key numbers, so you see everything in one place. You make decisions based on facts, not guesses. Leaders feel more confident because they know their choices are backed by accurate data. Take a look at how dashboards help you make smarter moves:
Evidence Type
Description
Real-time visibility
Dashboards show you what’s happening now, so you can act quickly and keep sales on track.
Advanced data analytics
You get better forecasts by looking at past sales and predicting future results.
Actionable insights
Dashboards highlight what’s working and what needs fixing, so you can improve sales funnel dashboard strategies.
You can use a sales funnel dashboard to track every stage of your sales process. This helps you spot trends, fix problems, and grow your business. When you rely on a sales dashboard, you make decisions that drive real results.
Key Features of Top Sales Dashboards
Essential Metrics Tracked
When you use a sales performance dashboard, you want to see the numbers that matter most. Top dashboards help you track key sales metrics so you can spot trends and make quick decisions. Here are some of the most important metrics you’ll find:
New leads added each week
Deals won versus deals lost
Average response time to prospects
Quota attainment by rep
Win rates by product or region
Sales revenue and average deal size
Sales cycle length and lead conversion rate
Number of calls, emails, and meetings booked
Follow-ups made and total pipeline value
Pipeline velocity and stage conversion
Leads by source and closed opportunities
New business versus upsell
Individual salesperson performance and product performance
A sales performance dashboard brings all these metrics together. You get a clear view of your pipeline, your team’s activity, and your results.
Integration and Customization
You want your sales performance dashboard to work with your favorite tools. Leading dashboards offer strong integration and customization options. Check out how some top platforms compare:
FineBI stands out with its self-service analytics and real-time data integration. You can organize data by business package, model data with composite keys, and merge analytics for unified reports. FanRuan focuses on innovation and customer-centricity, making sure you get a dashboard that fits your needs.
Security matters when you share sales data across your team. Top dashboards give you control over who sees what. Here’s what you can expect:
Feature
Description
Data-Level Security
Keeps sensitive data safe with advanced controls at user and tenant levels.
Tenant-Level Control
Lets you decide who can access data in your organization.
User-Specific Access
Customizes data access for each user with field-level policies.
Dynamic Security Constraints
Uses data tags so users only see authorized information.
Enhanced Visibility for Admins
Helps admins manage permissions easily.
Versatile Querying Support
Supports different ways to query data securely.
FineBI offers robust security features, including cluster design for data availability and dynamic constraints. You can share your sales performance dashboard with confidence, knowing your data stays protected.
Tip: When you choose a sales performance dashboard, look for strong metrics, easy integration, and solid security. That way, you get the most value from your sales data.
FineBI Sales Dashboard Use Cases
Manufacturing Sales Management
If you work in manufacturing, you know how tough it can be to keep track of sales and spot new opportunities. FineBI gives you a sales dashboard that makes your job easier. You see real-time data on every sale, so you can react fast. The dashboard helps you dive deep into sales numbers and find patterns that lead to revenue growth. You can connect FineBI to your existing systems, so you don’t waste time switching between tools. The predictive insights show you where your next big win might come from.
Enables monitoring of sales metrics and performance indicators dynamically.
Comprehensive Analysis
Allows deep dives into sales data to identify trends and opportunities.
Seamless Integration
Facilitates easy integration with existing systems for better workflow.
Predictive Insights
Provides advanced analytics for forecasting sales and identifying growth areas.
You get a clear picture of your sales pipeline and can make decisions that drive revenue growth.
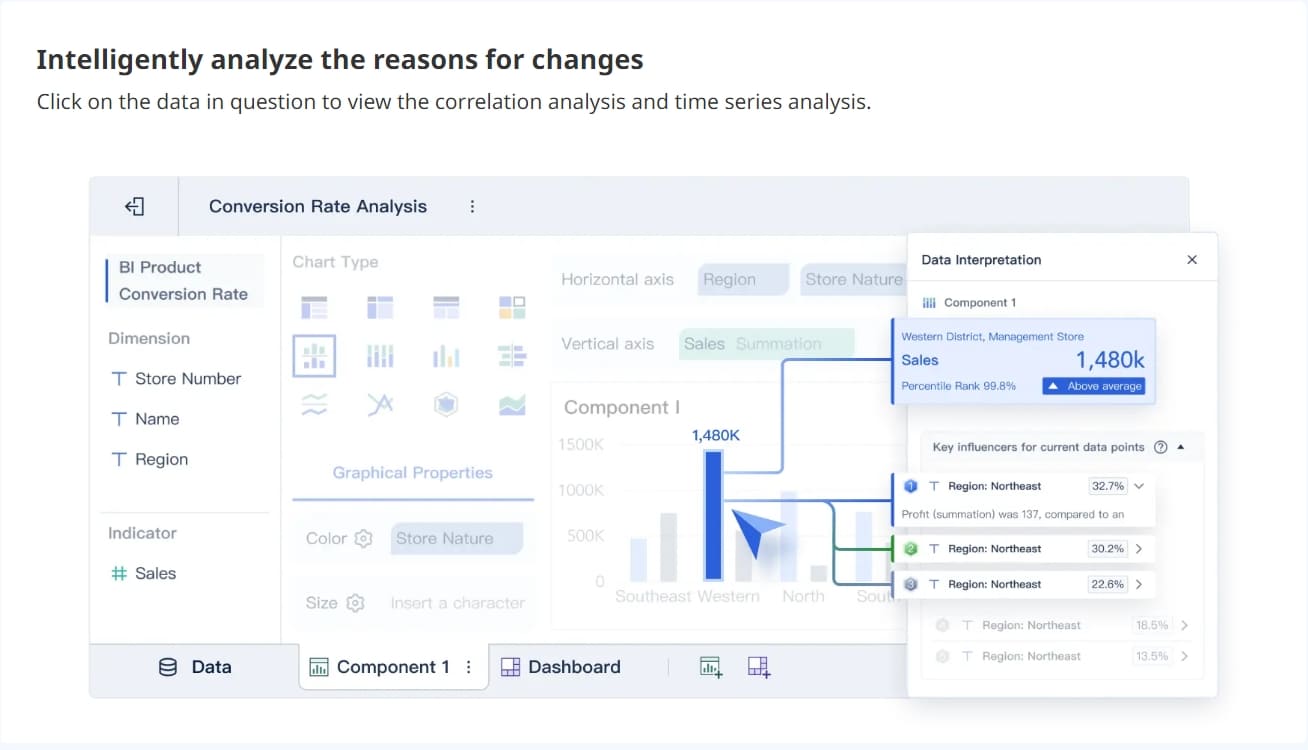
Financial Sales Analytics
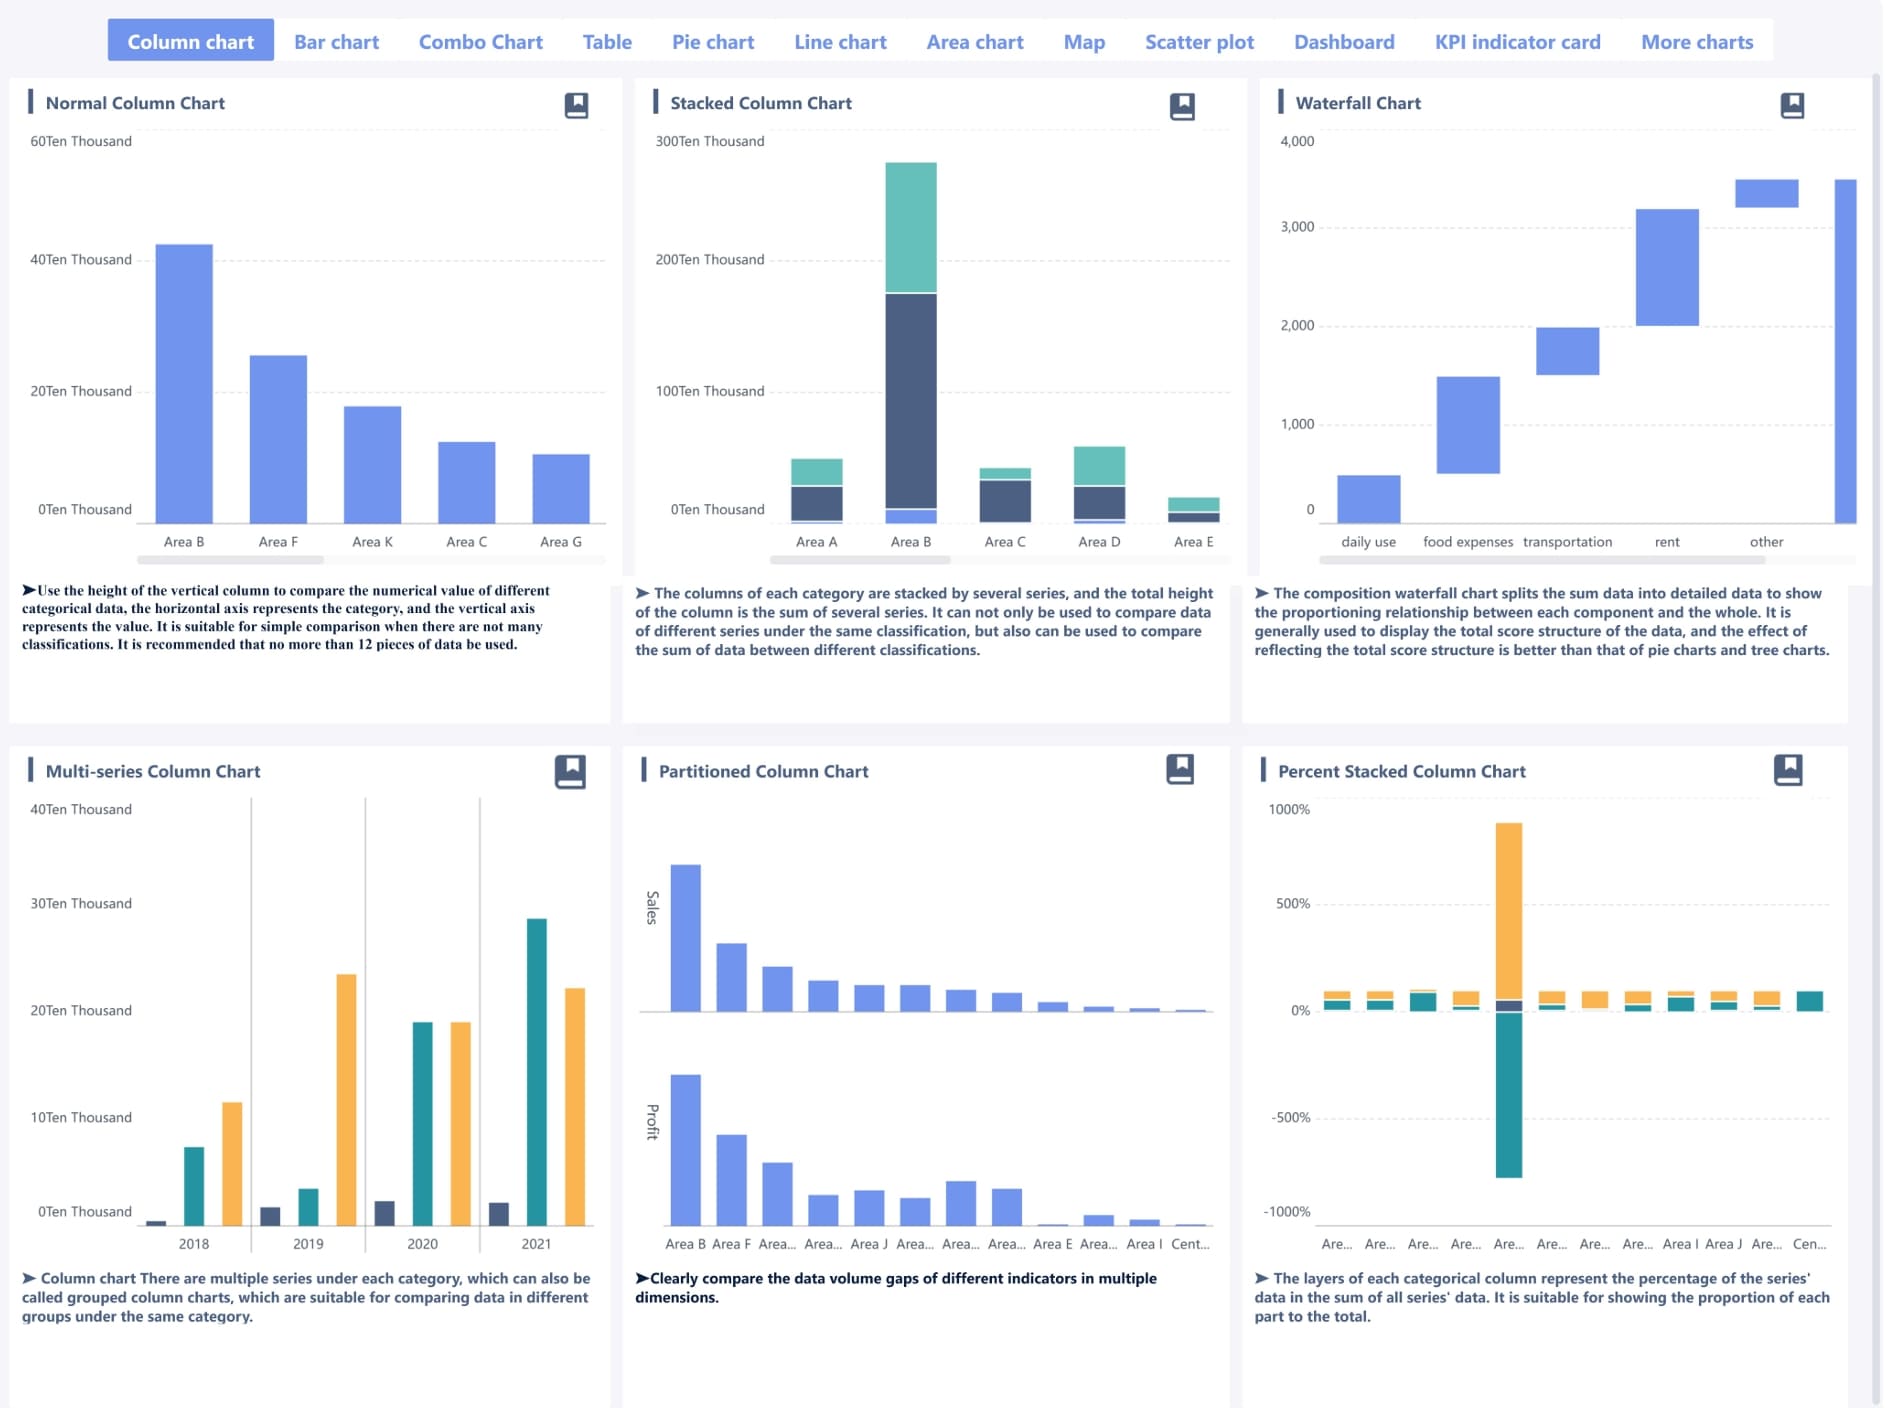
Managing sales in finance means you need quick answers and accurate forecasts. FineBI’s sales dashboard gives you self-service analysis, so you don’t have to wait for IT. You get real-time insights that help you respond to market changes. The dashboard offers over 60 chart types, making your data easy to understand. You can work with your team on dashboards and share ideas, which leads to smarter decisions. AI integration helps you spot trends and automate data processing. Improved sales forecasting means you can plan for revenue growth with confidence.
vertical bar chart of FineBI
Benefit
Description
Self-Service Analysis
Users can perform exploratory analysis without needing IT support, allowing for quick insights.
Real-Time Insights
The tool supports real-time data analysis, enabling quick responses to market changes.
Data Visualization
Offers over 60 chart types for visually appealing presentations of findings.
Collaboration Tools
Teams can collaborate on dashboards and share insights, promoting data-driven decision-making.
Advanced AI capabilities enhance sales performance by automating data processing and identifying trends.
Improved Sales Forecasting
AI analyzes historical data to improve the accuracy of sales forecasts.
You can use FineBI to track sales, forecast revenue growth, and make decisions that help your business succeed.
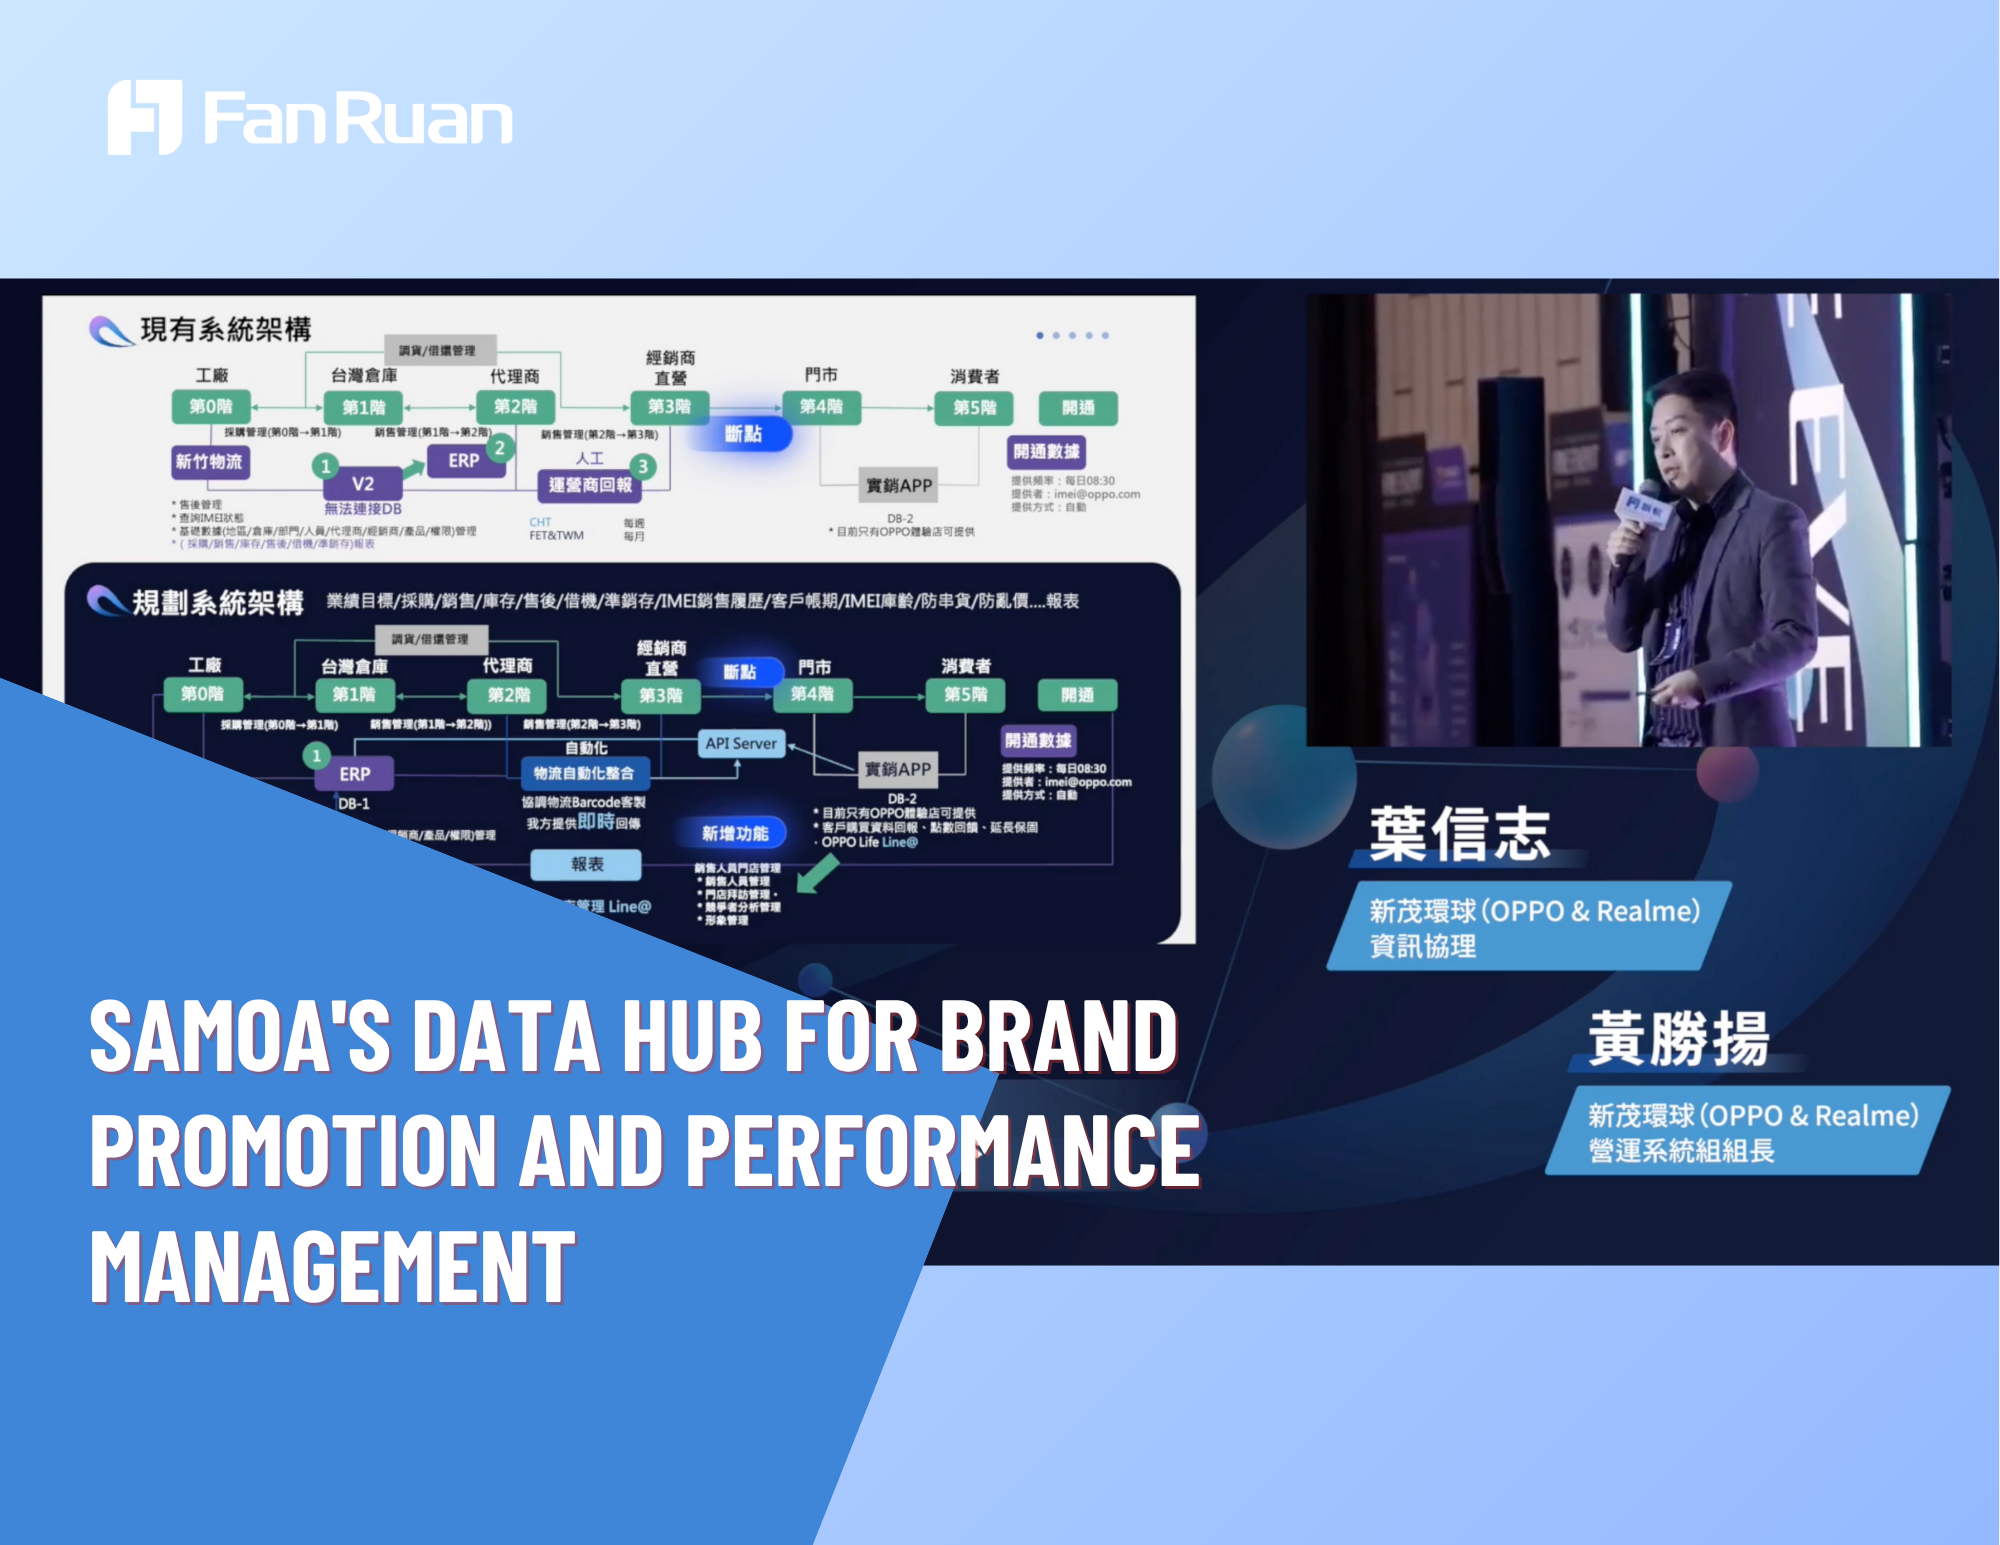
Customer Success Story: SAMOA
Let’s look at how SAMOA, a top distributor, transformed its sales management with FineBI. SAMOA struggled with data silos and slow reporting. The company needed a sales dashboard that could unify data and speed up decision-making. FineBI helped SAMOA build a transparent system where everyone could see real-time sales numbers. The dashboard automated bonus calculations and made performance tracking simple. SAMOA’s team now works with up-to-date data, so they can focus on driving revenue growth. The company plans to expand this solution worldwide, showing how a powerful sales dashboard can support global success.
Note: When you use FineBI, you get a sales dashboard that adapts to your needs, whether you work in manufacturing, finance, or retail. You see the impact on revenue growth and team performance right away.
How to Choose the Right Sales Dashboard
Assessing Business Needs
You want your sales dashboard to work for your team, not against it. Start by figuring out who will use the dashboard and what they need to see. Ask yourself what your dashboard should show to different audiences. Decide which key metrics matter most, like those in your sales pipeline dashboard or lead conversion dashboard. Make sure the information helps you draw clear conclusions and take action.
Here’s a quick table to help you focus:
Factor
Description
Organization
Keep your dashboard clutter-free and easy to read. Group data logically for better understanding.
Relevant and Timely Data
Use current data to track ongoing sales activities and trends.
Actionable Insights
Make sure insights help you make decisions and improve performance.
You need access to real-time data. This lets you see your sales cycle in one place and dig deeper into trends. When you know your audience and purpose, you can pick a sales dashboard template that fits your business.
Customization Tips
You want your dashboard to match your workflow. Set up role-based dashboards so each team member sees what matters most. Configure alerts for stalled deals or sudden drops in pipeline value. Use AI-powered analytics to sharpen your sales forecasts and add trend analysis widgets to adjust your strategy as data changes.
Try these tips:
Create automated weekly summaries for each sales rep.
Highlight hot leads based on engagement and readiness to buy.
Integrate marketing analytics to see which campaigns bring in the best leads.
Engage your team with custom views, filters, and drill-downs.
Refresh your sales dashboard template every quarter to stay aligned with goals.
Use AI insights to spot opportunities and recommend next steps.
A good sales dashboard template makes it easy to track your sales pipeline dashboard and lead conversion dashboard, so you can act fast.
Adoption Best Practices
Getting your team to use the dashboard is key. Keep training simple with clear language and visuals. Focus on practical, hands-on learning. Motivate your team with incentives for using the dashboard in their sales workflow. Create a feedback loop so you can keep improving the dashboard based on what your team needs.
Tip: When you choose a dashboard, look for integration, scalability, and user-friendliness. The right sales dashboard helps your team stay focused, make better decisions, and grow your business.
You want your sales team to grow and succeed. The best sales dashboards help you see real-time analytics, save time, and make smarter decisions. You can share insights quickly and focus on driving sales. FineBI by FanRuan lets you build a powerful sales platform. You get self-service analytics, interactive dashboards, and easy data analysis. Your team can pull sales data from many sources and create dynamic visualizations. Try a sales dashboard that fits your business. Click the banner below to get a free trial!
Real-time analytics boost sales performance.
Dashboards save hours and improve sales focus.
FineBI empowers you to analyze sales data independently.
Product Trial
FineReport
Pixel-perfect reports · Interactive dashboards · Easy data entry · Digital twins