Self-service BI gives you the power to access, analyze, and visualize data without relying on IT specialists. With self-service business intelligence, you can explore information, generate reports, and uncover trends on your own. This approach puts you in control of your data, making business intelligence more accessible and practical for every team. You no longer wait for IT to deliver answers. Instead, you use self-service tools to make decisions quickly and confidently.
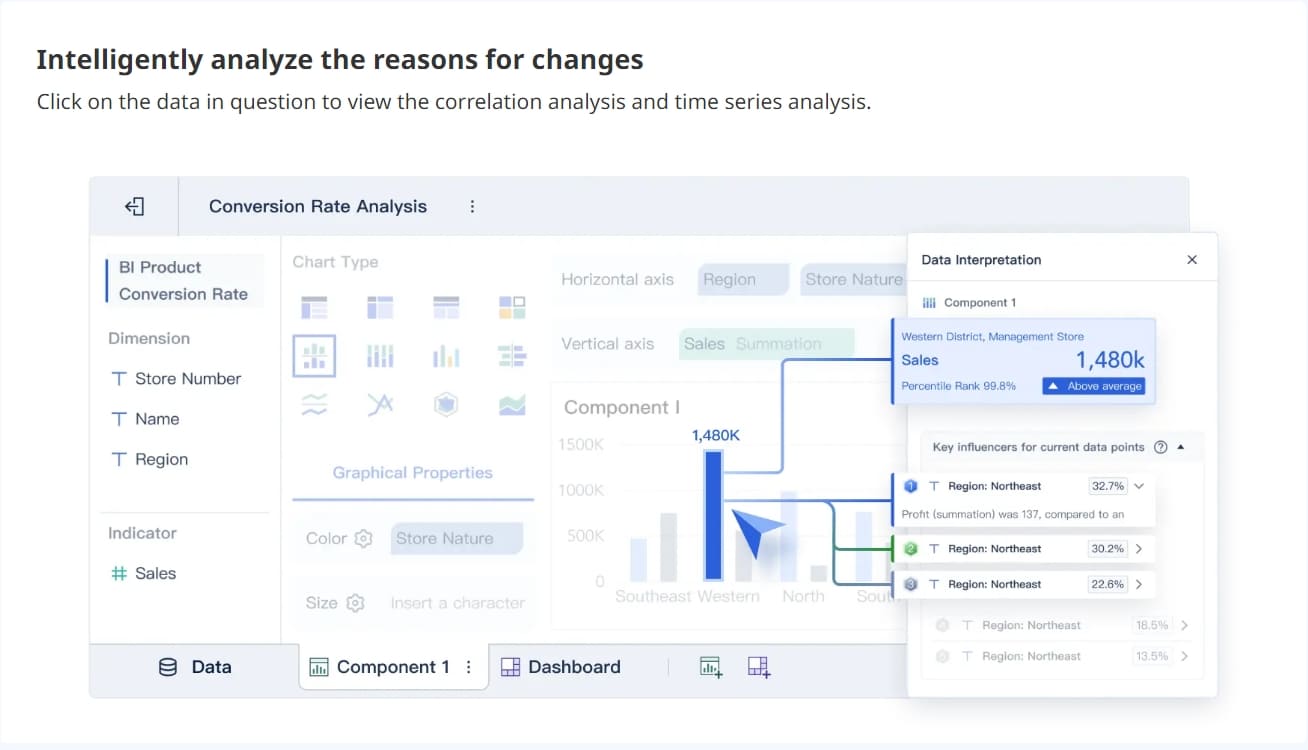
Self-service analytics helps you spot patterns and adjust strategies in real time, so your decision-making becomes faster and more effective in a world where data drives success.
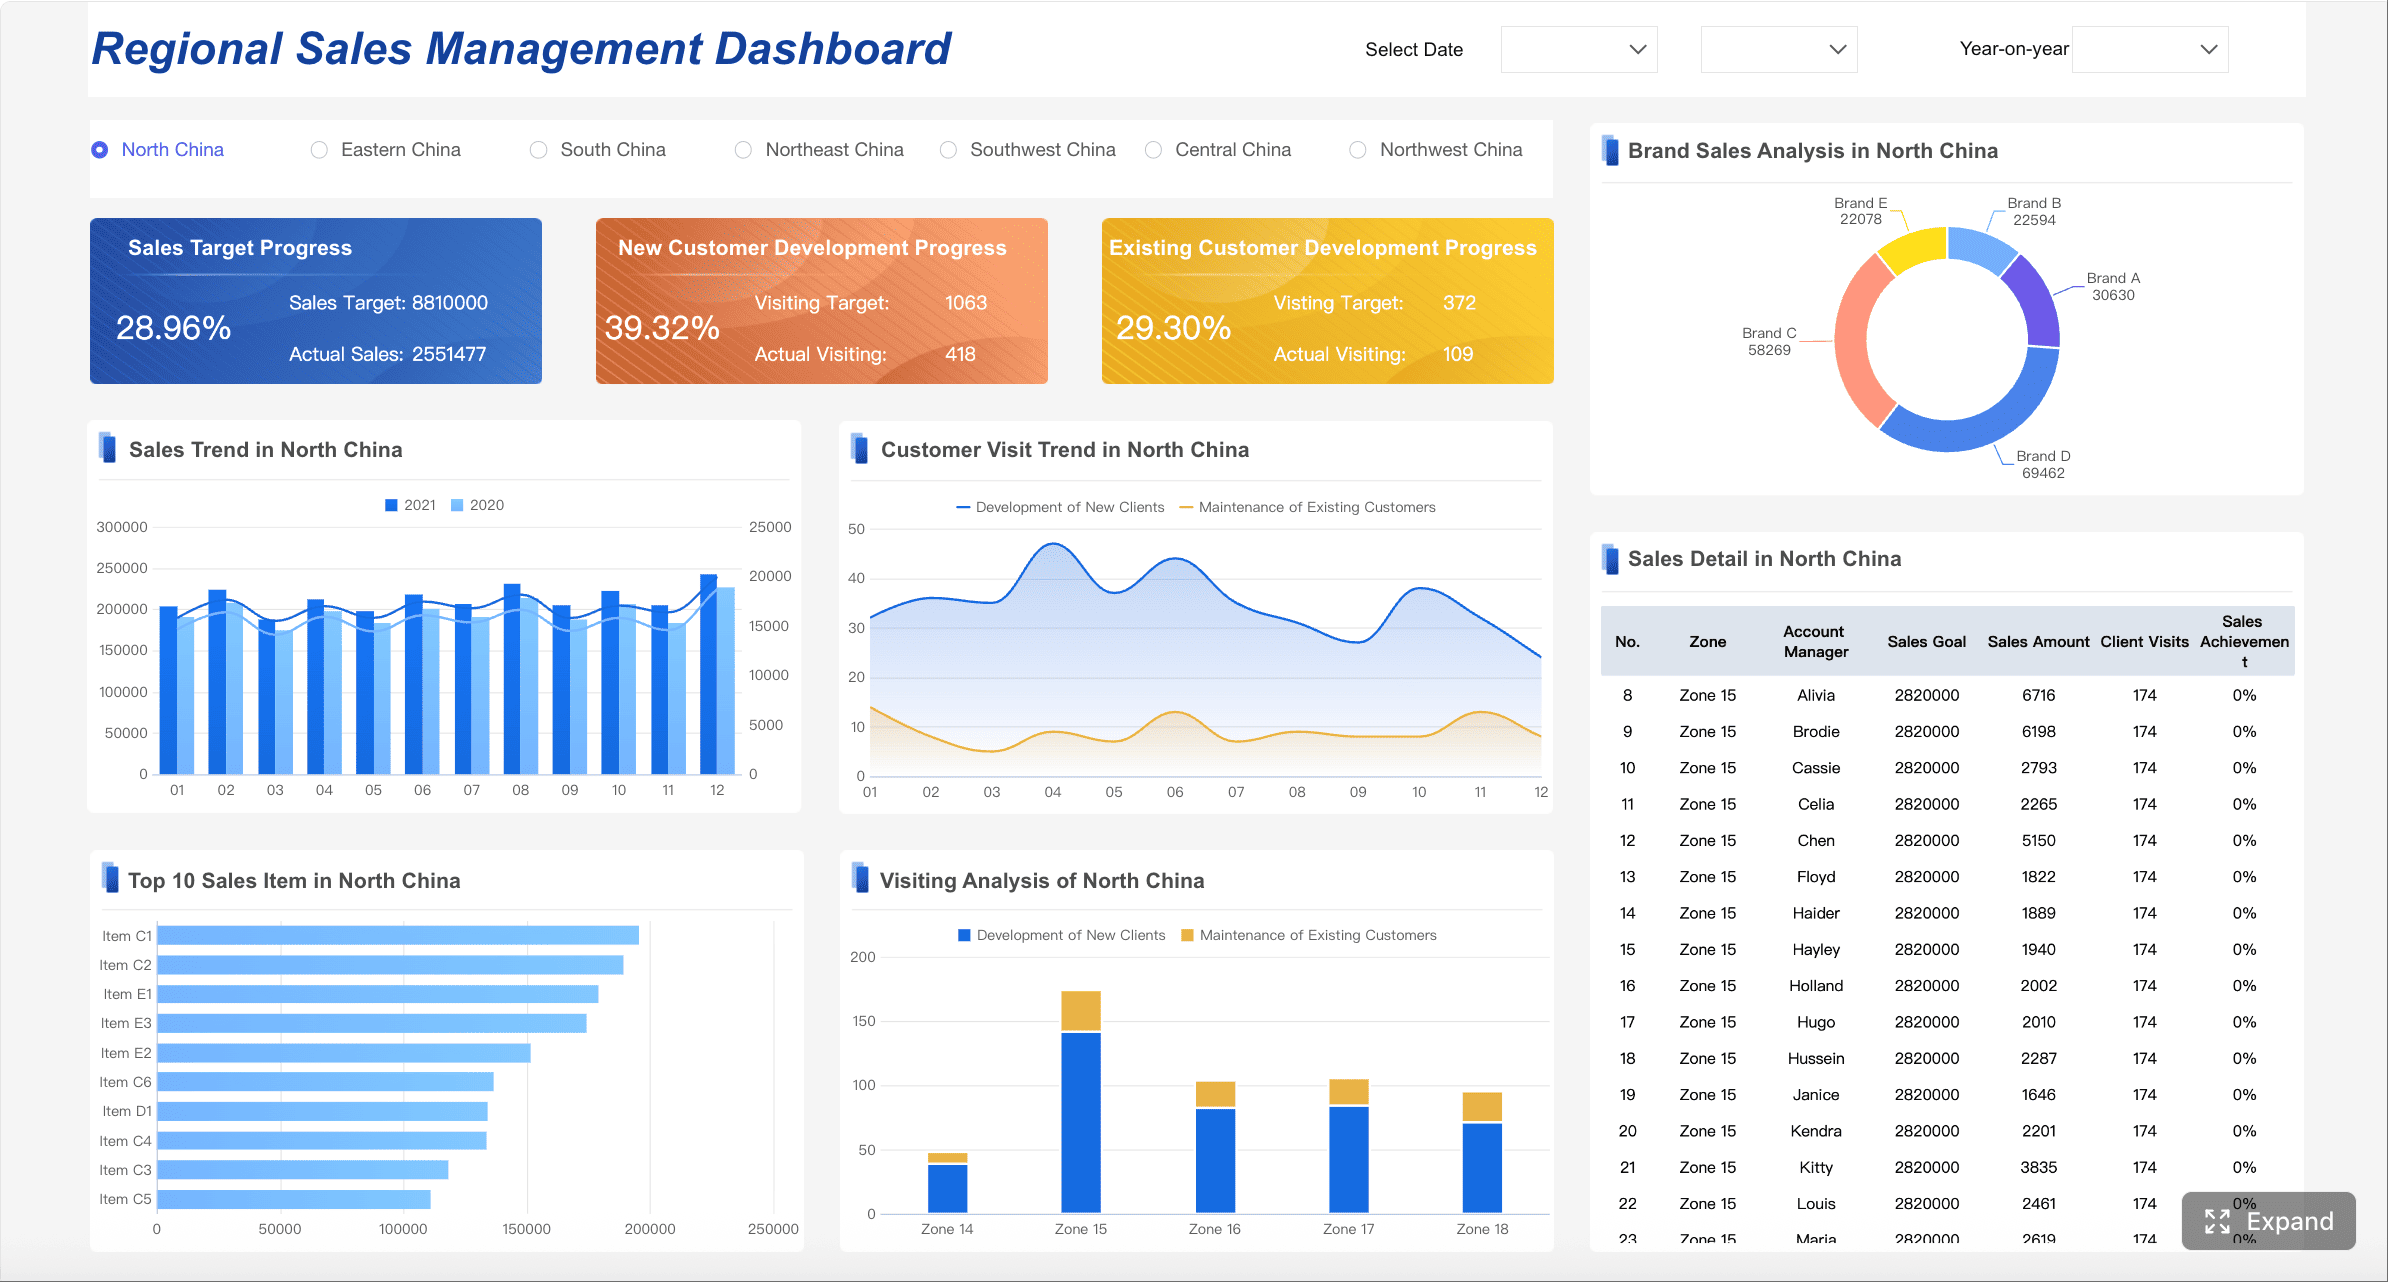
All Dashboards in this article were created by FineBI.
Self-service BI gives you the ability to explore, analyze, and visualize data without waiting for IT or data specialists. You use self-service business intelligence tools to connect to different data sources, create your own reports, and answer business questions on your own. This approach puts you in control of business intelligence and makes data analytics more accessible to everyone in your organization.
You can use self-service BI to solve real business problems. For example, in retail, you might predict customer churn by analyzing purchase frequency, returns, and browsing behaviors. You can respond quickly to changes and make better decisions. Self-service analytics empowers you to find insights faster, drive innovation, and improve results across many industries.
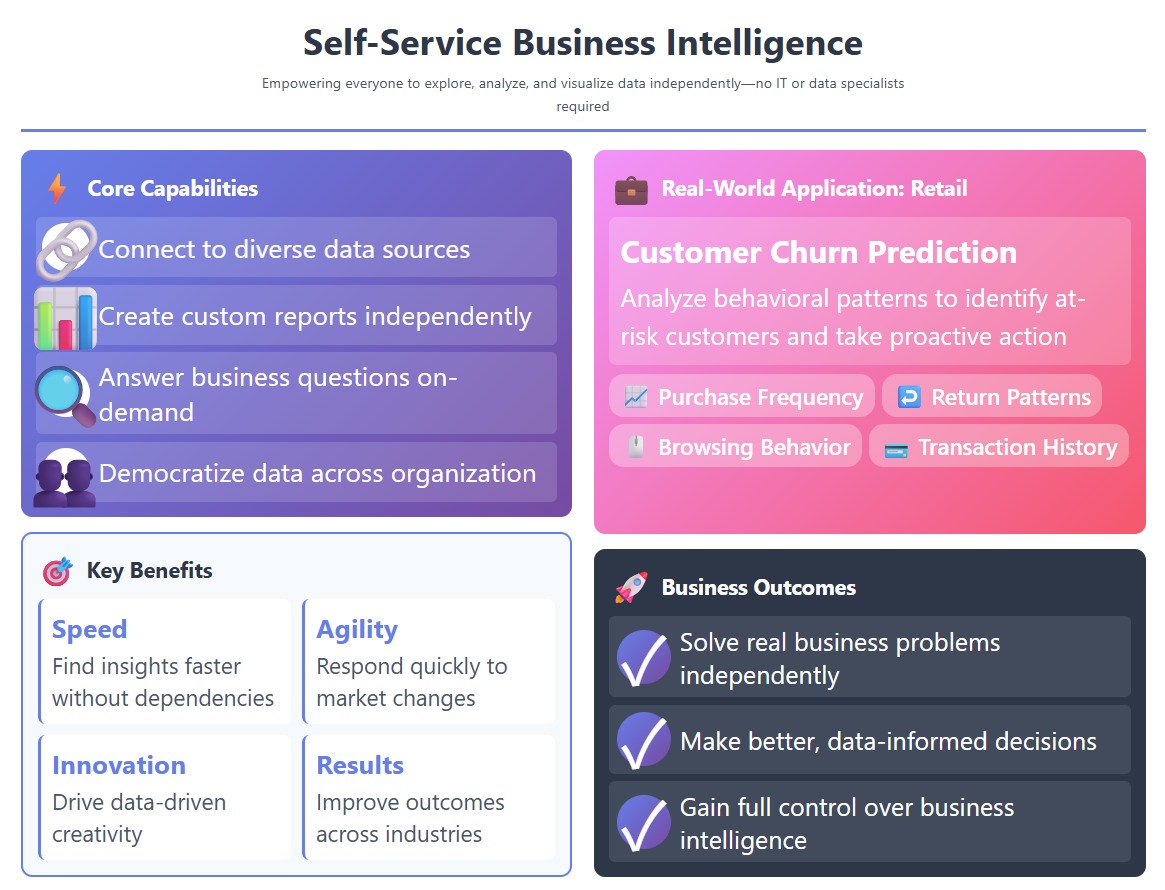
Self-service BI platforms offer several features that help you work with data more effectively:
Drag-and-drop dashboards: You build visualizations and reports without writing code.
You will notice big differences between self-service BI and traditional business intelligence tools. The table below shows how self-service BI compares:
| Feature | Self-Service BI | Traditional BI |
|---|---|---|
| Flexibility | High – You create your own reports | Low – Standardized reporting |
| Time to Insight | Reduced – You generate insights quickly | Longer – IT report generation cycle |
| Democratization of Data | Yes – Data accessible to all business users | No – Limited to data scientists and IT |
| Engagement | Increased – You work directly with data | Decreased – You rely on IT for reports |
| Personalization | High – Tailored reports for your needs | Low – One-size-fits-all reports |
Self-service BI gives you the freedom to explore data, uncover insights, and make decisions faster. You do not need to wait for IT. You can use business intelligence to drive your organization forward with confidence.
You experience a major shift in how you access and control data when you move from traditional business intelligence to self-service BI. In traditional BI, you depend on IT teams or data specialists to handle data access and reporting. You often wait for approvals or technical support before you can view or analyze information. This process slows down your ability to respond to business needs.
Self-service BI changes this dynamic. You can run your own queries, build dashboards, and explore data without waiting for IT. You gain independence and control over your analytics. Most platforms let you connect to multiple data sources and customize your reports. You work directly with data, which makes business intelligence more practical for everyday use.
Tip: Self-service BI platforms often include user-friendly interfaces, so you do not need advanced technical skills to start analyzing data.
Here is a table that highlights the main differences in access and control:
| Feature | Traditional BI | Self-Service BI |
|---|---|---|
| Data Access | Requires skilled personnel to handle data access | Business users can run their own queries |
| Customization | Highly customizable applications | Limited to features supported by the platform |
| User Independence | Dependent on BI team for insights | Empowers users to analyze data independently |
| Control Mechanism | Centralized, IT-driven | Decentralized, user-driven |
You notice a clear difference in speed and flexibility when you use self-service BI. Traditional BI systems often require long review and approval cycles. You wait for IT to process requests, which slows down your ability to act on insights. Self-service BI lets you perform ad hoc analysis and get answers quickly.
Here is a table comparing analysis speed:
| BI Feature | Traditional BI | Self-Service BI |
|---|---|---|
| Analysis Speed | Slow | Fast |
Self-service BI gives you more autonomy. You control how and when you analyze data. You can adjust dashboards, filter information, and explore trends on your own. This flexibility helps you respond to changes in your business environment.
| Aspect | Self-Service BI | Governed BI |
|---|---|---|
| Target User | Everyone, especially non-technical | IT, analysts, data stewards |
| Control | Decentralized, user-driven | Centralized, IT-driven |
| Speed | Fast (ad hoc analysis) | Slower (review, approval needed) |
| Flexibility | High | Medium to low |
Self-service BI empowers you to make faster decisions and adapt quickly. You do not rely on IT for every step. You use business intelligence and data analytics to drive your organization forward with confidence.

You gain speed and independence when you use self-service BI tools. You no longer wait for IT teams to deliver reports or insights. You access data directly and generate results immediately. This shift helps you respond quickly to new opportunities and challenges. You can update dashboards, analyze trends, and customize reports in minutes. You make decisions based on real-time insights, not outdated information.
Self-service BI gives you the ability to explore data and create business insights on your own. You use self-service analytics to spot patterns and adjust strategies in real time. You drive improved decision-making across your organization.
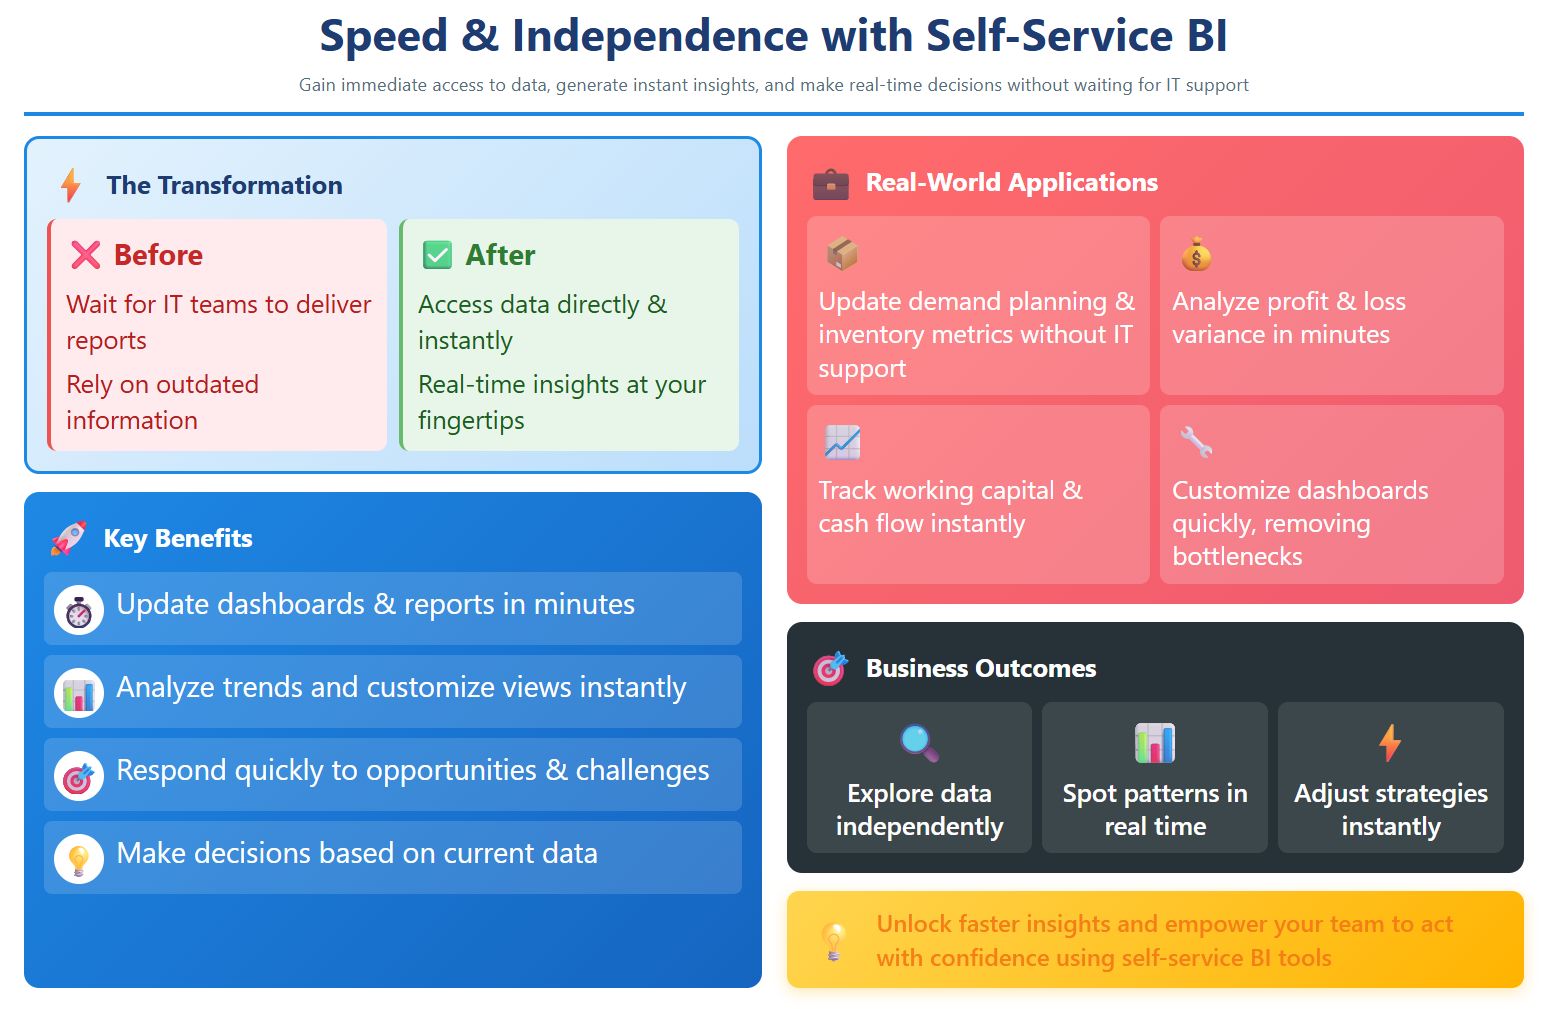
Tip: When you use self-service BI tools, you unlock faster insights and empower your team to act with confidence.
You experience a major reduction in IT dependency with self-service BI. You handle routine reporting and analysis tasks yourself. You use self-service BI tools to access, analyze, and visualize data without waiting for IT assistance. This change leads to a significant decrease in IT support requests. Many organizations see a reduction in report request volume by 60-80%.
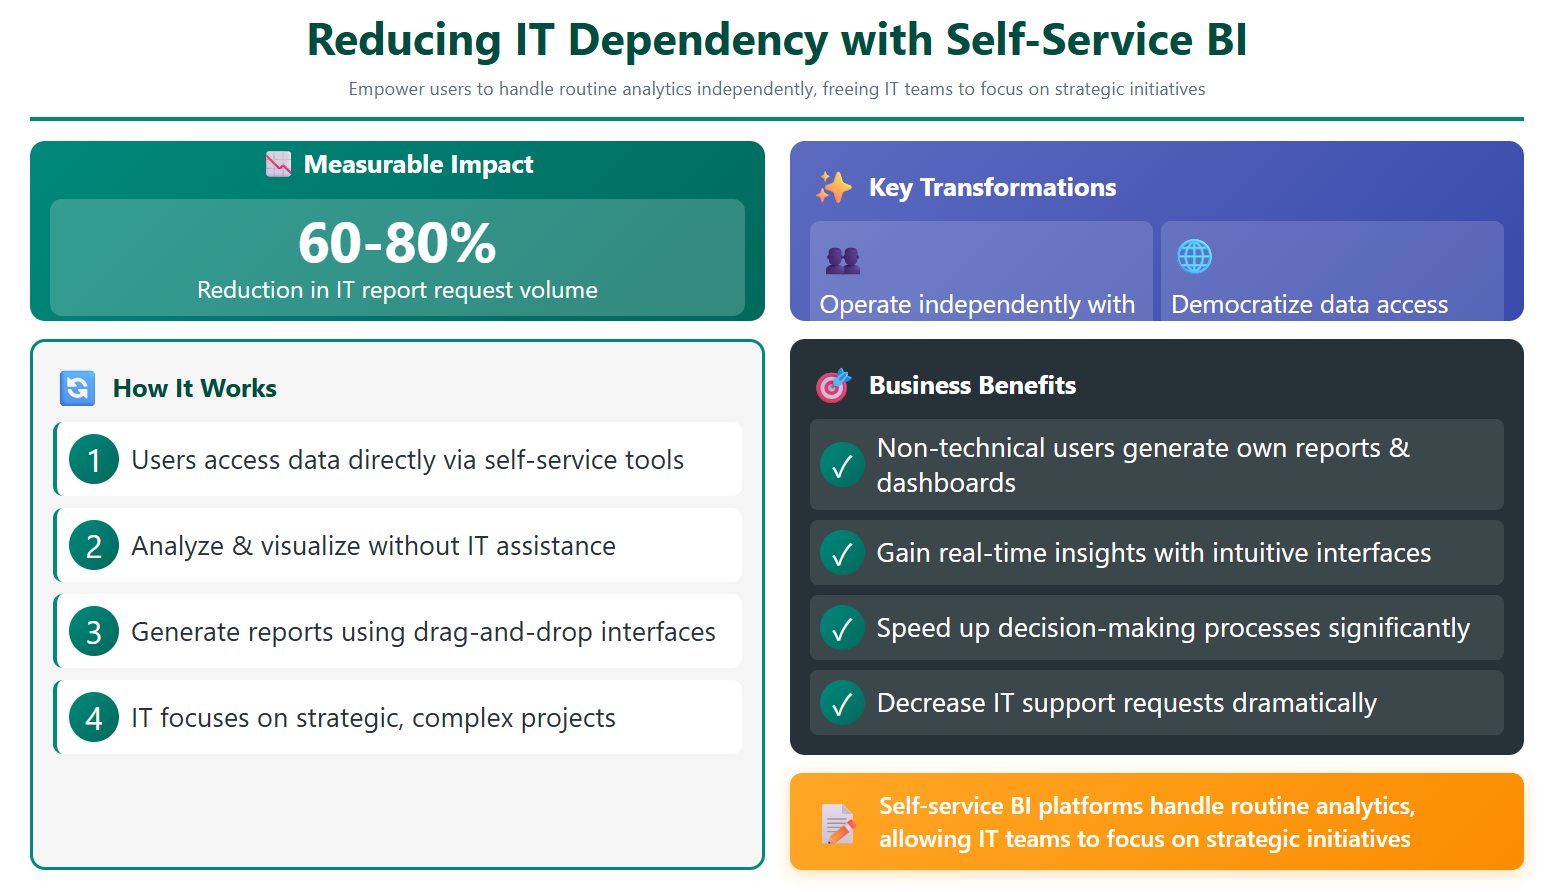
Self-service BI capabilities allow non-technical users to generate their own reports and dashboards. You use intuitive drag-and-drop dashboards to gain real-time insights. You rely less on IT and more on your own self-service tools. This independence speeds up the decision-making process and frees IT teams to focus on more complex projects.
Note: Self-service BI platforms help you handle routine analytics, so IT teams can focus on strategic initiatives.
You help build a data-driven culture when you use self-service BI tools. You encourage everyone in your organization to engage with data and analytics. You foster curiosity and exploration by giving users access to self-service data platforms. You rely on data democratization to make information available to all departments.
| Evidence Point | Description |
|---|---|
| Empowerment of Users | You access and analyze data independently, which fosters curiosity. |
| Reduction of IT Reliance | You make quicker decisions without waiting for IT support. |
| User-Friendly Interfaces | You use easy-to-navigate self-service BI tools for data integration. |
| Increased Engagement | You encourage more employees to interact with data and make informed choices. |
| Governance and Trust | You build trust in data through proper governance and reliable insights. |
Self-service BI tools transform your organization. You move away from gut instincts and rely on data-driven decisions. You use self-service capabilities to create dashboards, share insights, and collaborate across teams. You build a culture where everyone values data analytics and business intelligence. You make improved decision-making a core part of your daily operations.
Data democratization is essential for a sustainable data-driven culture. You empower users and encourage data-driven decisions at every level.
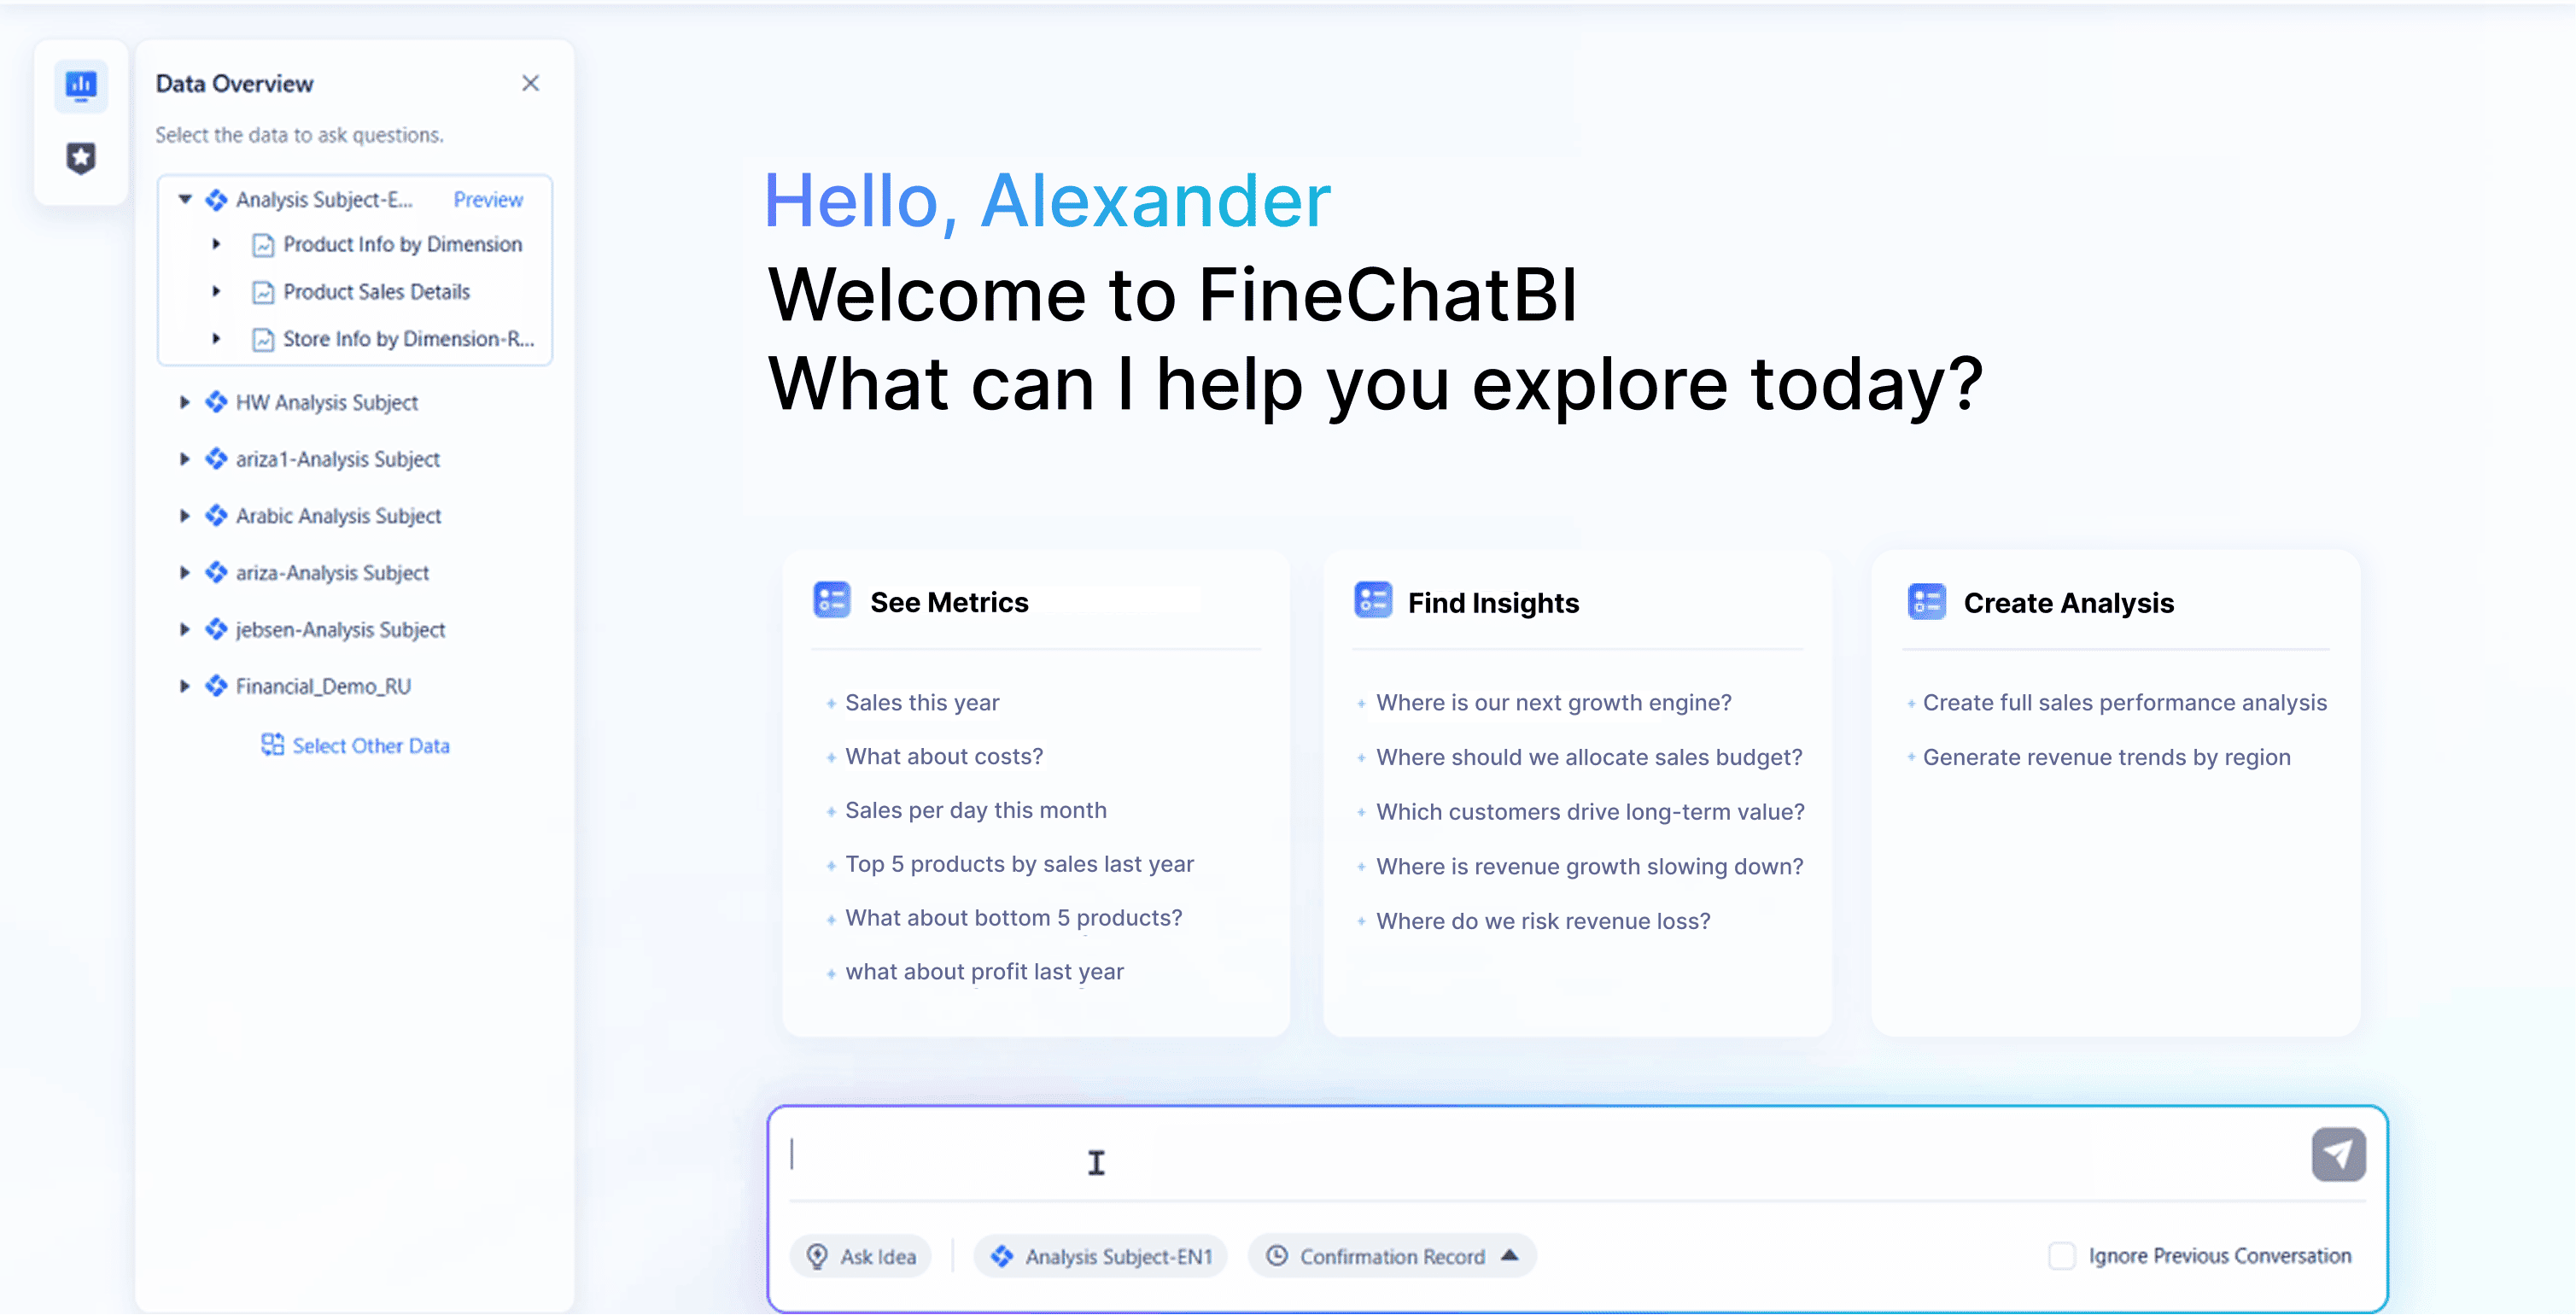
You can unlock powerful self-service bi features with FineBI. The platform gives you the tools to create dashboards, analyze data, and share insights without technical barriers. You work with an interface that lets you drag and drop charts, filter information, and build reports that fit your needs. FineBI uses AI to help you ask questions in plain language and discover hidden trends. You control your own data exploration and can collaborate with your team easily.
Here is a table that shows the core capabilities you get with FineBI:
| Feature | Description |
|---|---|
| Self-Service Dashboards | You create and modify dashboards independently, enhancing your ability to visualize data. |
| AI-Assisted Insights | You use AI to ask questions in natural language and uncover hidden insights. |
| Data Governance | You maintain consistent data management and permissions across teams, keeping control for IT. |
| Flexible Data Exploration | You explore data in different ways, which helps you analyze information deeply. |
| Data Collaboration and Sharing | You share insights and work together on data analysis with your team. |
| Visual Data Analysis | You use intuitive visualizations to spot data issues quickly. |
| Self-Service Dataset | You filter, sort, and merge data to create the exact view you need. |
Tip: FineBI makes self-service bi accessible for everyone in your organization. You do not need coding skills to build dashboards or analyze data.


Macao Water’s story shows how self-service bi empowers you to solve business problems and improve efficiency.
You gain measurable business value when you adopt self-service bi with FineBI. Organizations report better decision-making because they see data clearly and analyze it quickly. You can reduce costs by optimizing budgets and streamlining business tasks. FineBI helps you manage your business more effectively, allowing you to respond faster to new challenges.
Here is a table that summarizes the business value organizations realize with FineBI:
| Evidence Type | Description |
|---|---|
| Improved Decision-Making | You enhance your decision-making with better data presentation and analytics. |
| Cost Reduction | You save money by optimizing budgets and using data-driven business processes. |
| Enhanced Business Manageability | You manage your business more efficiently and respond quickly to problems. |
Note: When you use self-service bi, you empower your team to act on data and drive your organization forward.
You see how FineBI brings practical benefits to your daily work. You create dashboards, analyze data, and collaborate with your team. You experience real improvements in efficiency, cost savings, and decision-making. FineBI helps you build a data-driven organization where everyone can use self-service analytics to achieve better results.

When you start using self-service bi, you may face several challenges. Many organizations report issues with data governance, technical integration, user skill gaps, and cultural resistance. You can see these obstacles in the table below:
| Challenge Type | Description |
|---|---|
| Data Governance Issues | Concerns about inconsistencies in data interpretation and potential security risks. |
| Technical Challenges | Difficulties in integrating self-service bi tools with existing systems and managing performance. |
| User Skillset Limitations | Many users lack the necessary skills to effectively utilize self-service bi tools. |
| Cultural Resistance | Employees may resist changes from traditional BI methods, complicating collaboration efforts. |
You can overcome resistance by involving end-users early, designing intuitive dashboards, and providing targeted training. Celebrate early adopters and create a feedback loop to keep dashboards relevant.
You must protect your data and maintain trust in your analytics. Establish a data governance framework to manage data throughout its lifecycle. Implement security measures such as zero trust architecture, data encryption, and tokenization. Control data access based on user roles and regularly monitor activity. Maintain high data quality and catalog data with clear standards for security and accessibility.
Tip: Approach data governance as an organization-wide effort. Define policies and roles to ensure everyone understands their responsibilities.
You can maximize user empowerment and success with self-service bi by following proven steps. The table below outlines what successful organizations do:
| Step Number | Step Description |
|---|---|
| 1 | Define clear objectives |
| 2 | Assess your data landscape |
| 3 | Choose the right tools |
| 4 | Establish data governance |
| 5 | Data preparation |
| 6 | Training & onboarding |
| 7 | Pilot implementation |
| 8 | Feedback loop |
| 9 | Promote collaboration |
| 10 | Monitor & adjust |
| 11 | Review licensing & costs periodically |
| 12 | Stay updated |
| 13 | Establish a center of excellence |
"Even the most intuitive self-service bi tools can fail if users don’t feel comfortable using them. Ongoing training and change management are key to building confidence and ensuring widespread adoption across teams."
You should provide continuous training and celebrate power users. Encourage collaboration and keep improving your self-service bi environment. When you follow these best practices, you help your organization unlock the full value of data and self-service bi.
You transform decision-making when you adopt self-service bi. FineBI from FanRuan gives you the tools to access, analyze, and share data across your organization.

Transitioning to self-service BI reshapes decision-making, offering faster responses and deeper analytics for everyone.
You build a data-driven culture by encouraging employees to use data in daily decisions.
| Level | State of data culture |
|---|---|
| 300: Defined | Specific goals are established for advancing the data culture. Learnings are shared and effective practices are replicated. |
Consider self-service analytics as a strategic investment. Explore solutions that offer easy access to data, user-friendly tools, and fast deployment options.
Discover the Best Free BI Tools for Your Business in 2025
Business Intelligence vs Business Analytics for Modern Enterprises
Why Your Organization Can't Thrive Without BI Tools in Malaysia
Unlocking Success with Data Warehousing and Business Intelligence
10 Business Intelligence Jobs Hiring Now That You Should Know

The Author
Lewis
Senior Data Analyst at FanRuan
Related Articles

KPI Marketing Report for Enterprise Stakeholders: What to Track, How to Structure the Dashboard, and When to Report
A kpi $1 is not just a dashboard for the marketing team. In an enterprise environment, it is a decision support system that helps executives, finance leaders, sales stakeholders, and regional operators understand whether
Yida Yin
May 27, 2026

Record to Report Process Transformation in 7 Steps for a Faster, More Controlled Close
$1 transformation is the disciplined redesign of the financial close cycle to make period end reporting faster, more accurate, and easier to control. For finance leaders, controllers, shared services managers, and CIOs,
Yida Yin
May 26, 2026

How Financial Analytics Works: From Raw Finance Data to Executive Decisions
$1 is no longer just a support function for month end reporting. In modern enterprises, it is the operating system behind smarter budgeting, faster decision making, stronger cash management, and better risk control. When
Yida Yin
May 21, 2026


