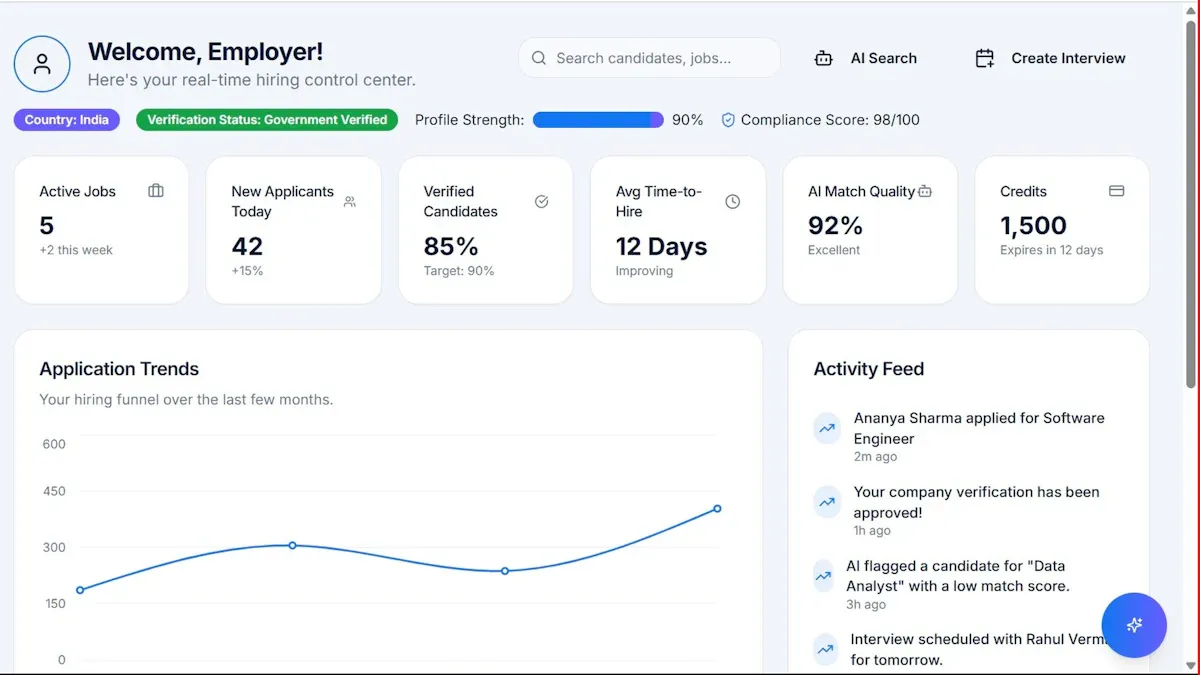
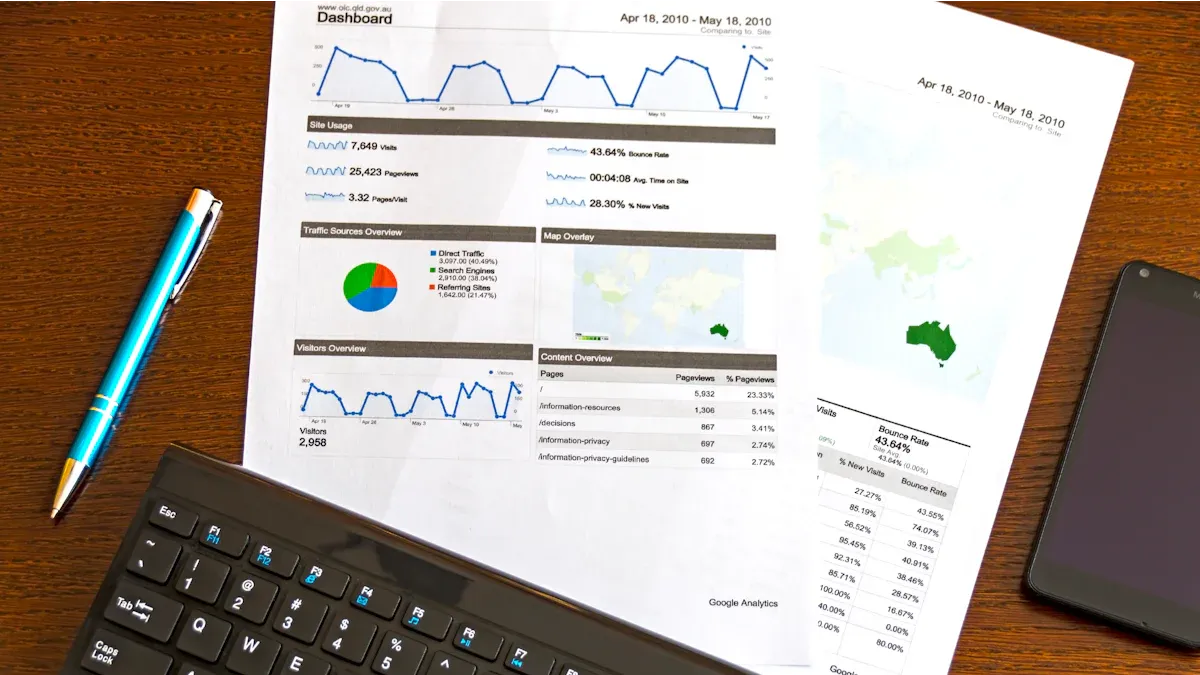
A recruitment dashboard gives you a visual summary of your entire hiring process in one place. It pulls together data from different sources, helping you track every stage of recruitment and make smarter decisions. You see trends, spot bottlenecks, and measure results quickly.
Over the past five years, the shift toward data-driven recruitment has been clear. Many organizations now use AI tools to improve hiring. For example:
Year
Percentage of Organizations Using AI in Recruiting
2024
26%
2025
43%
You need real-time insights to keep up. FineBIlets you centralize, visualize, and act on recruitment data, making your dashboard a powerful tool for modern hiring.
Recruitment Dashboard Overview
What is a Recruitment Dashboard
A recruitment dashboard gives you a clear, visual interface to monitor your hiring process. You see all your important metrics, KPIs, and goals in one place. This tool transforms raw data into helpful insights, making it easier for you to understand how well your company attracts new talent. Leading HR technology sources describe a recruitment dashboard as a centralized platform that tracks job applicants, costs, speed, and the entire talent acquisition process.
Source
Definition
Netsuite
A recruiting dashboard is a visual interface of metrics, KPIs, benchmarks, and goals designed to provide a snapshot of how well a company’s efforts to attract new talent are going. It centralizes data-derived metrics related to job applicants, costs, speed, and talent acquisition processes, allowing HR teams to improve candidate sourcing and reduce acquisition costs.
Wellhub
A recruiting dashboard is a tool that provides real-time visibility into the hiring process, transforming raw recruitment data into helpful insights for better recruitment decisions.
You use a recruitment dashboard to bring together information from different systems. This helps you avoid manual data searches and gives you instant access to the numbers that matter most. You can track how many candidates apply, how long each step takes, and where you might lose strong applicants. This kind of dashboard supports your hiring team by making complex data easy to understand and act on.
Core Purpose in Recruitment
The main purpose of a recruitment dashboard is to make your hiring process more efficient and transparent. You get a single view of all your key metrics, which helps you make faster and better decisions. Here are some ways a recruitment dashboard supports your work:
You access data instantly, so you do not waste time searching through spreadsheets.
You track important KPIs, such as time-to-hire and cost-per-hire, to measure your progress.
You share a common view of recruitment data with your team, which improves communication and alignment.
A recruitment dashboard also helps you spot problems early. For example, you can see if candidates drop out at a certain stage or if interviews take too long to schedule. This lets you fix issues before they slow down your hiring. You can also compare the performance of different recruiters and see which sourcing channels bring in the best candidates.
"An effective recruiting dashboard is an indispensable tool for anyone working in recruitment today, critical for hiring faster and cheaper without compromising on talent."
You use a recruitment dashboard to track candidate progress, identify bottlenecks, and visualize recruiter performance. This helps you understand where candidates get stuck and how you can improve the process. When you see how long candidates spend at each stage, you can reduce drop-off rates and create a better experience for applicants. You also get the ability to filter data by different criteria, which gives you tailored insights for each role or department.
Benefit
Description
Real-time visibility
Dashboards provide immediate insights into applications, interviews, and hires, aiding swift decisions.
Improved collaboration
Different stakeholders can access a shared view of data, promoting transparency and alignment.
Identification of bottlenecks
Dashboards highlight inefficiencies in the hiring process, allowing for targeted improvements.
Enhanced candidate experience
Tracking feedback ensures a positive experience for applicants, increasing acceptance rates.
Compliance support
Facilitates tracking of diversity metrics and ensures hiring steps are completed properly.
You rely on a recruitment dashboard to support compliance, track diversity metrics, and ensure every hiring step is completed correctly. This makes your process not only faster but also more reliable and fair.
FineBI for Recruitment Dashboards
Once you understand the value of a recruitment dashboard, you need the right tool to build and manage it. FineBI stands out as a powerful solution for creating an effective recruitment dashboard. You do not need advanced technical skills to use FineBI. Its self-service analytics let you connect to your data sources and start analyzing right away.
FineBI offers several features that make your recruitment dashboard more useful:
Self-Service Analytics: You can conduct your own analysis with a simple drag-and-drop interface. This means you do not have to wait for IT support.
Interactive Dashboards: You explore data dynamically and drill down into details for deeper insights.
Data Visualization: You choose from a wide range of charts and visuals to communicate your findings clearly.
Real-Time Data Analysis: You analyze data as soon as it is available, which helps you respond quickly to changes in your recruitment process.
With FineBI, you centralize all your recruitment data, visualize trends, and act on insights in real time. This makes your recruitment dashboard a central hub for smarter, faster hiring decisions.
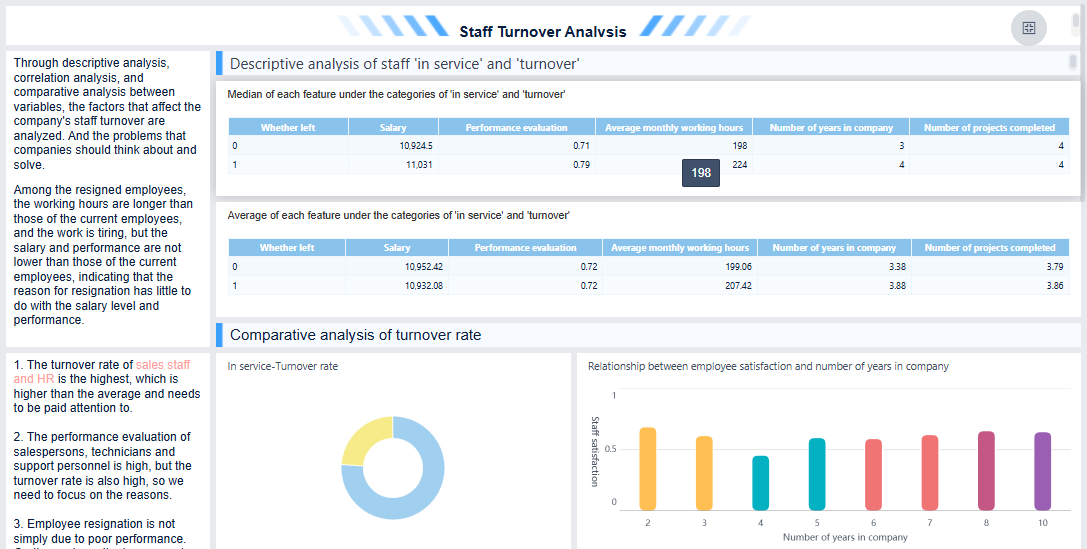
FineBI'sStaff Turnover Analysis Dashboard - Click To Engage
A recruitment dashboard transforms how you manage recruiting by making your workflow faster and more organized. You can quickly spot where candidates get stuck and address these issues before they slow down your hiring process. Many organizations report that dashboards help automate repetitive tasks, such as sending interview reminders and updating candidate statuses. This automation frees you to focus on engaging with top talent instead of handling manual tasks.
Improvement Aspect
Description
Identification of Bottlenecks
Dashboards help pinpoint where candidates are getting stuck in the hiring process.
Automation of Tasks
Repetitive tasks are automated, freeing up recruiters to focus on engaging with candidates.
Real-time Data Utilization
Access to real-time data allows for quicker decision-making and adjustments in the hiring process.
You can also use a recruiting dashboard to automate resume screening, schedule interviews, and manage candidate relationships. These features reduce the time it takes to move candidates through each stage, helping you secure top talent before your competitors do.
Communication and Collaboration
A recruitment dashboard improves communication between recruiters and hiring managers. You get instant access to reports and performance metrics, which means you do not need to gather data manually. This visibility helps your team align on goals and make informed decisions together.
Feature
Benefit
Automated Reporting
Eliminates manual data gathering, providing instant visibility for better communication.
Performance Optimization
Identifies top channels and areas for improvement, facilitating strategic discussions.
AI Recommendations
Provides actionable steps based on data analysis, enhancing decision-making between teams.
Real-time Dashboards
Offers clear visibility into hiring metrics, improving alignment on recruitment goals.
Business-value Metrics
Tracks critical KPIs, allowing for informed discussions on hiring effectiveness.
Recruitment dashboards also support collaboration across distributed teams. You can share a single view of all recruitment metrics, making it easier for everyone to stay updated and work toward common objectives.
When you use FineBIfor yourrecruitment dashboard, you gain access to self-service analytics and real-time data. This empowers you to make decisions based on facts, not guesswork. You can analyze historical data to identify traits that lead to successful hires and standardize evaluations to reduce bias.
Research shows that using analytics in recruiting leads tobetter hiring outcomes. For example, companies have seen up to a 30% reduction in time to hire and a 40% reduction in cost per hire. FineBI’s interactive dashboards let you track key metrics, visualize trends, and set up alerts for important changes. This helps you attract and retain the best talent while continuously improving your recruiting strategy.
You need to track candidate pipeline metrics to understand how applicants move through each stage of your recruitment process. These metrics help you identify where candidates drop off and where you can improve efficiency. Arecruitment metrics dashboardgives you instant access to these numbers, allowing you to monitor trends and make proactive adjustments. Organizations use these metrics to spot delays, such as slow screening or interview scheduling, and then streamline those steps. Continuous monitoring helps you attract high-quality talent and reduce the time it takes to fill vacancies.
Metric
What it Measures
Why it Matters
Goal
Quality of hires by channel
Performance or retention rate of hires from different channels
Helps allocate time and budget to effective sourcing channels
Justify more investment in successful sourcing channels like referrals.
Offer acceptance rate
Percentage of candidates accepting job offers
Indicates potential issues with compensation or candidate experience
Aim for 85–90% acceptance by improving candidate engagement throughout the process.
Time to fill
Total time from role opening to accepted offer
Valuable for assessing recruitment efficiency
Automate tasks to reduce this time metric.
Pipeline speed
Speed at which candidates move through the recruitment process
Identifies inefficiencies in the recruitment pipeline
Use analytics to find and address bottlenecks in the process.
Cost per hire
Average cost to fill a role
Measures sourcing ROI and helps manage recruitment budgets
Lower costs while maintaining candidate quality through efficient workflows.
Candidate satisfaction score
Satisfaction level of candidates with the recruitment process
Impacts brand reputation and offer acceptance rates
Gather feedback to refine the recruitment process.
Sourcing channel efficiency
Ratio of successful hires to total candidates from each channel
Reveals effectiveness of different sourcing channels
Optimize sourcing mix based on successful hire ratios.
Source of Hire and Channel Effectiveness
You should analyze the source of hire to see where your best candidates come from. A recruitment metrics dashboard tracks the origin of successful hires, helping you allocate resources to the most effective channels. For example, job boards may bring in many applicants, but referrals often result in higher-quality hires. By comparing channel effectiveness, you can focus your recruiting efforts on sources that deliver strong talent.
Source Type
Quality of Candidates
Volume of Applicants
Success Rate
Job Boards
Low
High
Low
Employee Referrals
High
Low
High
Social Media
Medium
Medium
Medium
Recruitment Agencies
Medium
Low
Medium
Recruitment dashboards help youoptimize your sourcing strategyand save costs by investing in channels that yield the best results.
Time-to-Fill and Cost-per-Hire
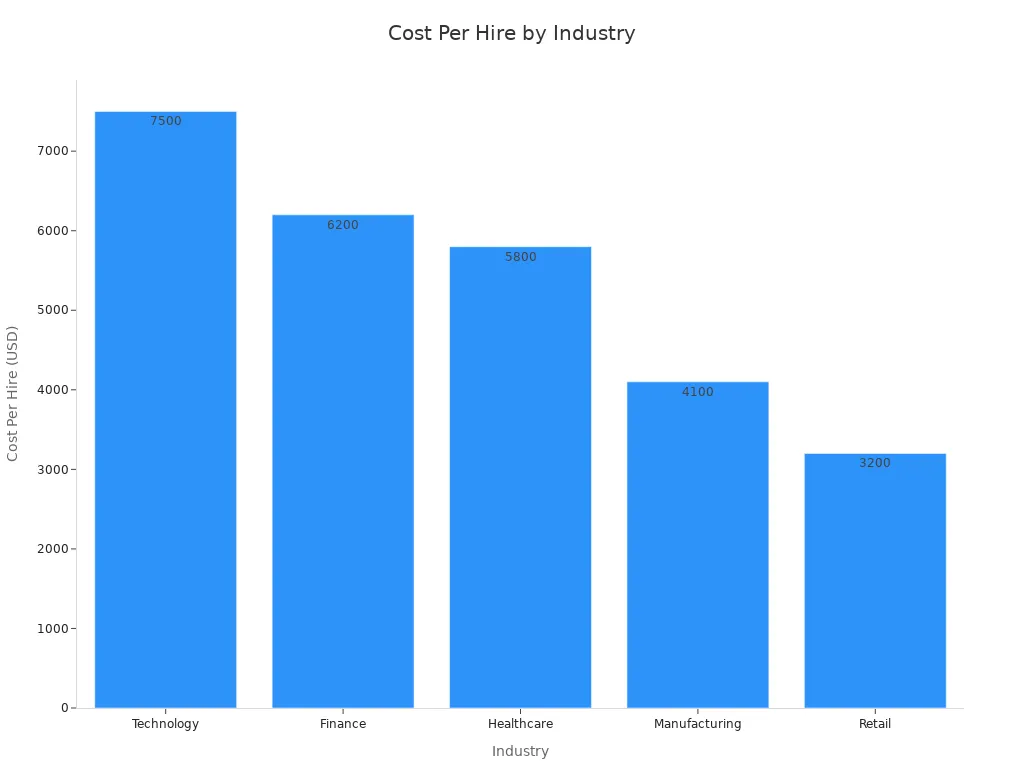
Tracking time-to-fill and cost-per-hire in your recruitment metrics dashboard is essential for managing budgets and improving efficiency. You see how long it takes to fill roles and how much each hire costs. These metrics help you justify investments and refine your recruiting practices.
Industry
Cost Per Hire
Technology
$7,500
Finance
$6,200
Healthcare
$5,800
Manufacturing
$4,100
Retail
$3,200
Quick approvals and efficient workflows can reduce both time-to-fill and cost-per-hire, improving overall recruitment performance.
Quality of Hire and Retention
You measure quality of hire and retention to see how well new employees perform and stay with your company. Recruitment metrics dashboards track pre-hire indicators like skill tests and interview scores, as well as post-hire metrics such as retention rates and performance reviews. Early turnover often signals issues in your hiring process. Track retention at intervals like 30, 90, and 365 days to assess onboarding and long-term fit.
Early turnover often signals quality issues in the hiring process. Track retention at key intervals: 30-day retention (onboarding effectiveness), 90-day retention (role fit assessment), and 12-month retention (long-term value).
Companies that optimize their hiring process with a recruitment metrics dashboard can see up to a 70% improvement in quality of hire. FineBIenables you to visualize these metrics, set alerts for anomalies, and compare outcomes across recruiters and channels, helping you build a stronger talent pipeline.
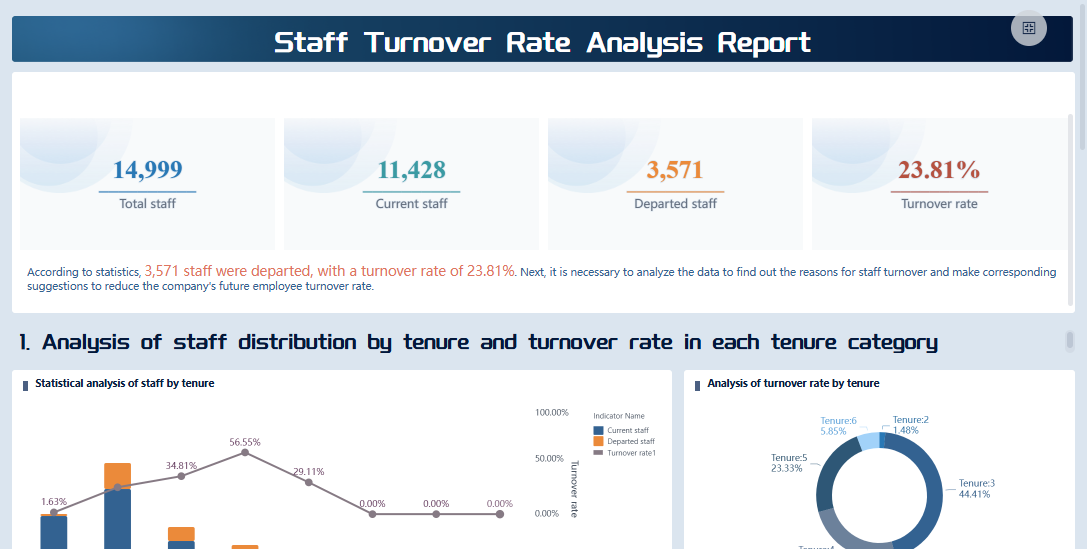
FineBI'sStaff Turnover Rate Analysis Dashboard - Click To Engage
Improving Recruitment Outcomes with FineBI's Recruitment Dashboard
Identifying Bottlenecks
You can use a dashboard to quickly spot bottlenecks in your recruiting process. Common issues often include slow response times after candidates apply, poor communication between HR and hiring managers, lengthy interview cycles, and inefficient tools that create duplicate work or missing records. When you track these problems, you can address them before they impact your ability to attract top talent.
A dashboard helps youmonitor key metrics that reveal where your process slows down. For example, you can track the number of applicants generated, conversion rates at each stage, and the average time to hire. The table below shows how these metrics support your recruiting efforts:
Metric Type
Description
Number of applicants
Understand the volume and quality of applicants from different sources.
Conversion rates
Track how candidates move through each stage and find areas for improvement.
Average time to hire/fill
Measure the efficiency of your recruiting process at both team and individual levels.
By using these insights, you can make targeted changes that keep your hiring process efficient and competitive.
Continuous Improvement in Recruitment
You need to focus on continuous improvement to stay ahead in recruiting. A dashboard supports this by helping you analyze time-to-fill, candidate drop-off points, and process efficiency. You can identify areas of opportunity, optimize workflows, and makedata-driven decisions that improve your hiring strategy.
Consider these methods for ongoing improvement:
Analyze time-to-fill to reduce the duration needed to fill open positions.
Review where candidates drop out to improve the candidate experience.
Monitor interview scheduling and feedback to enhance process efficiency.
Use metrics to evaluate and refine your recruiting strategies.
Tracking these metrics over time leads to better outcomes. For example, you can measure average time to fill, time to hire, source of hire, diversity recruiting, attrition rate, quality of hire, applicants per opening, and cost per hire. Each metric gives you a clear view of your recruiting performance and helps you adjust your approach for better results.
FineBI gives you advanced analytics and collaboration tools that make your dashboard even more powerful. You can set up real-time alerts for important changes, such as a sudden drop in applicants or a spike in interview delays. These alerts help you respond quickly and keep your recruiting process on track.
You can also customize your dashboard to focus on the metrics that matter most to your team. FineBIallows you to share dashboards securely, so everyone involved in recruiting can access the latest data and insights. This collaboration ensures that your team works together to attract and retain the best talent.
Tip: Use FineBI’s interactive features to drill down into specific stages of your recruiting process. This helps you uncover hidden trends and make smarter decisions.
With FineBI, you turn your recruitment data into actionable insights that drive continuous improvement and help you build a stronger talent pipeline.
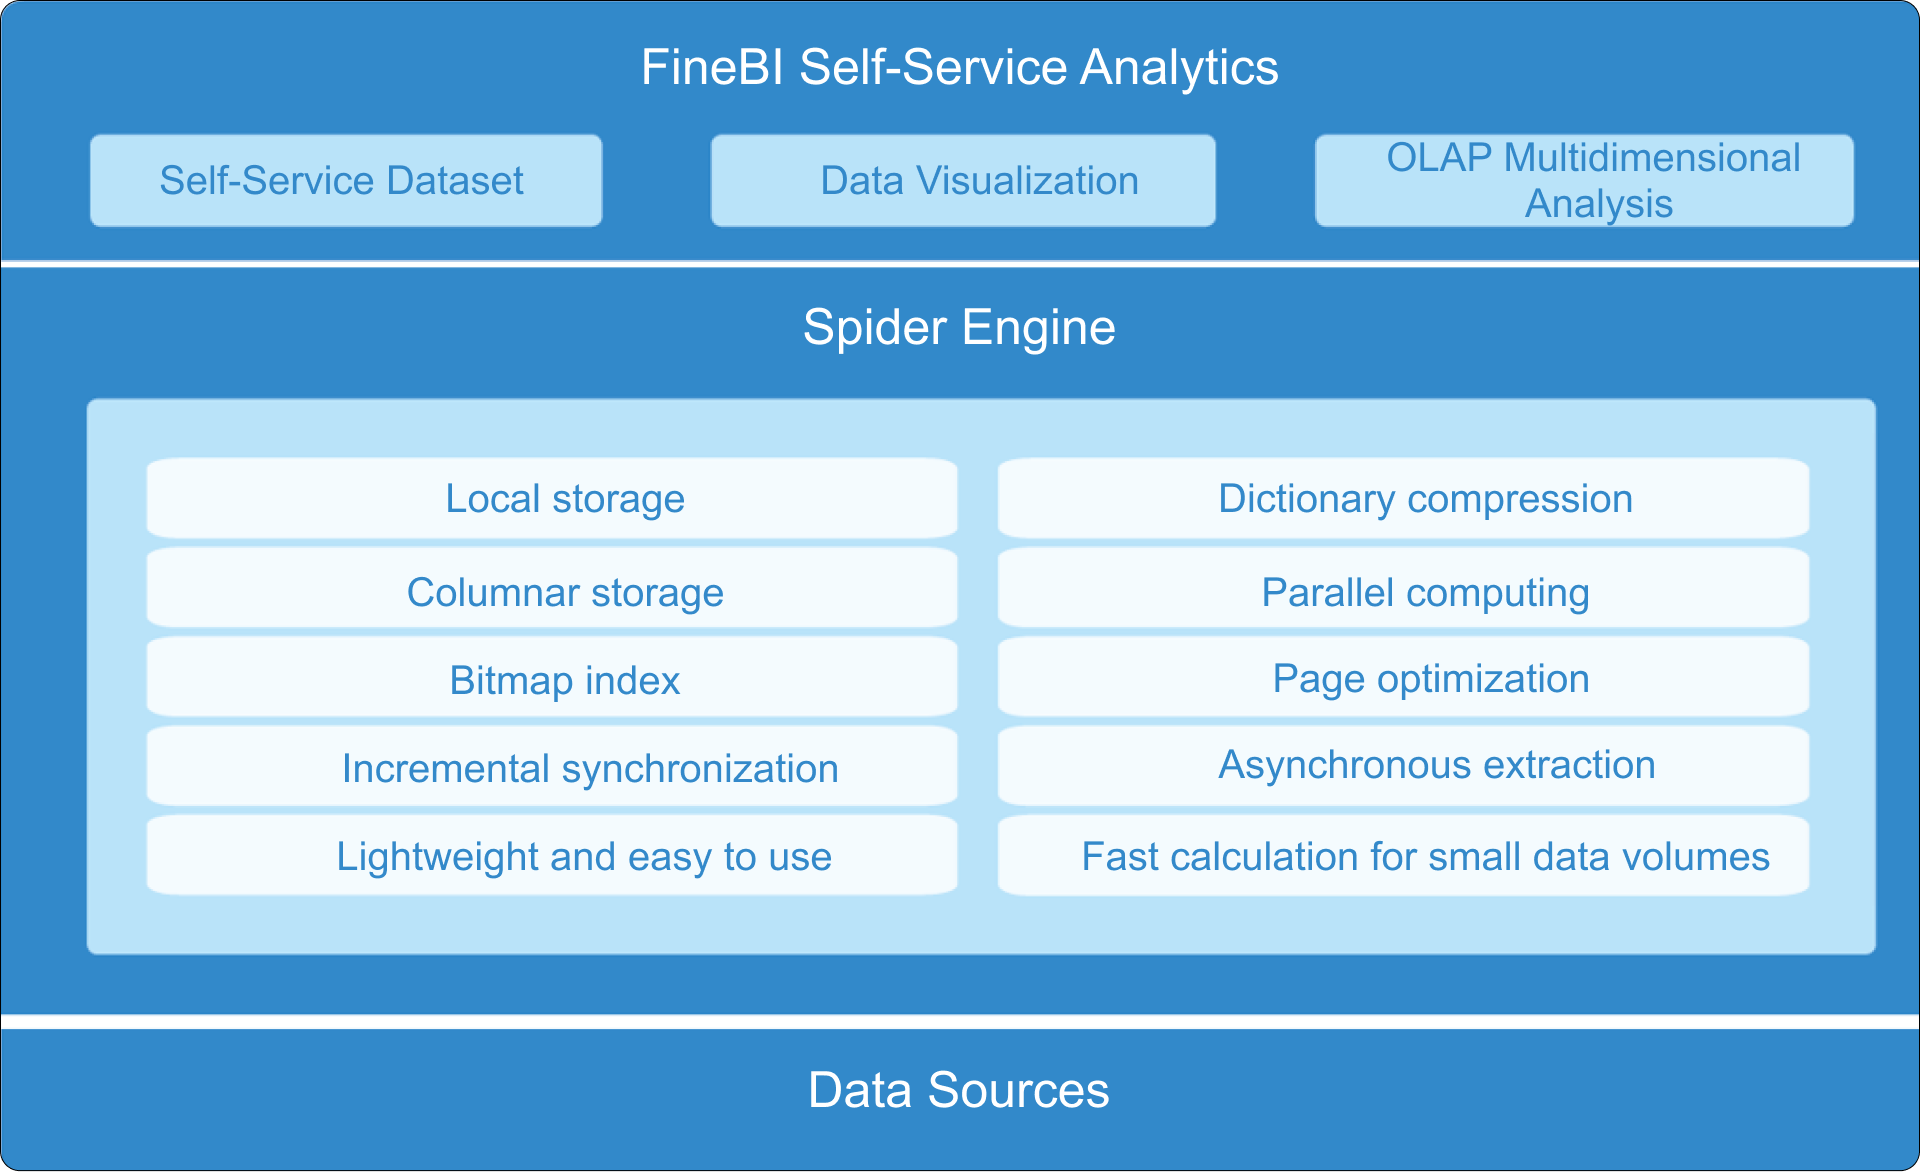
FineBI'sMultiple Built-in Charts For Visualization
You gain a clear advantage when you use a dashboard to manage recruitment. Tracking the right metrics helps you improve efficiency and candidate quality. FineBIgives you tools to analyze data and make better decisions. Many organizations report faster hiring and stronger teams after adopting solutions like FineBI. See how these metrics reflect real improvements:
Metric
Description
Time-to-fill
Shows how quickly you fill open positions.
Candidate Quality
Measures how well new hires perform after joining your company.
Offer Acceptance Rate
Tracks how many candidates accept job offers.
Consider implementing a dashboard to support data-driven hiring and build a more effective recruitment process.
Access a wealth of case studies, industry insights, and solution guides to accelerate digital transformation.
FAQ
What is a recruitment dashboard?
A recruitment dashboard is a visual tool that helps you track and analyze your hiring process. You see key metrics, trends, and bottlenecks in one place. This makes it easier to improve your recruitment strategy.
Why should you use a recruitment dashboard?
You should use a recruitment dashboard to save time and make better decisions. It gives you real-time insights into your hiring process. You can quickly spot problems and measure the success of your recruitment efforts.
What data sources can you connect to a recruitment dashboard?
You can connect your recruitment dashboard to many data sources. These include applicant tracking systems, HR databases, spreadsheets, and cloud platforms. FineBI supports over 60 connectors for easy integration.
How does a recruitment dashboard improve team collaboration?
A recruitment dashboard lets your team share the same data view. Everyone stays updated on progress and goals. This improves communication and helps your team work together more effectively.
Can you customize a recruitment dashboard for your needs?
Yes, you can customize a recruitment dashboard. FineBI allows you to choose the metrics, visuals, and layout that fit your hiring process. You get a dashboard that matches your unique requirements.