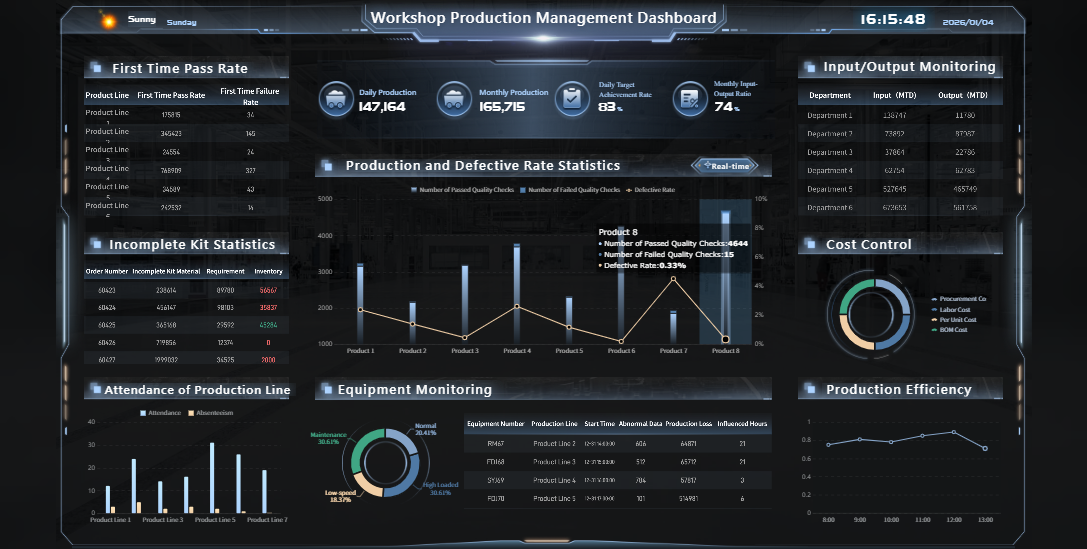
An IoT dashboard for real-time monitoring is a digital interface that displays live data collected from connected devices, sensors, or machines. You use this tool to track operations, spot issues, and make informed decisions instantly. The dashboard brings together data streams, visualizes key metrics, and helps you respond quickly to changes in your environment.
Clear objectives, efficient data integration, and user-friendly design drive the success of your IoT dashboard. Many organizations in manufacturing and smart factory sectors rely on real-time IoT dashboards to boost efficiency. In fact, 66% of these businesses already use dashboards for monitoring, showing their critical role in modern operations.
You can build a custom solution using a robust tool like FineReport. By focusing on practical steps, you unlock real business benefits and set your company up for success.
Define IoT Dashboard Objectives
What is an IoT dashboard for real-time monitoring? This is a digital platform that collects, processes, and displays live data from connected devices, sensors, or machines. You use it to track operations, monitor equipment, and respond to changes as they happen. The main goal is to give you instant visibility into your processes so you can make better decisions.
An IoT dashboard for real-time monitoring helps you see key metrics, spot trends, and receive alerts about important events. You can access this information from your computer or mobile device, making it easier to manage your operations from anywhere. The dashboard acts as your command center, bringing together all the data you need in one place.
Identify Key Metrics and KPIs
You should start by deciding which metrics matter most for your business. In industrial settings, common KPIs include:
KPI
Description
OEE
Measures production efficiency.
Production volume
Tracks total output over time.
Equipment downtime
Shows how long machines are not working.
Idle time
Measures when equipment is available but not running.
Run-time hours
Counts hours equipment is active.
MTBF
Mean Time Between Failures, shows reliability.
Percentage planned vs emergency maintenance
Compares scheduled to unscheduled maintenance.
Downtime in proportion to operating time
Ratio of downtime to total operating time.
Tracking these KPIs on your iot dashboard helps you monitor performance and take action quickly.
Clarify User Roles and Use Cases
You need to know who will use the iot dashboard and why. Each user role has different needs:
Focus on key metrics that matter to each role.
Keep the interface simple so users can make fast decisions.
Make sure real-time data and alerts reach the right people.
For example, a plant manager may want to see overall equipment effectiveness, while a technician may need alerts about machine failures.
Set Real-Time Monitoring Goals
Set clear goals for your iot dashboard. Common objectives include:
Improving efficiency and productivity by making quick adjustments.
Using predictive maintenance to reduce downtime.
Enhancing product quality by tracking production parameters.
Reducing costs by minimizing waste and delays.
Supporting data-driven decisions with real-time insights.
Many manufacturing facilities use real-time monitoring to boost productivity, improve quality control, and enable faster decision-making. When you define your goals, you set the foundation for a successful dashboard project.
What is an iot dashboard for real-time monitoring? This is a digital platform that collects, processes, and displays live data from connected devices and sensors. You use it to track device performance, monitor operations, and respond to changes as they happen. The iot dashboard for real-time monitoring gives you instant visibility into your systems, helping you make better decisions and improve efficiency.
You can bring together data from many iot devices and sources into one dashboard. This process involves connecting hardware, integrating software, and ensuring data flows smoothly. When you set up your system, you create a single view of your operations, which is essential for industries like manufacturing and smart factories.
Connect IoT Devices and Data Sources
You should start by identifying the key data points you need to monitor. Choose compatible iot devices that can capture this information. Develop or update your software to support these devices, often by creating APIs or middleware. Many organizations begin with a pilot project to test the setup and address any issues before scaling up. Always prioritize data security by using encryption and access controls. Regularly update your systems to keep everything running smoothly and efficiently.
Common challenges include handling large volumes of data, dealing with different communication standards, and making sure your system can scale as you add more devices. Legacy systems may also struggle with real-time data processing, so plan for upgrades if needed.
Use FineReport for Seamless Integration
FineReport supports multi-source data integration, including databases, files, and cloud services. You can use its drag-and-drop interface and built-in data connectors to quickly set up your dashboard. This makes it easy to combine data from different sources without complex coding. In manufacturing and smart factory scenarios, FineReport helps you connect equipment, production lines, and quality control systems into one unified platform. You can monitor device performance, track production, and analyze trends in real time.
To keep your iot dashboard reliable, you need to manage data volume and ensure real-time processing. Use efficient storage solutions and balance processing between edge devices and central systems. Make sure data formats are consistent across all devices. Integrate new systems with your existing infrastructure for smooth operation.
Tip: Set up alert thresholds for downtime, use clear visualizations, and implement user roles to control access. Provide options to filter, sort, and export data for deeper analysis.
Best Practice
Description
Data Consistency Management
Keep data formats uniform for quality and reliability.
Real-Time Parameter Adjustment
Allow users to change settings directly from the dashboard for quick action.
Access Control
Assign permissions so only authorized users can view or change sensitive information.
Highlight Key Data
Use visual cues to draw attention to important information that needs immediate action.
By following these steps, you ensure your iot dashboard delivers accurate, actionable insights for your business.
Design a Custom IoT Dashboard UI
What is an iot dashboard for real-time monitoring? An iot dashboard for real-time monitoring is a digital platform that collects, processes, and displays live data from connected devices and sensors. You use this tool to track device performance, monitor operations, and respond to changes as they happen. The iot dashboard for real-time monitoring gives you instant visibility into your systems, helping you make better decisions and improve efficiency.
A well-designed iot monitoring dashboard transforms raw data into actionable insights. You can see key metrics, trends, and alerts in one place. This setup allows you to act quickly and keep your operations running smoothly. The design of your dashboard plays a crucial role in how effectively you can use your data.
Choose Visualizations for IoT Monitoring Dashboard
You need to select theright visualizations to make your iot monitoring dashboard effective. Different types of data require different display methods. For example, line charts work well for showing trends over time, such as temperature or energy usage. Bar charts help you compare values, like production output across different shifts. Pie charts show proportions, such as how much energy each machine uses. Tables organize detailed information for easy reference.
You can also use 3D visualizations to explore spatial data, especially in environments like smart factories. Geospatial maps help you track assets or shipments across locations. Real-time dashboards display key performance indicators, trends, and alerts, giving you immediate insights. Interactive dashboards let you filter and drill down into data, so you can focus on what matters most.
When you choose visualizations, think about the story you want your data to tell. Prioritize clarity and relevance. Avoid clutter by focusing on the most important metrics. Use color coding and clear labels to highlight critical information. This approach helps you and your team understand the data quickly and take action when needed.
FineReport'sMultiple Built-in Charts For Visualization
Organizing your data is just as important as choosing the right visualizations. A clear and logical layout makes your dashboard easy to use. Group related metrics together, such as production statistics, equipment status, and maintenance alerts. Place the most important information at the top or center, where users will see it first.
A well-organized dashboard supports fast, data-driven decision-making. When you distill large datasets into simple, visual formats, you make it easier for users to analyze information and respond to challenges. Real-time dashboards provide insights into key performance areas, such as sales or customer engagement, so you can act quickly on new opportunities or issues.
You should also consider usability. Use consistent formats and avoid information overload. Limit the number of widgets on each page. Provide options to filter or sort data, so users can find what they need. This structure turns your dashboard into a valuable business tool that supports practical insights and real-time decisions.
Impact Area
Description
Measurable Values
Essential for tracking performance and optimizing strategies, enabling actionable insights.
Selection of Appropriate Metrics
Aligning metrics with business objectives enhances dashboard quality and user engagement.
Balance Between Aesthetics and Functionality
Ensures user engagement and facilitates understanding of data, improving decision-making processes.
Use of Tools and Techniques
Advanced analytics and user feedback tools help measure dashboard effectiveness and user satisfaction.
Customize Layouts with FineReport
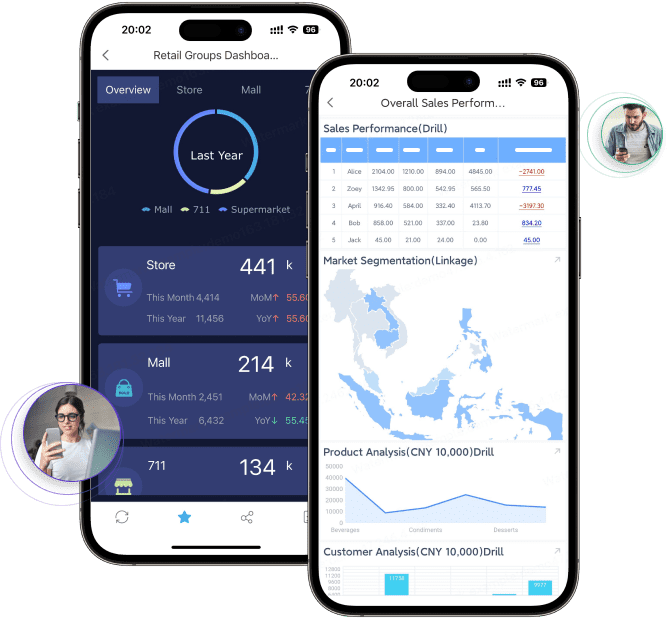
You can create a custom iot dashboardthat fits your unique needs using FineReport. FineReport offers flexible dashboard layout options, including 3D dashboards and mobile dashboards. You can design dashboards that display complex data in three dimensions, which is especially useful for visualizing smart factory operations or logistics networks. Mobile dashboards let you monitor key metrics on your phone or tablet, so you stay connected wherever you are.
FineReport features a drag-and-drop design interface. You can add charts, tables, and widgets without writing code. The responsive design ensures your dashboard looks great on any device, from large screens to smartphones. You can use built-in templates to speed up the creation process. These templates help you set up an efficient iot dashboard quickly, so you can focus on analyzing data instead of building layouts from scratch.
With FineReport, you can customize every aspect of your dashboard layout. Arrange components to highlight device performance, production trends, or quality metrics. You can also set up interactive features, such as drill-downs and filters, to explore data in more detail. This flexibility allows you to build a dashboard that matches your business goals and supports real-time data visualization.
Tip: Test your dashboard with real users and gather feedback. This process helps you refine the layout and improve usability, making your custom iot dashboard even more effective.
What is an IoT dashboard forreal-time monitoring? This is a digital platform that collects, processes, and displays live data from connected devices and sensors. You use it to track device performance, monitor operations, and respond to changes as they happen. The IoT dashboard for real-time monitoring gives you instant visibility into your systems, helping you make better decisions and improve efficiency.
You can use an IoT monitoring dashboard to visualize real-time sensor data, receive alerts, and monitor key metrics. This tool supports efficient operations by providing up-to-date information and actionable insights. It acts as your command center for real-time data visualization and operational control.
Set Up Live Data Feeds and Auto-Refresh
You need to ensure your dashboard connects to sources that provide live data. This involves streaming from databases, sensors, or event logs. The infrastructure must handle data flow with minimal latency. You can use real-time data connectors, scheduled data refresh, or push data updates to keep your dashboard current. Integration with streaming data sources allows you to see information as it is generated.
Requirement
Description
Data Availability and Speed
Connect to live data sources and ensure minimal latency.
User-Friendly Dashboard Design
Keep the interface simple and highlight important metrics.
Alerts and Automation
Set up automated alerts for key metrics and automate responses to issues.
Integration with Streaming Data
Support real-time updates from IoT devices and sensors.
You should test your dashboard in phases, gather feedback, and refine the design for the best results.
Configure Alerts and Notifications
You can configure your custom IoT dashboard to send instant notifications when important thresholds are reached. For example, in manufacturing, sensors detect changes in machine temperature or pressure. The dashboard displays live readings and sends alerts if values exceed safe limits. This prevents failures and reduces downtime.
Instant notifications reach users through email, SMS, or mobile apps.
The system ranks issues by severity, so critical problems get immediate attention.
Continuous monitoring and automated alerts help you maintain smooth operations and boost productivity.
Monitor Performance and Latency
You should track key metrics to ensure your efficient IoT dashboard performs well. Monitoring device performance helps you spot issues early and maintain reliability.
Metric
Description
Battery life
Track device usage and prevent downtime.
Signal strength
Ensure strong wireless communication to avoid errors.
CPU usage
Monitor resource utilization and identify inefficiencies.
Storage capacity
Prevent data loss by tracking available storage.
Transmission latency
Measure how quickly data travels to the cloud.
Throughput
Assess data transfer efficiency and avoid congestion.
Response times
Check how fast commands reach devices to prevent delays.
By focusing on these metrics, you ensure your IoT monitoring dashboard delivers reliable, real-time sensor data and supports effective decision-making.
What is an IoT dashboard for real-time monitoring? This tool is a digital platform that collects, processes, and displays live data from connected devices and sensors. You use it to track device performance, monitor operations, and respond to changes as they happen. The IoT dashboard for real-time monitoring gives you instant visibility into your systems, helping you make better decisions and improve efficiency.
Securing and scaling your custom IoT dashboard is essential for protecting sensitive information andsupporting business growth. You need to apply strong security measures and plan for future expansion. This approach ensures your dashboard remains reliable and effective as your organization evolves.
Apply Data Security Best Practices
You should follow industry best practices to protect your IoT dashboard and the data it handles. The table below summarizes key security measures:
Best Practice
Description
Role-Based Access Control (RBAC)
Assign roles to users and limit access based on job responsibilities.
Multi-Factor Authentication (MFA)
Require a second form of verification for system access.
Strong Encryption
Use protocols like TLS to secure data transmission.
Data at Rest Encryption
Encrypt stored data and regularly check encryption methods.
Change Default Passwords
Replace default credentials with strong, unique passwords.
These steps help you reduce the risk of unauthorized access and data breaches.
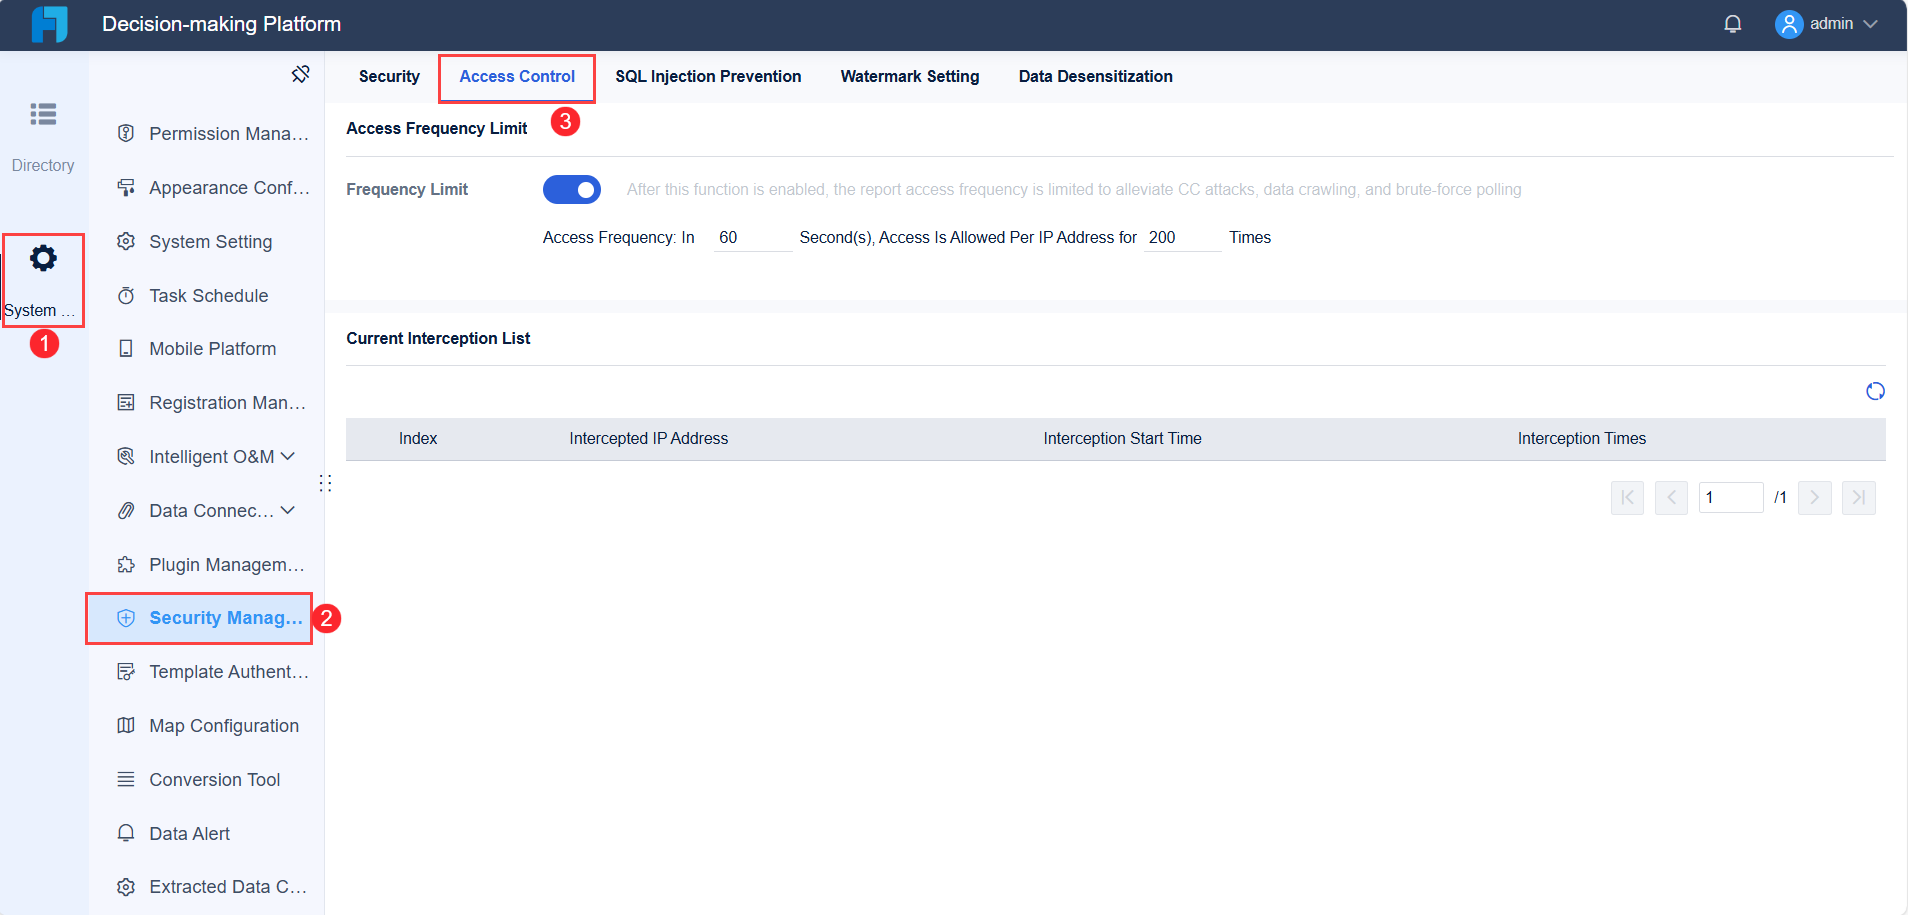
Manage Permissions with FineReport
FineReport provides robust permission management and security features for your custom IoT dashboard. You can set up user accounts, assign roles, and control access to sensitive data. The platform supports role-based access control, ensuring that only authorized users can view or modify critical information. FineReport also enables you to enforce password policies and integrate multi-factor authentication for added protection. With these tools, you maintain data integrity and meet compliance requirements.
Tip: Regularly review user permissions and update them as team members change roles or leave the organization.
You should design your IoT dashboard with scalability in mind. As your device numbers and data volume grow, a flexible architecture allows you to expand without major changes. Strong monitoring of device health and performance helps you detect issues early and keep maintenance costs low. When you choose a monitoring platform, consider storage, processing power, and network capacity to support future expansion.
Scalability requires a flexible system that adapts to growth.
Effective device management keeps your dashboard efficient as you add more devices.
Planning for scalability from the start helps you protect your investment and adjust to new business needs.
By following these strategies, you ensure your IoT dashboard remains secure, reliable, and ready for future challenges.
Test, Iterate, and Train for Efficient IoT Dashboard Use
What is an iot dashboard for real-time monitoring? This tool is a digital platform that collects, processes, and displays live data from connected devices and sensors. You use it to track device performance, monitor operations, and respond to changes as they happen. The iot dashboard for real-time monitoring gives you instant visibility into your systems, helping you make better decisions and improve efficiency.
You need to ensure your dashboard remains effective and user-friendly. Testing, iteration, and training are essential steps that help you validate functionality, refine features, and empower users to get the most value from your system.
Gather Feedback and Refine Dashboard
You should approach testing with a comprehensive plan. Start by defining objectives and scenarios that reflect real-world use. Test early and often to catch errors before they become bigger problems. Automated testing increases efficiency and coverage, while collaboration with stakeholders ensures everyone shares a common understanding of goals. Always test in environments that closely match actual usage.
You must also focus on security, performance, and usability. Security testing helps you find vulnerabilities. Performance testing checks how the dashboard works under different loads. Usability testing ensures the dashboard is easy to use and meets user needs.
Continuous improvement relies on user feedback. Collect feedback through surveys, interviews, or direct observation. User feedback helps you identify design flaws, validate assumptions, and discover ways to enhance usability. Iterative updates based on user interactions keep your dashboard relevant and effective. Collaboration among designers, engineers, and data scientists ensures the dashboard evolves with user needs.
Provide Training and Documentation
Effective training and clear documentation help users adopt your dashboard quickly. You should use a variety of methods to support different learning styles and roles. The table below summarizes the most beneficial types:
Training/Documentation Type
Description
Progressive Disclosure
Reveal information gradually to avoid overwhelming users.
Contextual Help
Offer assistance exactly when and where users need it.
Visual Cues
Use icons, colors, and animations to guide users intuitively.
Interactive Documentation
Provide digital manuals with embedded videos and troubleshooting guides.
Role-Based Customization
Tailor the setup process for different user roles within the organization.
Adaptive Tutorials
Adjust guidance based on user behavior and preferences.
Feature Spotlights
Highlight lesser-known features to encourage ongoing discovery.
You can also provide getting started templates, code examples, and advanced resources for developers. Connect new users with experienced peers for support and best practices. Regularly update your training materials to reflect new features and improvements. This approach ensures users stay informed and confident as they use your dashboard.
You can create aneffective dashboardfor real-time monitoring by following these steps:
Define the objectives and requirements of your IoT dashboard.
Design a clear and functional user interface.
Set up alerts and notifications.
Conduct continuous testing and adjustments.
Train your team.
FineReport supports you with powerful tools for integration, security, and customization. If you work in manufacturing, consider a smart factory dashboard for advanced features:
Feature
Smart Factory Dashboard
General Dashboard
Customization
Highly customizable for specific needs
Limited customization options
Real-time insights
Provides real-time performance visibility
May not focus on real-time data
Start your IoT dashboard project today and unlock new value for your business.
Access a wealth of case studies, industry insights, and solution guides to accelerate digital transformation.
FAQ
What is an IoT dashboard for real-time monitoring?
An IoT dashboard for real-time monitoring is a digital tool that collects and displays live data from connected devices and sensors. You use it to track operations, spot issues, and make quick decisions based on up-to-date information.
How do you connect devices to an IoT dashboard for real-time monitoring?
You connect devices by using compatible sensors and communication protocols. The dashboard integrates data through APIs or built-in connectors. This setup allows you to view and analyze device performance instantly.
Can you customize visualizations in an IoT dashboard for real-time monitoring?
Yes, you can customize visualizations. You choose charts, tables, and layouts that fit your needs. Many platforms, like FineReport, offer drag-and-drop tools for easy customization.
Why is security important in an IoT dashboard for real-time monitoring?
Security protects your data from unauthorized access. You should use role-based access control, encryption, and regular updates. These steps keep your information safe and maintain system reliability.
How do you scale an IoT dashboard for real-time monitoring as your business grows?
You plan for scalability by choosing flexible software and infrastructure. Add new devices and data sources as needed. Monitor system performance to ensure your dashboard handles increased data volume efficiently.