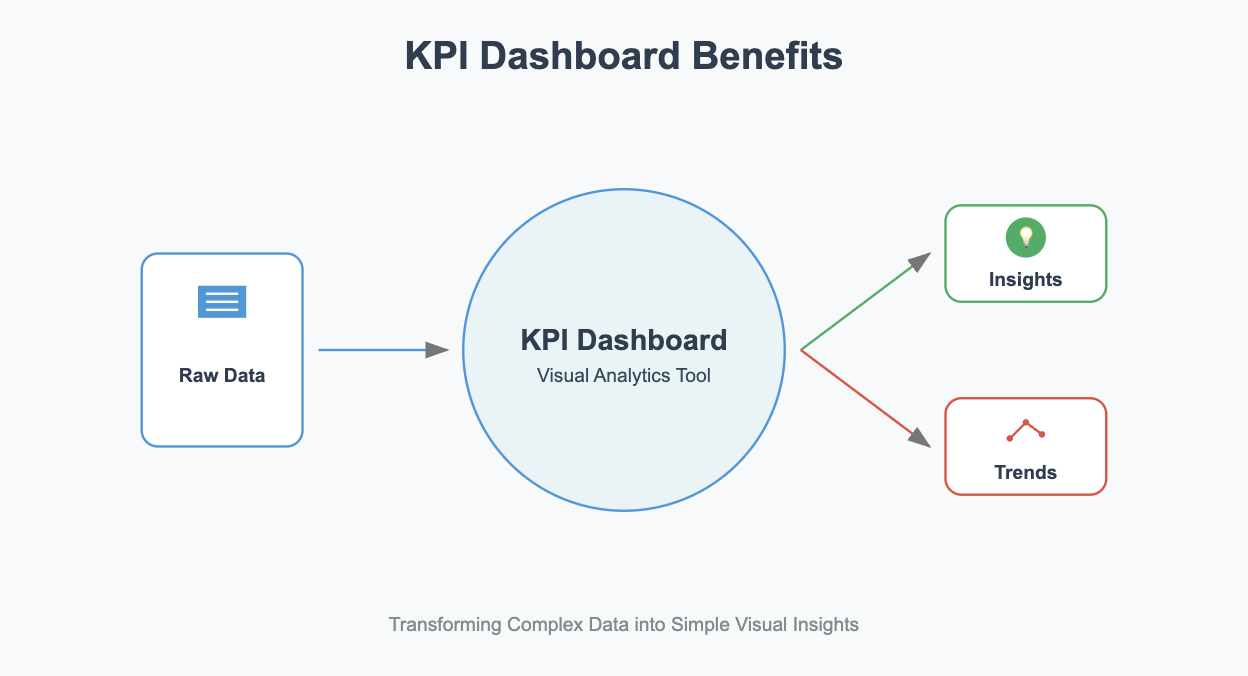
A KPI dashboard serves as a dynamic interface that not only visualizes and tracks key performance indicators but also integrates predictive analytics to forecast future trends. By transforming raw data into actionable insights, it empowers businesses to proactively address challenges and seize opportunities, rather than merely reacting to past performance. By presenting information in a simple, visual format, the dashboard eliminates the need for complex spreadsheets or manual calculations.
A 2022 Gartner study highlights that organizations leveraging visual data tools, such as KPI dashboards, not only achieve a 30% improvement in decision-making speed and accuracy but also report a significant reduction in operational inefficiencies, with some companies experiencing up to a 20% decrease in resource waste. This is because visual representations reduce cognitive load, allowing teams to focus on actionable insights rather than data processing. This allows you to focus on making informed, data-driven decisions that drive your business forward. Whether you manage sales, marketing, or operations, a well-designed KPI dashboard keeps you aligned with your goals.
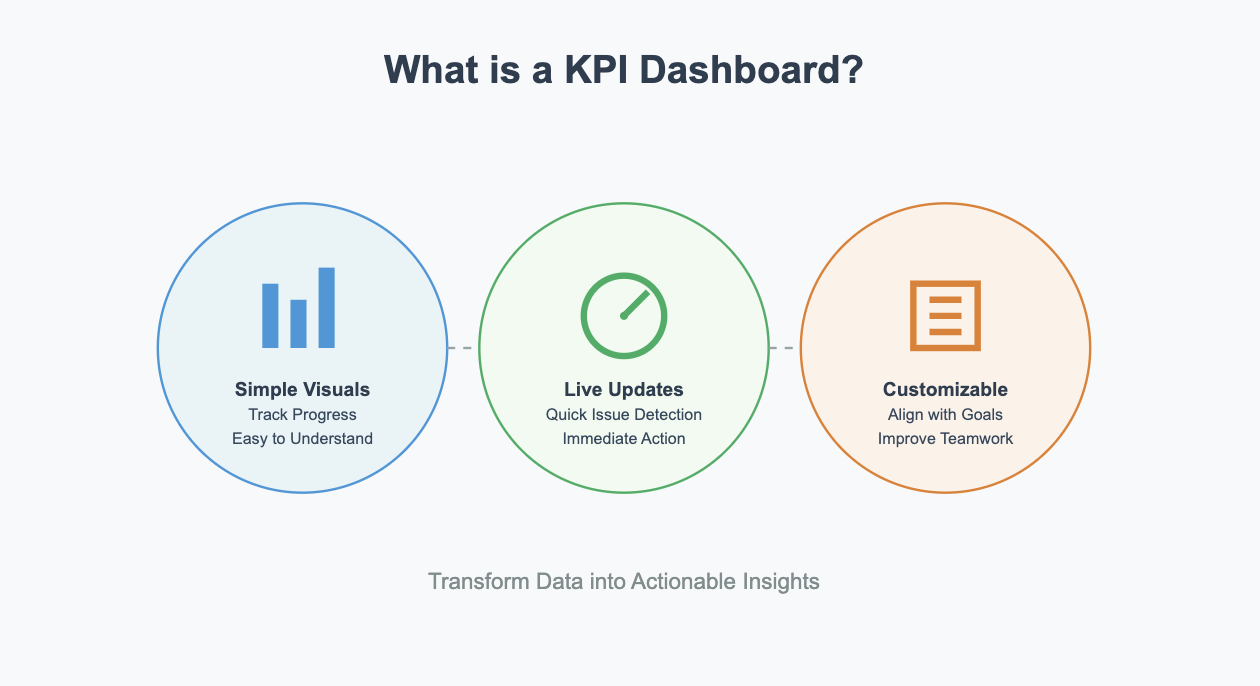
Key Takeaways
KPI dashboards display key data in simple visuals, making it easy to track progress.
Live updates help quickly identify issues and take action.
Customizable dashboards align with goals and improve teamwork.What is a KPI Dashboard?
Definition and Purpose
While KPI dashboards simplify complex data into visual formats like graphs, charts, and tables, the true power of these dashboards lies in their ability to adapt to a company's unique needs. Many tools, such as FineBI, FineReport, and FineVis, do more than just visualize data – they empower users to engage with the data in real-time, customizing the dashboards to reflect the nuanced objectives of individual teams. By integrating interactive elements and advanced data sources, these tools offer more than just clarity; they provide actionable insights that evolve with business needs.
The primary purpose of a KPI dashboard extends beyond providing real-time insights; it also fosters a culture of data-driven decision-making by embedding analytics into daily workflows, ensuring that every team member has access to the information needed to make informed choices. A report by McKinsey & Company highlights that companies leveraging real-time data analytics are 2.5 times more likely to outperform their competitors in revenue growth. This underscores the importance of KPI dashboards in enabling businesses to respond swiftly to market changes and operational challenges.
It fosters collaboration by giving teams access to the same data, which accelerates communication and improves alignment. Whether you want to monitor sales performance or track operational efficiency, this tool keeps your business on the right path.
Purpose
Description
Customizability
Tailors visuals, alerts, and metrics to specific objectives.
Data Centralization
Combines data from various sources into one platform for consistency.
Early Problem Detection
Identifies issues like sales declines or bottlenecks for proactive action.
How KPI Dashboards Work
KPI dashboards not only automate manual data processes but also integrate machine learning algorithms to identify patterns and anomalies that might otherwise go unnoticed. This allows teams to focus on strategic insights and innovative solutions, rather than being bogged down by routine data collection and analysis. They provide a centralized platform where you can track key performance indicators in real time.
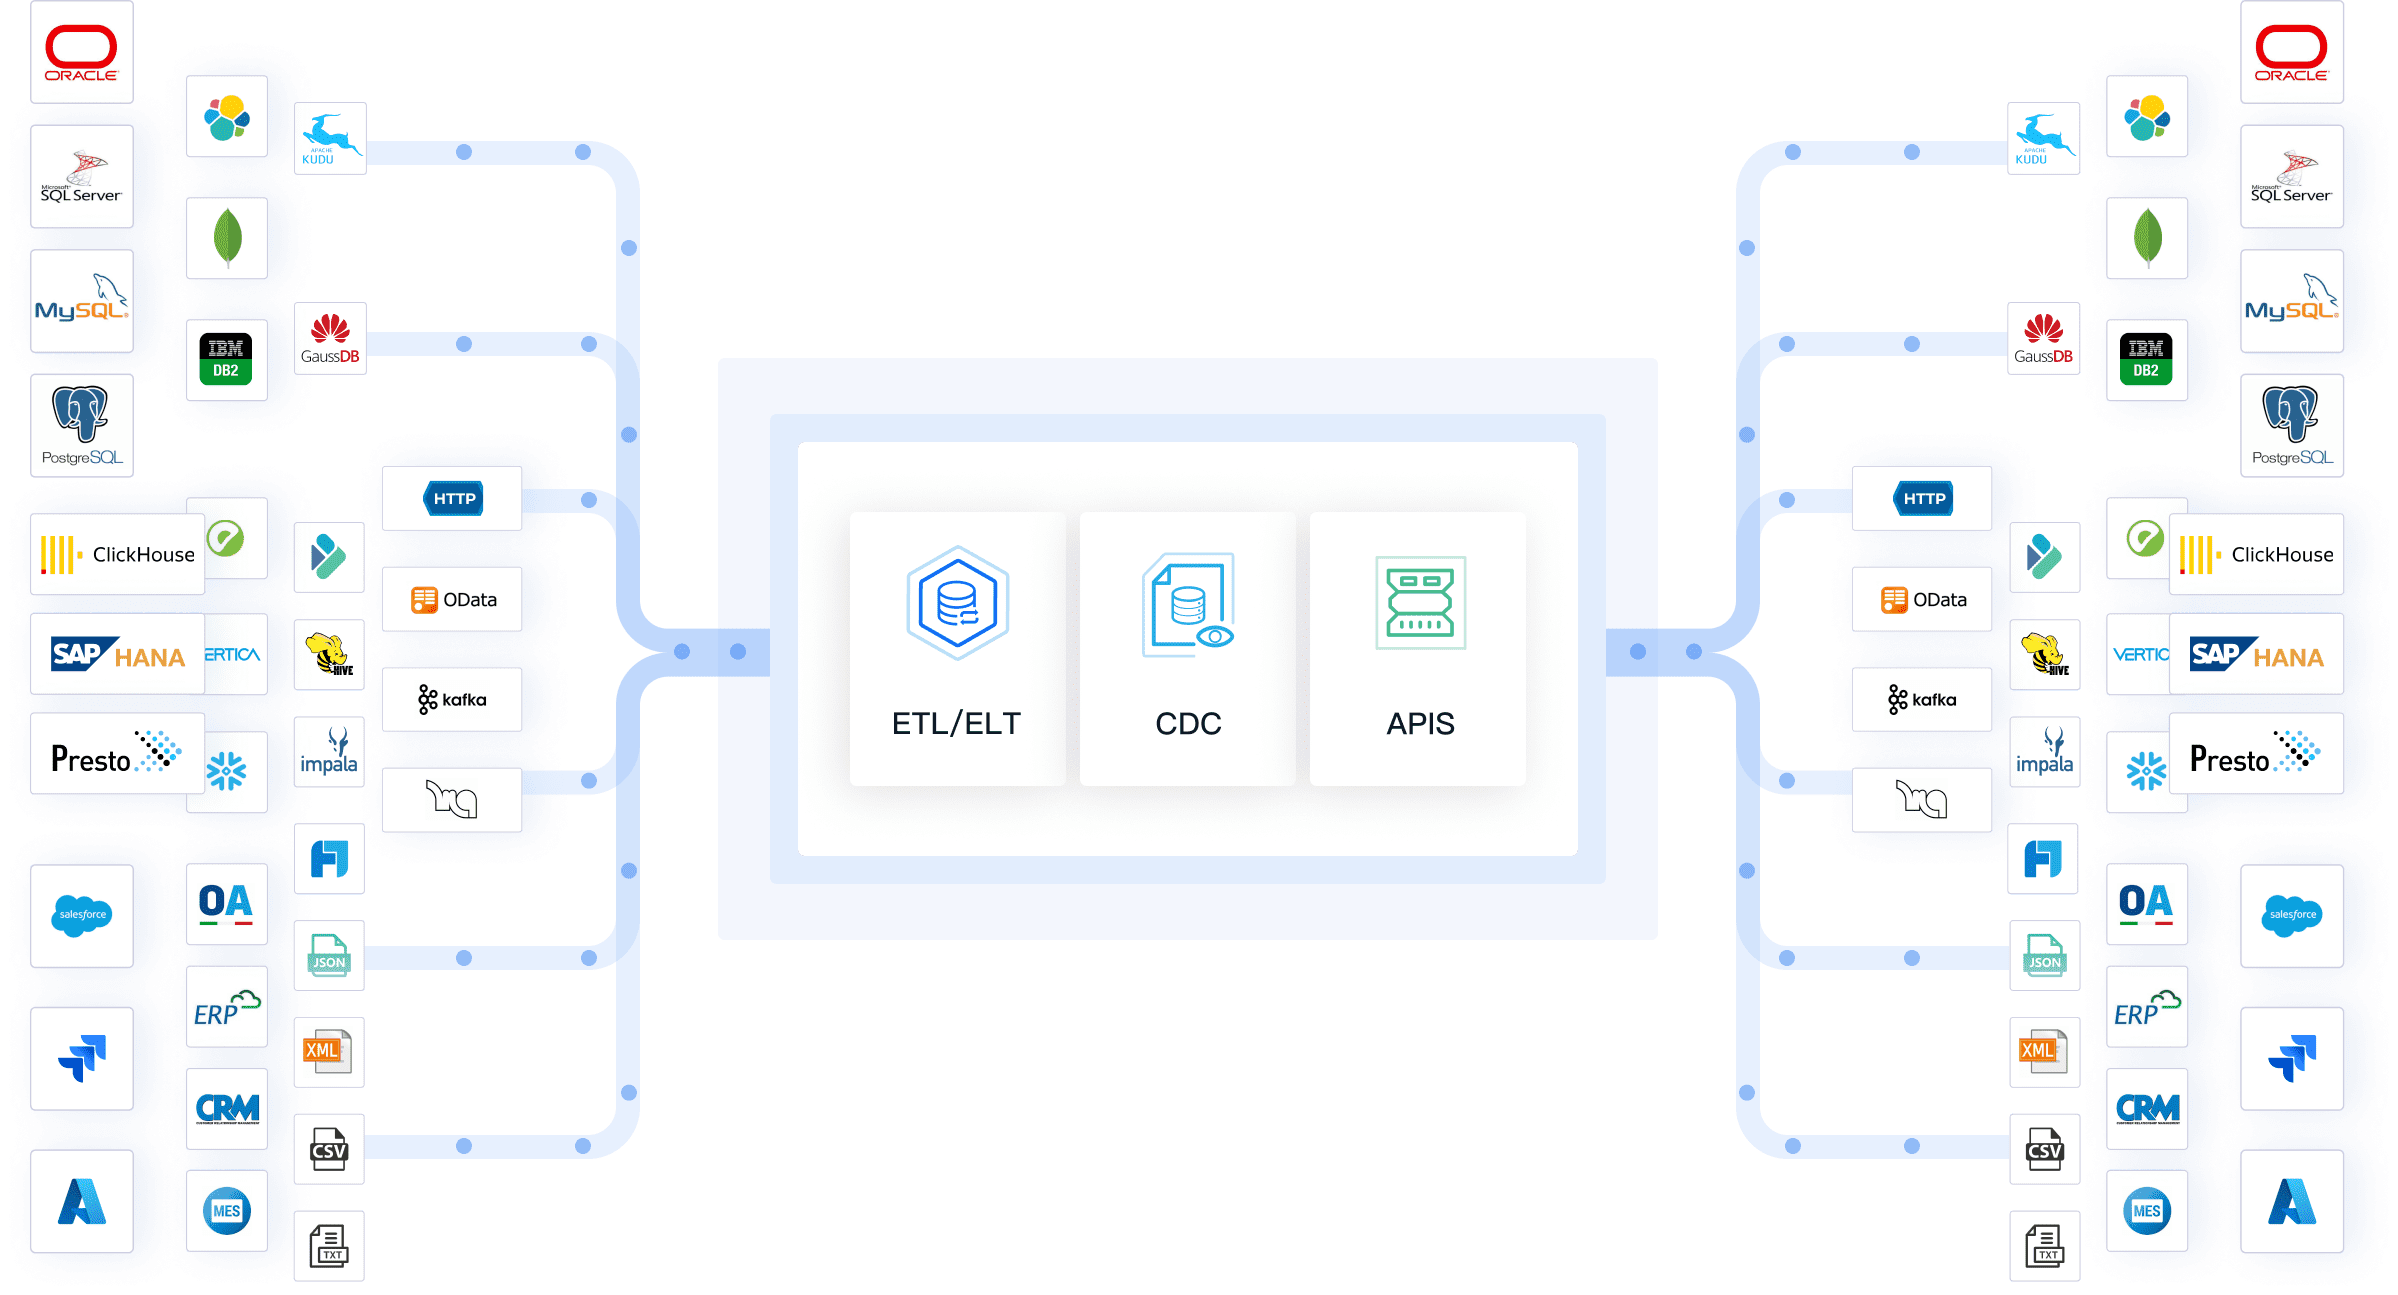
Solutions like FineDataLink enhance this process by connecting multiple data sources and automating data integration into a single, unified platform. This capability allows organizations to track KPIs in real time, reduce manual input, and focus on analysis and decision-making rather than data management. This means you no longer need to wait for reports or input from others to make decisions. Visual formats like charts and graphs simplify data interpretation, helping you spot trends and issues quickly.
These dashboards also offer customizable features, enabling you to align them with your business priorities. For example, you can choose which KPIs to display and how to organize them for clarity. By providing a real-time view of performance, they empower you to act swiftly and stay ahead of challenges.
Key Features of a KPI Dashboard
Effective KPI dashboards share several essential features that make them valuable tools for your business, The following table summarizes the key features of effective KPI dashboards, supported by insights from industry experts:
Feature
Description
Expert Insight
Goal Alignment
Ensures KPIs align with business objectives.
"KPIs must be tied to strategic goals to drive meaningful outcomes." – Harvard Business Review.
Relevant Data
Gathers accurate and timely information from reliable sources.
"Data relevance is critical; irrelevant metrics can lead to misaligned priorities." – Forbes.
Clear Visualizations
Uses charts and graphs to simplify data interpretation.
"Visual clarity reduces misinterpretation and enhances decision-making." – MIT Sloan Management Review.
Real-Time Updates
Provides up-to-date information for quick decisions.
"Real-time data access is a game-changer for operational efficiency." – Deloitte Insights.
By incorporating these features, a KPI dashboard becomes a powerful tool for tracking progress and achieving your goals. To fully optimize these features, businesses can use advanced tools like FineBI, which is known for its real-time data integration, and FineVis, a tool that excels in providing intuitive visualizations. These tools support seamless goal alignment by ensuring that the KPIs displayed are directly tied to strategic business objectives, helping organizations achieve real-time updates and clear data visualization across departments.
Benefits of a KPI Dashboard
Real-Time Data Insights
A KPI dashboard provides real-time performance tracking, but its true value lies in its ability to contextualize data within the broader business environment. By correlating real-time metrics with historical trends and external market factors, it offers a holistic view that supports more nuanced and strategic decision-making. This centralized platform consolidates data from multiple sources, eliminating inconsistencies and saving time. With real-time insights, you can quickly identify issues, such as declining sales or operational bottlenecks, and take immediate action to resolve them.
However, it’s also important to recognize that the selection of a KPI dashboard and data visualization tools may sometimes come with potential conflicts of interest. For instance, when evaluating different dashboard platforms, there may be a tendency to favor tools that align with a company’s existing software ecosystem or the tools that offer preferential pricing. This could influence the selection process and lead to choices that don't necessarily provide the best value or functionality for a business.
Real-time data ensures your decisions are based on facts, not outdated reports or assumptions.
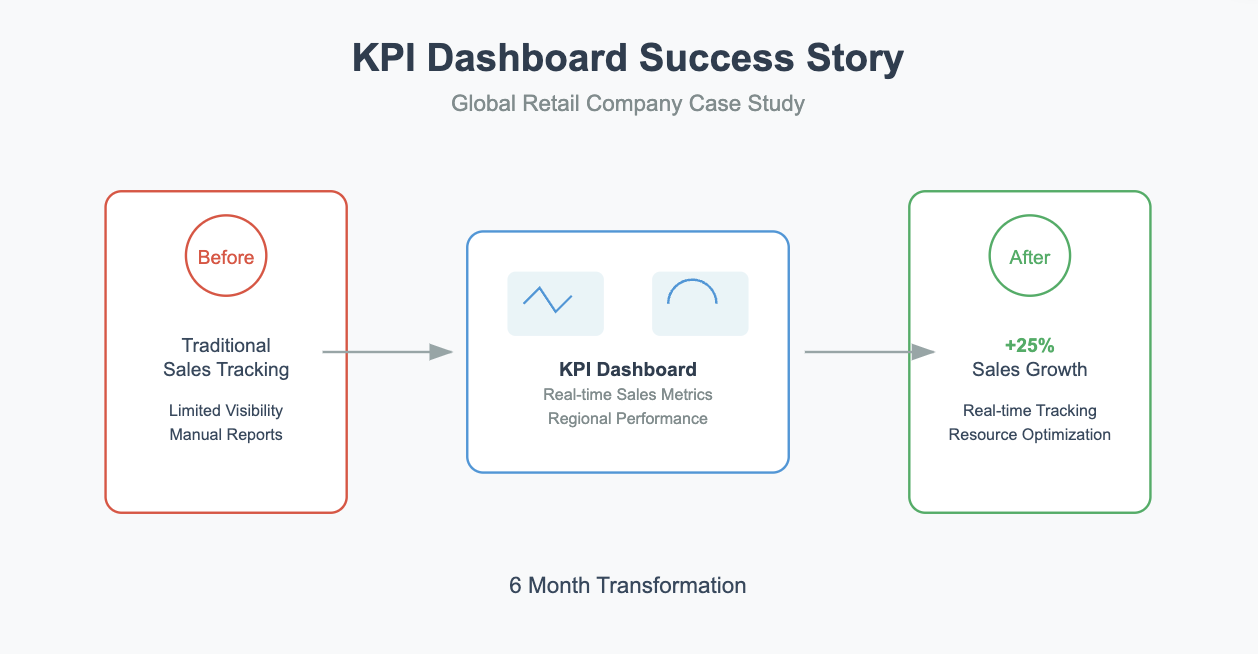
For example, tracking progress toward goals becomes seamless. A case study from Salesforce demonstrates how a global retail company improved its sales performance by 25% within six months by using a KPI dashboard to track real-time sales metrics. The dashboard allowed the company to identify underperforming regions and reallocate resources effectively, resulting in a significant boost in revenue.
You can monitor key performance metrics and assess whether your team is on track to meet targets. Additionally, early problem detection allows you to address challenges proactively, preventing them from escalating. Customizable dashboards also let you focus on the KPIs that matter most to your business, aligning your efforts with strategic objectives.
Improved Decision-Making
KPI dashboards empower decision-makers by not only presenting complex data in clear, visual formats but also by enabling scenario analysis and what-if simulations. This allows businesses to explore the potential outcomes of different strategies before committing resources, thereby reducing risk and enhancing strategic planning. Instead of relying on guesswork, you can analyze trends, assess progress, and pinpoint areas needing attention. For instance, visual representations like graphs and charts make it easier to interpret performance metrics, helping you identify patterns and opportunities.
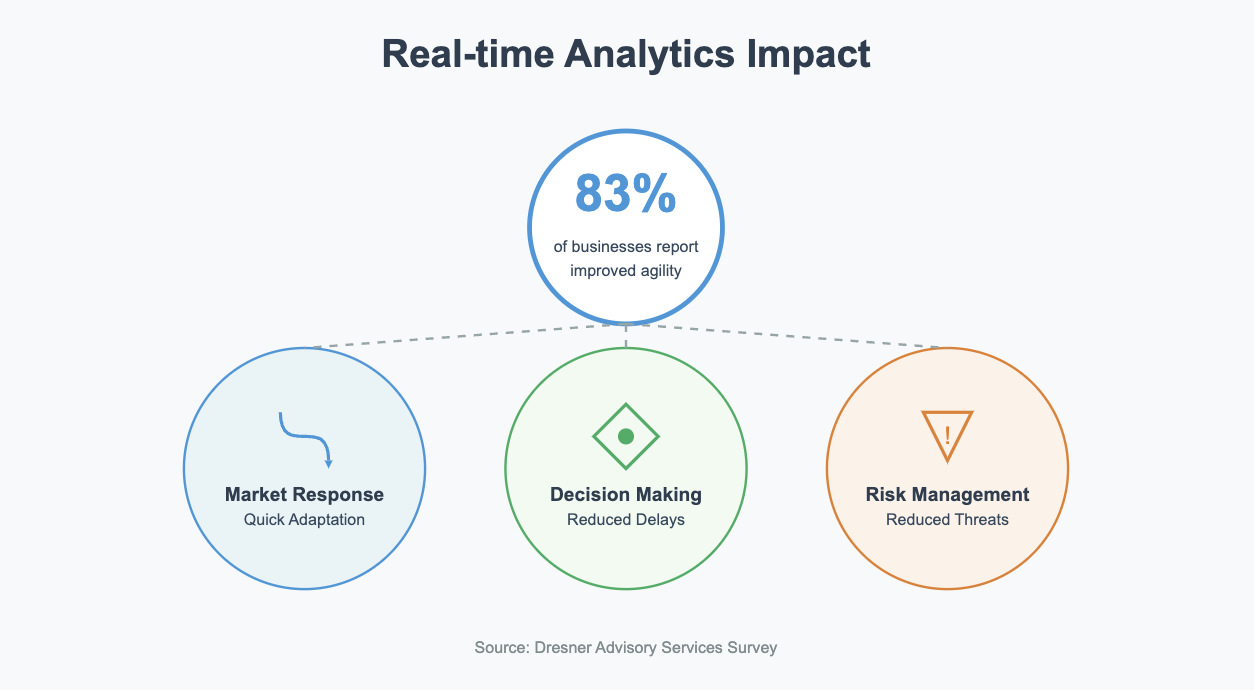
Timely and accurate information enhances your ability to respond to market changes. According to a survey by Dresner Advisory Services, 83% of businesses that use real-time analytics report improved agility in responding to market shifts. This agility is critical in today’s fast-paced business environment, where delays in decision-making can lead to missed opportunities or increased risks.
Whether you’re adjusting a marketing strategy or reallocating resources, the dashboard ensures you act swiftly and effectively. Shared dashboards also improve visibility into key metrics, allowing stakeholders to access and interpret data without delays. This streamlined approach fosters collaboration and ensures everyone stays aligned with organizational goals.
Enhanced Team Collaboration
An effective KPI dashboard fosters collaboration by providing a shared view of critical metrics, but it also enhances cross-functional alignment by integrating data from multiple departments. This ensures that all teams are working towards common objectives, reducing silos and improving overall organizational coherence. When your team works with the same real-time data, confusion disappears, and alignment improves. This transparency accelerates communication and decision-making, as everyone has access to the same information.
A study published in the Journal of Business Communication found that teams with shared access to real-time data experience a 40% reduction in miscommunication and a 20% increase in collaboration efficiency. This highlights the role of KPI dashboards in fostering a culture of transparency and teamwork.
Centralized data access fosters teamwork and ensures all departments stay on the same page.
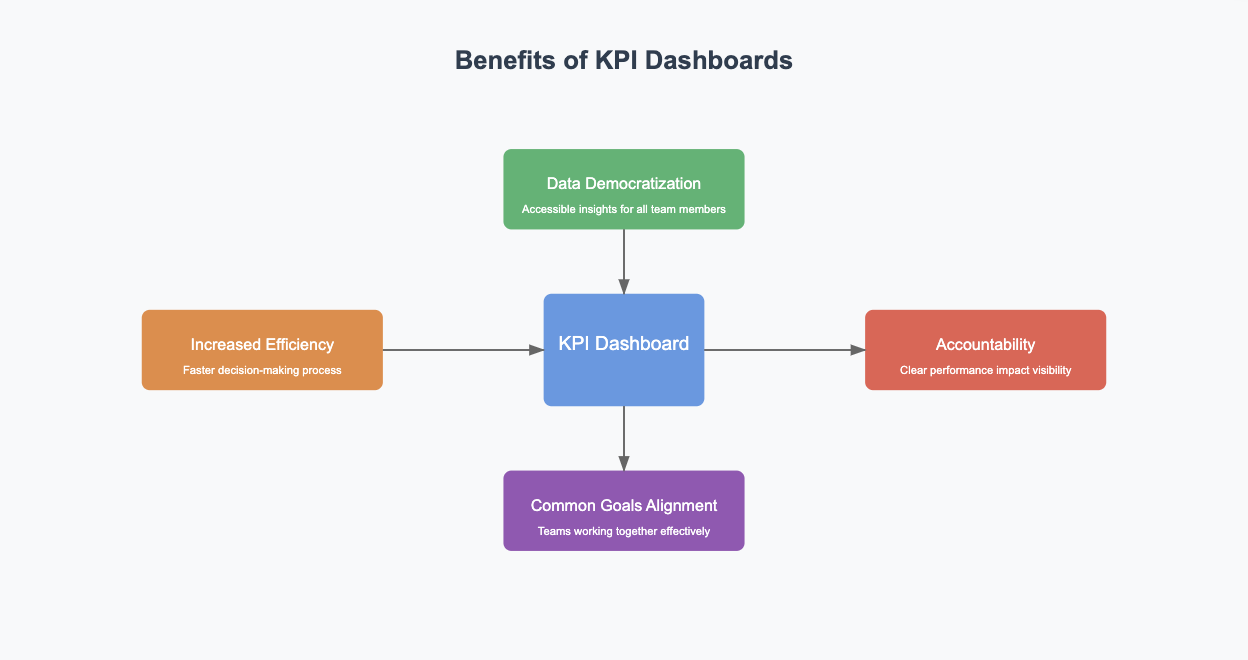
For example, a shared dashboard democratizes data, enabling teams to make decisions without waiting for input from others. This not only boosts efficiency but also creates a sense of accountability. Employees can see how their contributions impact overall performance, leading to better alignment and happier teams. By using KPI dashboards, you create a collaborative environment where everyone works toward common goals.
Operational Efficiency
A KPI dashboard significantly enhances operational efficiency by not only streamlining processes and reducing manual effort but also by identifying inefficiencies through advanced analytics. By pinpointing bottlenecks and optimizing workflows, it enables organizations to achieve higher productivity and cost savings. It centralizes data from multiple sources, ensuring consistency and accuracy across your organization. This eliminates the need for time-consuming manual reporting, allowing you to focus on analyzing insights and taking action.
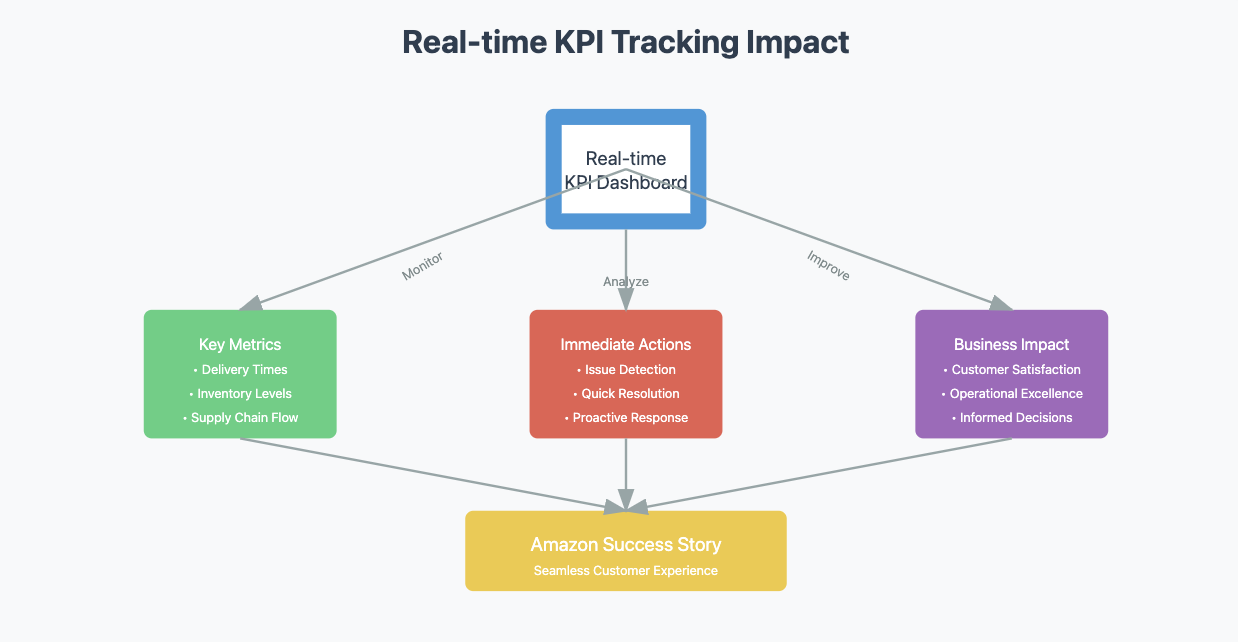
Real-time tracking of key performance indicators enables you to identify and resolve issues quickly. For instance, Amazon uses real-time KPI dashboards to monitor its supply chain operations. By tracking metrics like delivery times and inventory levels, the company can proactively address bottlenecks, ensuring a seamless customer experience. This approach has contributed to Amazon’s reputation for operational excellence.
If a bottleneck occurs in your operations, the dashboard highlights it immediately, giving you the opportunity to address it before it escalates. Visual data representation also simplifies trend analysis, helping you assess progress and make informed decisions faster.
Customization is another key advantage. You can tailor the dashboard to meet the specific needs of different departments, ensuring that each team has access to relevant insights. This alignment with strategic goals keeps everyone focused on organizational priorities. Additionally, linking metrics to individual or team performance fosters accountability and motivates employees to achieve their targets.
By automating kpi reporting, the dashboard saves valuable time and resources. Early problem detection further boosts efficiency by enabling proactive solutions. These features make effective kpi dashboards an essential tool for improving workplace productivity and achieving operational excellence.
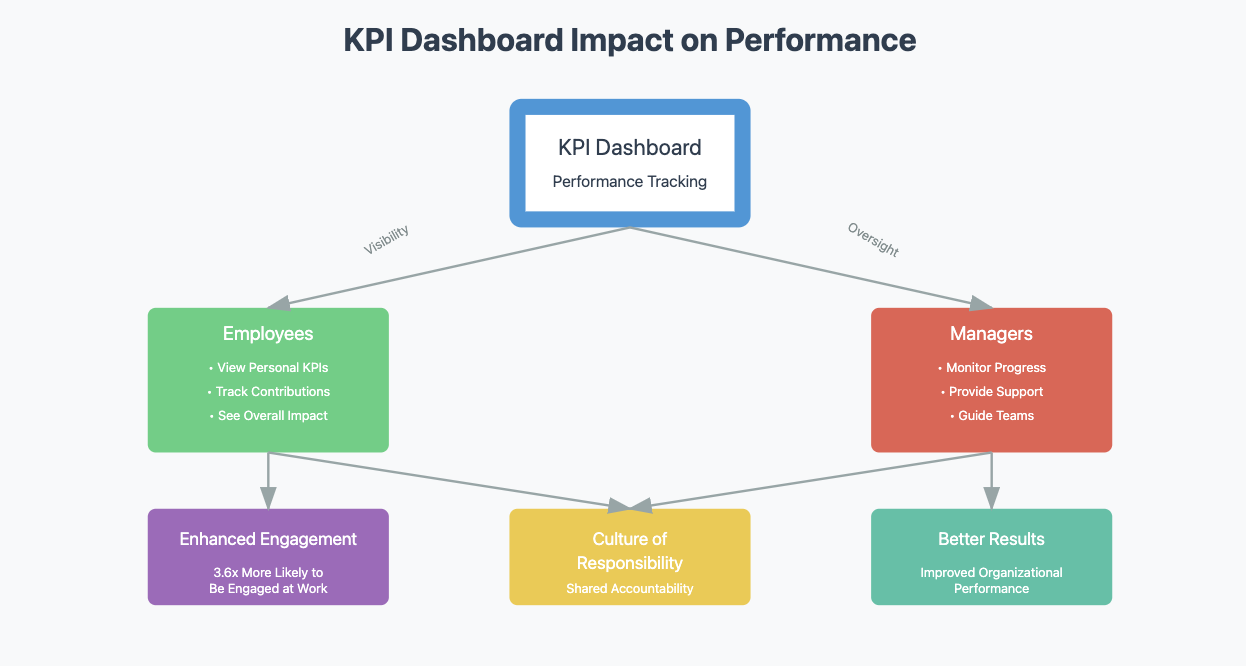
Goal Tracking and Accountability
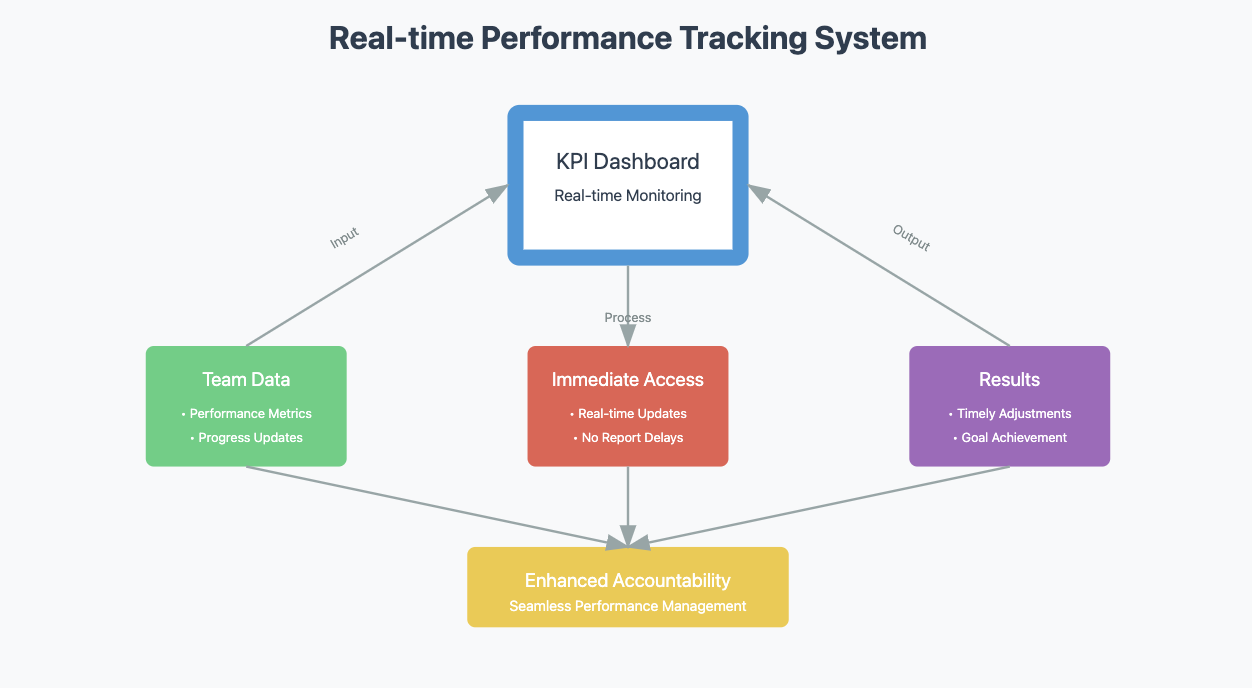
Tracking goals and maintaining accountability become seamless with a kpi dashboard. It provides a real-time view of team performance, allowing you to monitor progress without waiting for reports from various departments. This immediate access to data ensures that you stay informed and can make timely adjustments to meet your objectives.
Shared dashboards promote transparency and collaboration. When everyone works with the same data, communication improves, and teams align better with organizational goals. For instance, centralized data access ensures consistency, while real-time updates allow you to address challenges or capitalize on opportunities as they arise.
Kpi dashboards also enhance accountability by linking key performance indicators to specific teams or individuals. Employees can see how their contributions impact overall performance, motivating them to stay on track. Managers, on the other hand, can monitor progress effectively and provide support where needed. This fosters a culture of responsibility and drives better results.
Research by Gallup shows that employees who have clear visibility into their performance metrics are 3.6 times more likely to be engaged at work. KPI dashboards not only enhance accountability but also motivate employees by showing them how their contributions impact the organization’s success.
By unifying data and providing actionable insights, kpi dashboards help you streamline workflows and achieve your goals. They are a powerful tool for ensuring that your team remains focused, aligned, and accountable.
Types of KPI Dashboards
Sales KPI Dashboards
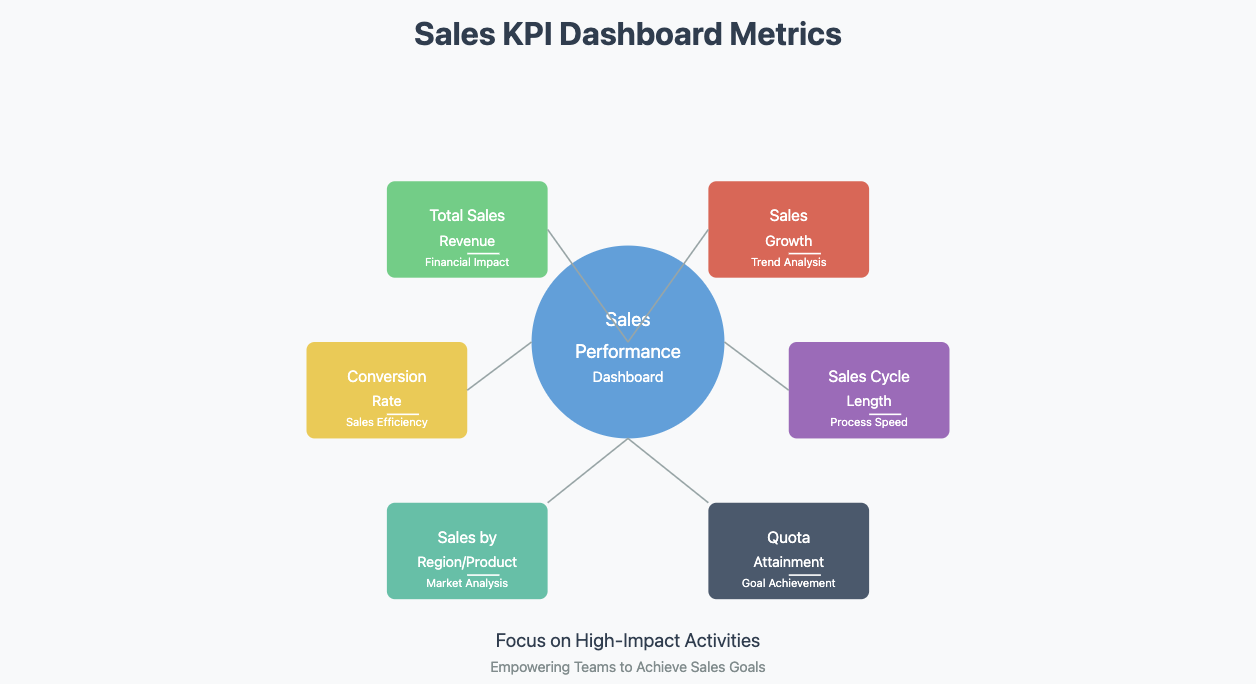
A sales KPI dashboard helps you monitor and optimize your sales team's performance. It consolidates critical sales data into one platform, giving you a clear view of how your team is performing against targets. By tracking metrics like total sales revenue, conversion rates, and sales growth, you can identify trends and make informed decisions to boost revenue. For example, monitoring the sales pipeline value allows you to assess the potential revenue from ongoing deals, while tracking average deal size helps you understand the profitability of your sales efforts.
Key metrics often included in a sales KPI dashboard are:
Total sales revenue
Sales growth
Conversion rate
Sales cycle length
Sales by region or product
Quota attainment
This type of dashboard ensures you stay on top of your sales goals and empowers your team to focus on high-impact activities.
Marketing KPI Dashboards
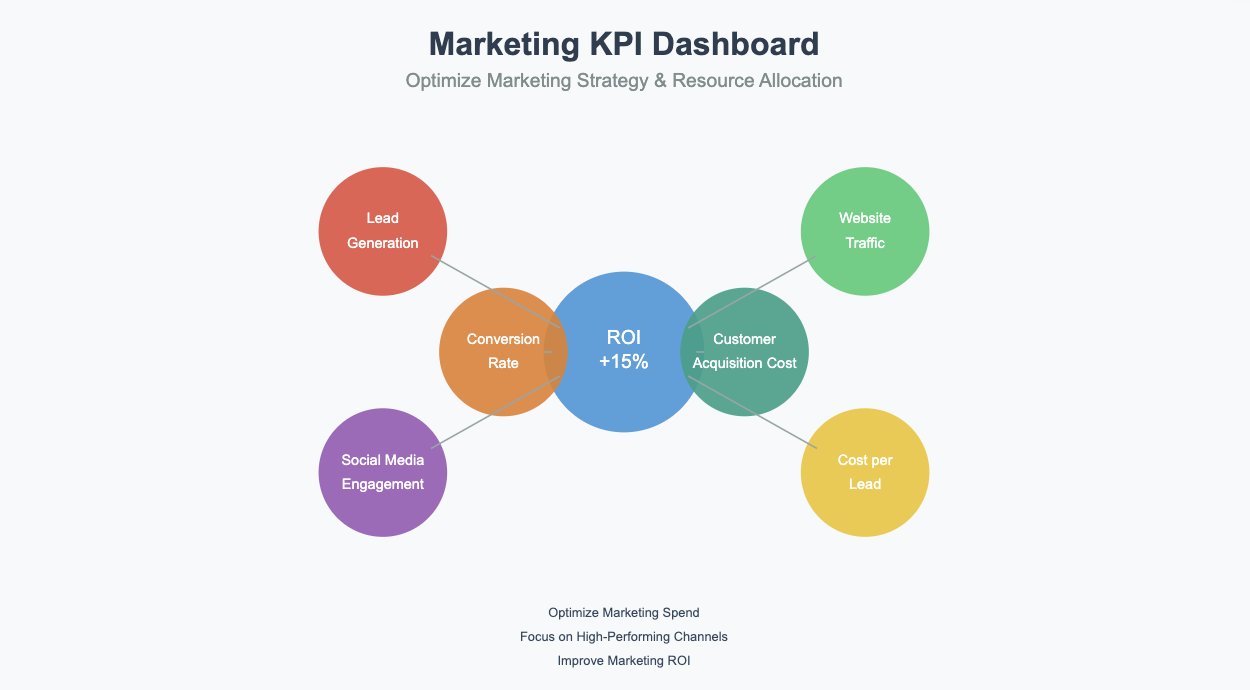
A marketing KPI dashboard provides insights into the effectiveness of your marketing campaigns. It tracks performance metrics like lead generation, website traffic, and social media engagement, helping you evaluate which strategies drive the best results. For instance, monitoring cost per lead (CPL) allows you to measure the efficiency of your marketing spend, while tracking conversion rates shows how well your campaigns turn prospects into customers.
Common metrics in a marketing KPI dashboard include:
Lead generation
Website traffic and page views
Social media engagement (likes, shares, comments)
Cost per lead (CPL)
Conversion rate
Customer acquisition cost (CAC)
This dashboard helps you allocate resources effectively and refine your marketing strategies for maximum impact. A report by HubSpot reveals that businesses that use marketing KPI dashboards see a 15% higher ROI on their marketing campaigns. By tracking metrics like cost per lead and conversion rates, companies can optimize their marketing spend and focus on high-performing channels.
Operations KPI Dashboards
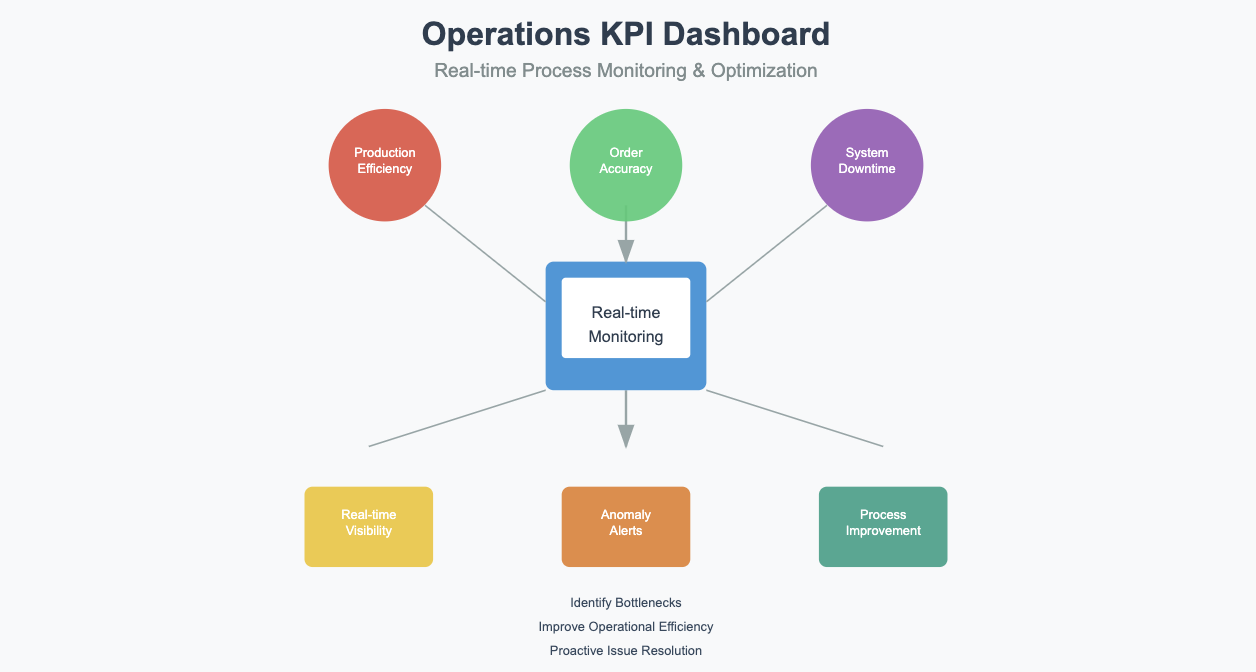
An operations KPI dashboard focuses on streamlining your business processes. It provides real-time visibility into operational performance, enabling you to identify bottlenecks and improve efficiency. For example, tracking metrics like production cycle time or order fulfillment rates helps you pinpoint areas for improvement. Alerts and notifications highlight anomalies, allowing you to address issues before they escalate.
Key features of an operations KPI dashboard include:
Real-time visibility into ongoing processes
Alerts for anomalies or delays
Metrics like production efficiency, order accuracy, and downtime
This type of dashboard ensures your operations run smoothly and align with your business goals. For example, Toyota employs operations KPI dashboards to monitor production efficiency and quality control. By tracking metrics like cycle time and defect rates, the company maintains its reputation for operational excellence and continuous improvement.
Financial KPI Dashboards
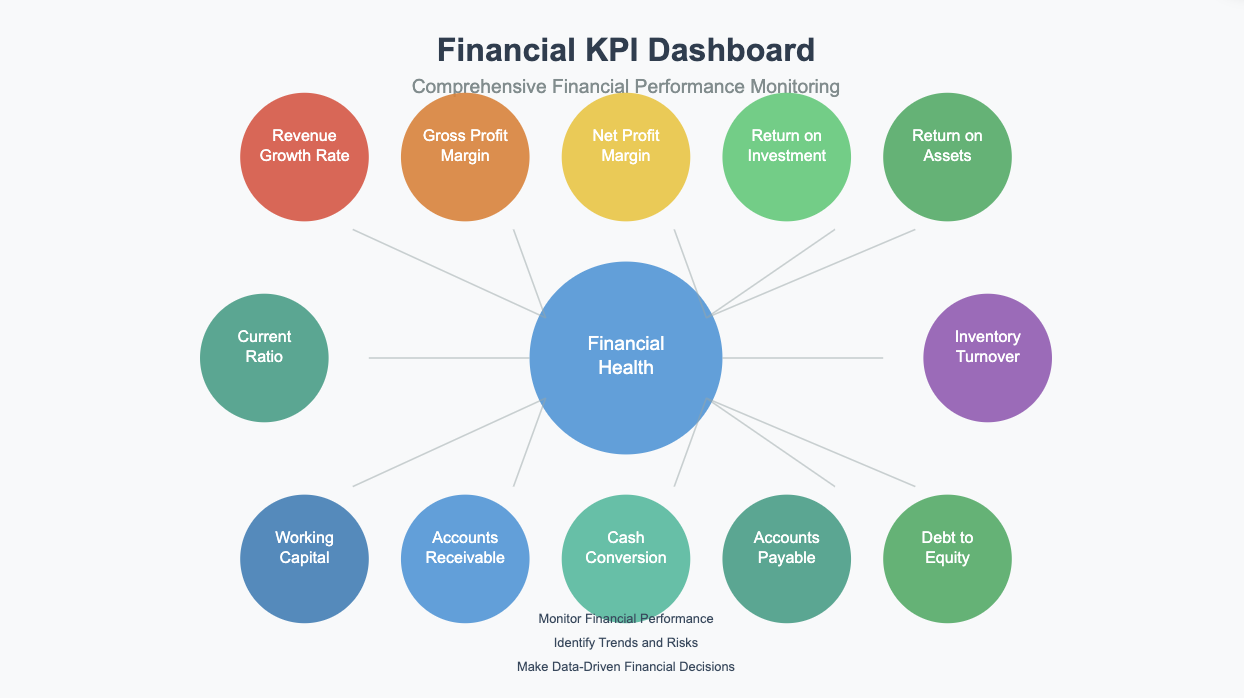
A financial KPI dashboard helps you monitor the financial health of your business by consolidating critical metrics into one platform. It provides a clear and organized view of your company’s financial performance, enabling you to make informed decisions. By tracking key financial indicators, you can identify trends, manage risks, and ensure your business stays on track to meet its financial goals.
Common metrics displayed on a financial KPI dashboard include:
Revenue growth rate
Gross profit margin
Net profit margin
Return on investment (ROI)
Current ratio
Debt-to-equity ratio
Working capital
Accounts receivable turnover
Accounts payable turnover
Inventory turnover
Cash conversion cycle
Return on assets (ROA)
These metrics provide a comprehensive view of your financial operations. For example, tracking the revenue growth rate helps you measure how quickly your business is expanding. Monitoring the current ratio ensures you maintain enough liquidity to cover short-term obligations. By analyzing these KPIs, you can identify areas for improvement and optimize your financial strategies.
A financial KPI dashboard also simplifies complex financial data through visualizations like graphs and charts. This makes it easier to interpret trends and communicate insights to stakeholders. With real-time updates, you can respond quickly to financial challenges or opportunities. A study by PwC found that companies using financial KPI dashboards reduce their financial reporting time by 50% and improve forecasting accuracy by 35%. This demonstrates the value of real-time financial insights in driving better business outcomes. Whether you’re managing cash flow or evaluating profitability, this dashboard keeps your finances under control.
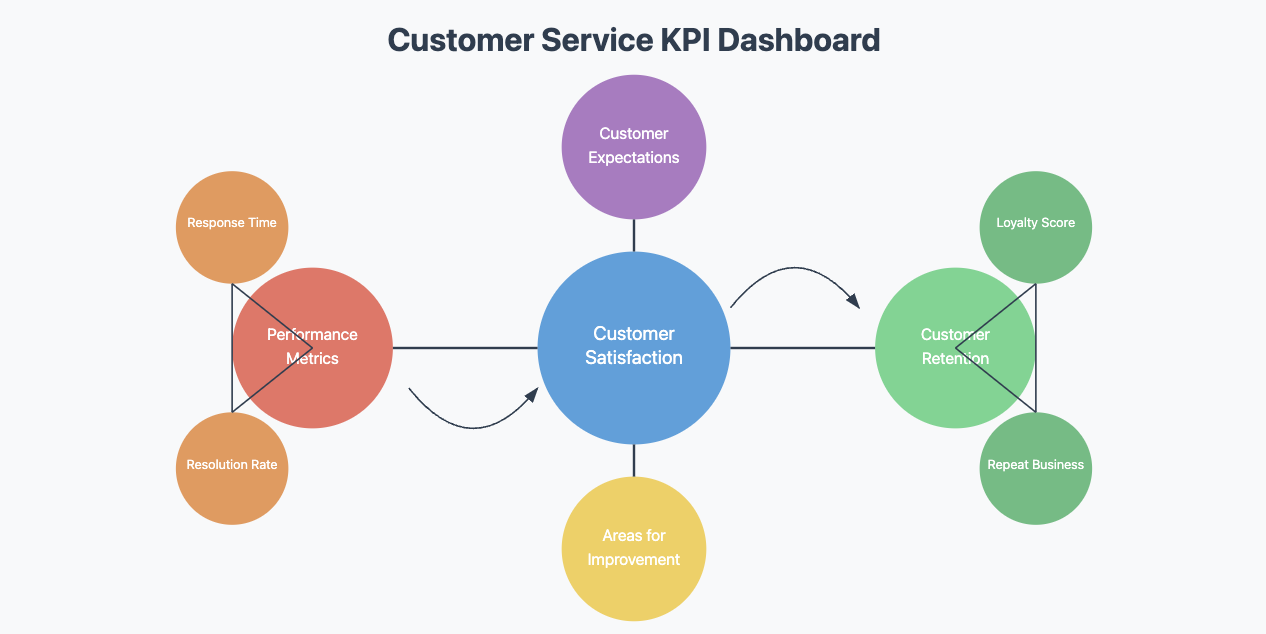
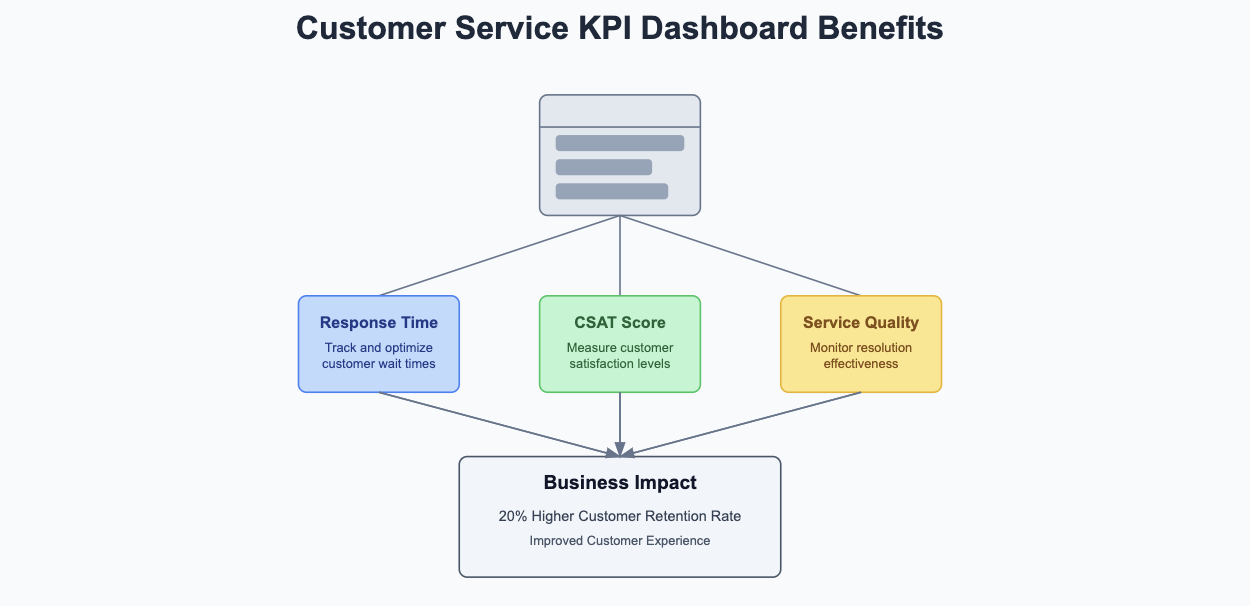
Customer Service KPI Dashboards
A customer service KPI dashboard focuses on improving customer satisfaction and retention by tracking key performance indicators related to customer interactions. It provides a centralized view of how well your team meets customer expectations, helping you identify strengths and areas for improvement.
Key metrics often included in a customer service KPI dashboard are:
Customer Retention Rate (CRR): A high CRR reflects strong customer loyalty and satisfaction.
Customer Satisfaction Score (CSAT): This metric measures how well your business meets customer expectations.
Customer-centric KPIs like CRR and CSAT are essential for understanding customer needs and behaviors. For instance, a high CSAT indicates that your team consistently delivers positive experiences, while a low score highlights areas requiring attention. Monitoring these metrics helps you enhance customer loyalty and satisfaction, which are vital for long-term success.
This dashboard also provides real-time insights into customer service performance. According to Zendesk, companies that use customer service KPI dashboards achieve a 20% higher customer retention rate. By tracking metrics like response times and customer satisfaction scores, businesses can identify areas for improvement and deliver exceptional customer experiences.
For example, it can track response times, resolution rates, and customer feedback. By addressing issues promptly, you can improve the overall customer experience. Additionally, visualizing data through charts and graphs makes it easier to share insights with your team and align efforts toward better service delivery.
A customer service KPI dashboard empowers you to create a customer-focused culture. It ensures your team stays proactive in meeting customer needs, ultimately driving satisfaction and retention.
How to Create a KPI Dashboard
Define Business Goals
Start by identifying the purpose of your KPI dashboard. Think about what you want to achieve and how the dashboard will support your business objectives. Clear goals ensure that the dashboard aligns with your priorities and provides meaningful insights. For example, if your goal is to improve sales performance, focus on metrics like conversion rates or revenue growth.
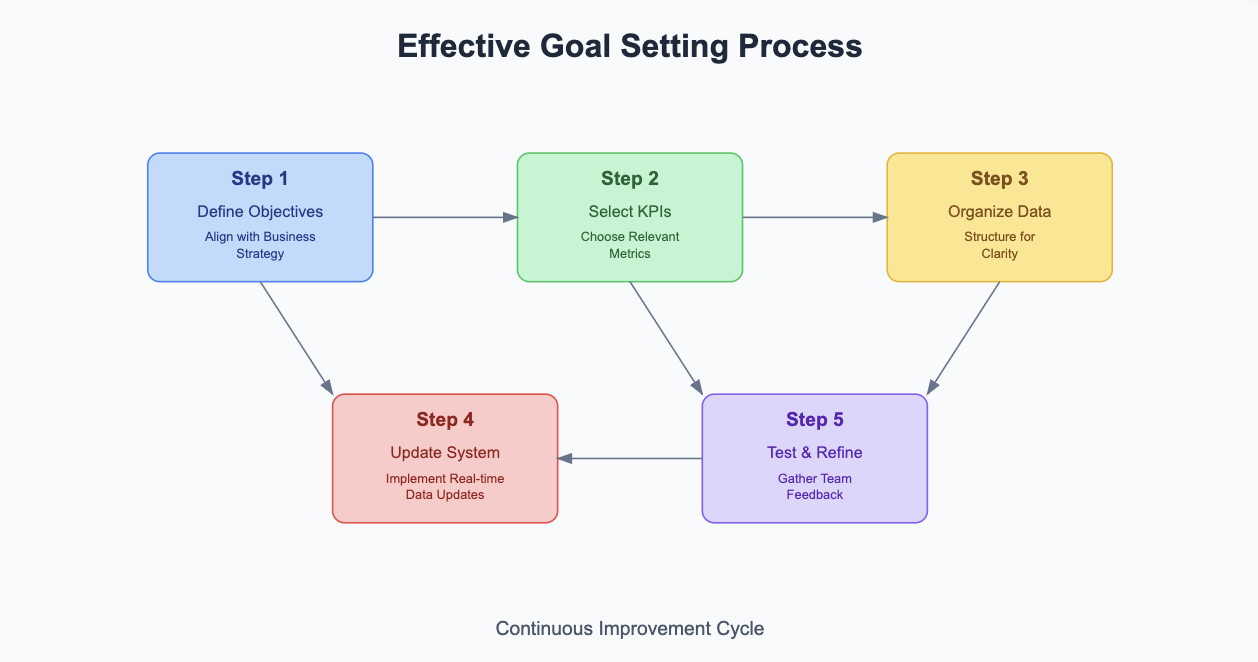
Follow these steps to define your goals effectively:
Outline your objectives and connect them to your overall business strategy.
Choose KPIs that reflect progress toward these objectives.
Organize the data for clarity and usability.
Ensure the dashboard provides real-time or regularly updated information.
Test the dashboard with your team and refine it based on feedback.
By defining your goals, you create a strong foundation for a dashboard that delivers actionable insights. A framework developed by SMART Goals emphasizes the importance of setting Specific, Measurable, Achievable, Relevant, and Time-bound (SMART) goals when designing KPI dashboards. This ensures that the dashboard metrics are aligned with actionable business outcomes.
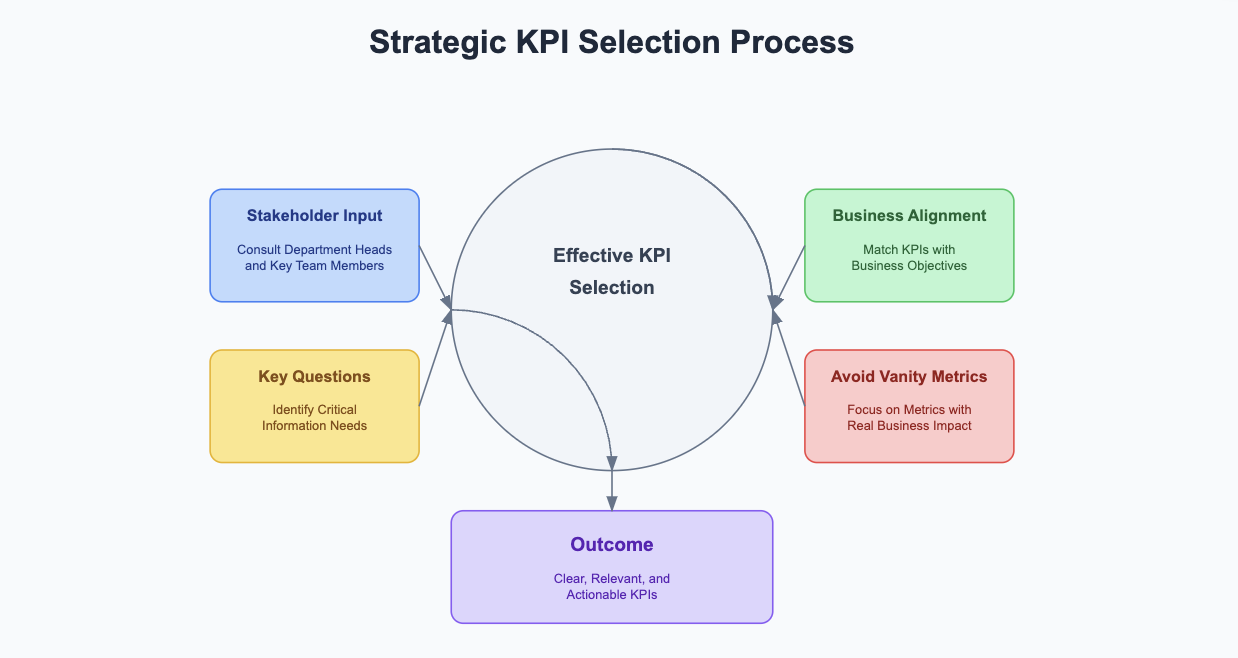
Select Relevant KPIs
Choosing the right KPIs is critical for creating an effective dashboard. Start by consulting with key stakeholders and department heads to understand their needs. This ensures the selected KPIs align with your business objectives and provide value to your team. Avoid vanity metrics that look impressive but lack real impact.
To identify relevant KPIs:
Determine the questions your team needs answered.
Focus on metrics that directly influence your goals.
Exclude unnecessary data to avoid clutter.
For instance, a marketing team might prioritize metrics like cost per lead or customer acquisition cost, while a sales team may focus on quota attainment or sales cycle length. Selecting the right KPIs ensures your dashboard remains focused and actionable.
The following table provides examples of KPIs for different departments, based on industry best practices:
Department
Key KPIs
Purpose
Sales
Total sales revenue, conversion rate, sales cycle length
Measures sales performance and efficiency.
Marketing
Cost per lead, customer acquisition cost, social media engagement
Evaluates marketing campaign effectiveness.
Operations
Production efficiency, order accuracy, downtime
Tracks operational performance and identifies bottlenecks.
Finance
Revenue growth rate, net profit margin, cash conversion cycle
Monitors financial health and liquidity.
Customer Service
Customer retention rate, customer satisfaction score, response time
Assesses customer service quality
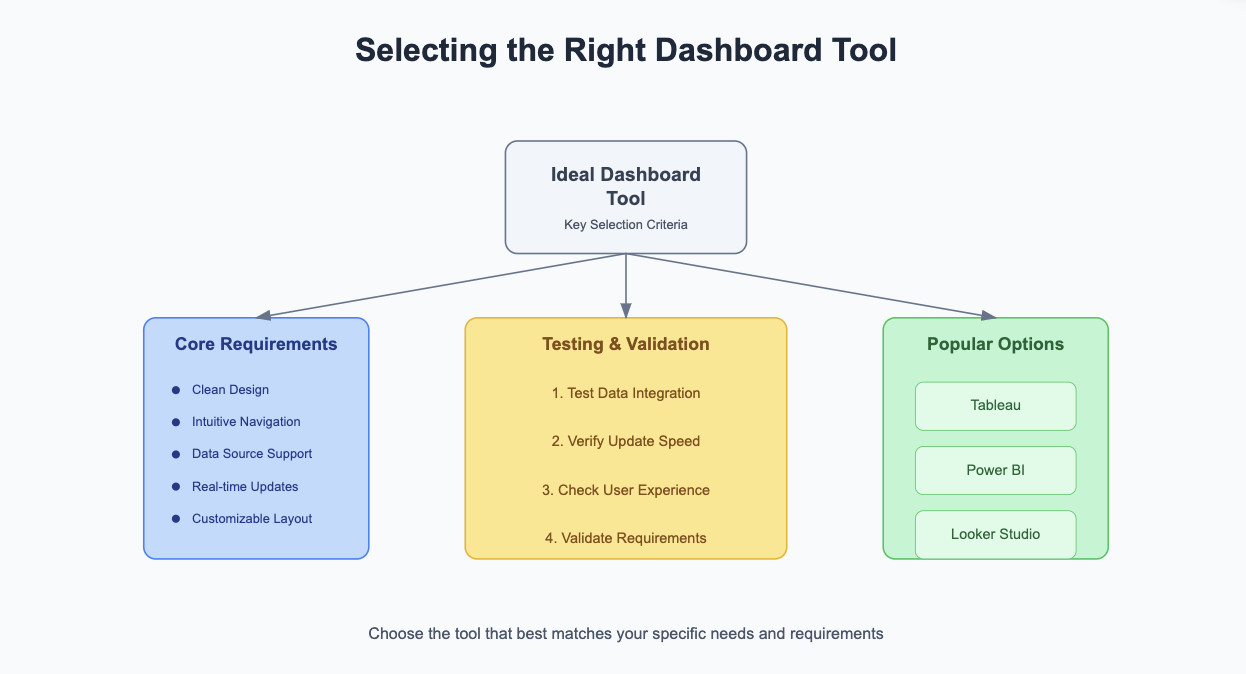
Choose the Right Dashboard Tool
Selecting the right tool is essential for building a user-friendly and effective KPI dashboard. However, when choosing the right tool, organizations should be aware of potential conflicts of interest. For example, a company may have longstanding relationships with certain software vendors, which could lead to biased decision-making in favor of those vendors' tools, even if they may not be the most suitable for the current needs of the business. Transparent evaluation criteria, such as comparing features, performance, and costs across a range of dashboard platforms, will lead to a more informed and unbiased decision.
Look for tools that offer a clean design, intuitive navigation, and compatibility with your data sources. Popular options include Tableau, Power BI, and FineBI, which provide robust features for data visualization and integration.
When choosing a tool, consider these factors:
Ensure the tool supports your data sources and updates in real time.
Opt for a platform with customizable layouts to match your needs.
Test the tool’s usability to confirm it meets your team’s requirements.
For example, Databox centralizes data from multiple sources and offers easy-to-use visualizations. A well-chosen tool simplifies the process of creating and maintaining your dashboard, ensuring it remains a valuable asset for your business.
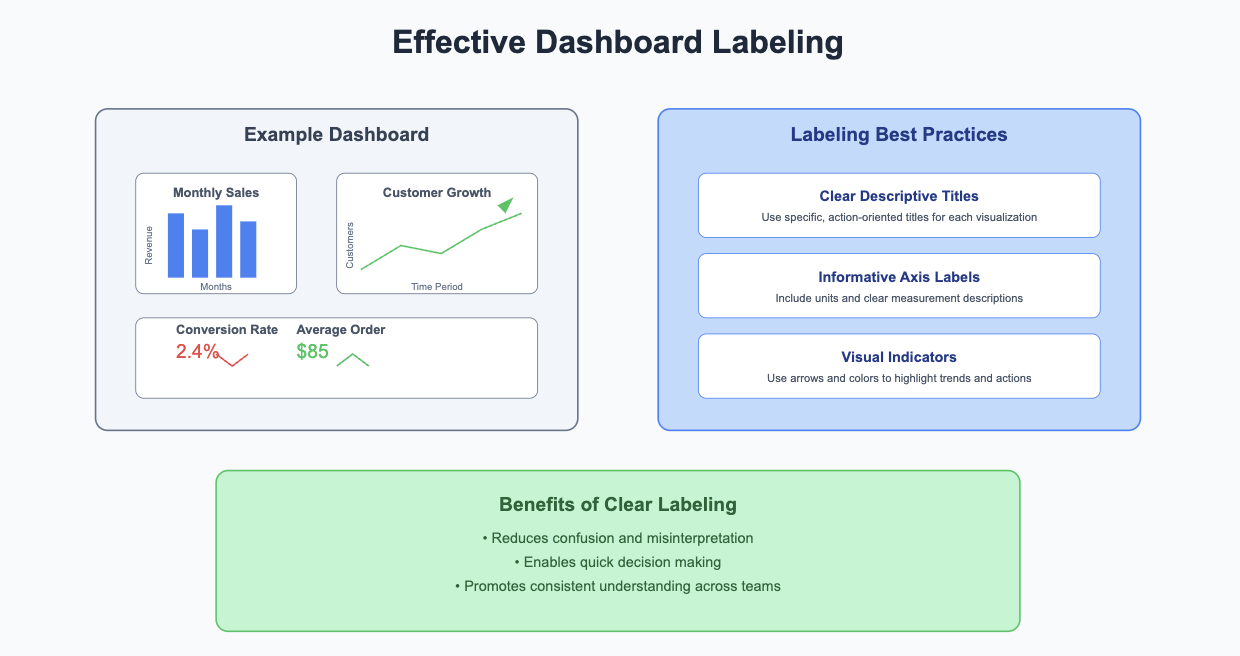
Design an Intuitive Layout
An intuitive layout is essential for making your KPI dashboard easy to use and understand. Start by organizing your KPIs in a logical flow, similar to how chapters are arranged in a book. This structure helps users navigate the dashboard effortlessly. Creating a mind map can also help you visualize the relationships between different KPIs and determine their order.
To enhance usability, ensure the dashboard is glanceable. Use appropriate text sizes, colors, and chart types to make key information stand out. For example, larger fonts can highlight critical metrics, while contrasting colors can differentiate data categories. Avoid clutter by removing unnecessary elements and misleading charts. A clean design reduces cognitive barriers and allows users to focus on the most important insights.
Clear labels are another crucial element. Each visualization should have descriptive titles and axis labels to eliminate confusion. Incorporating actionable indicators, such as arrows or trend lines, can prompt users to take specific actions based on the data. For instance, a downward arrow next to a KPI might signal the need for immediate attention.
By following these best practices, you can create a dashboard that simplifies visualizing KPIs and supports effective decision-making. A well-designed layout ensures users can quickly interpret data and stay aligned with business goals.
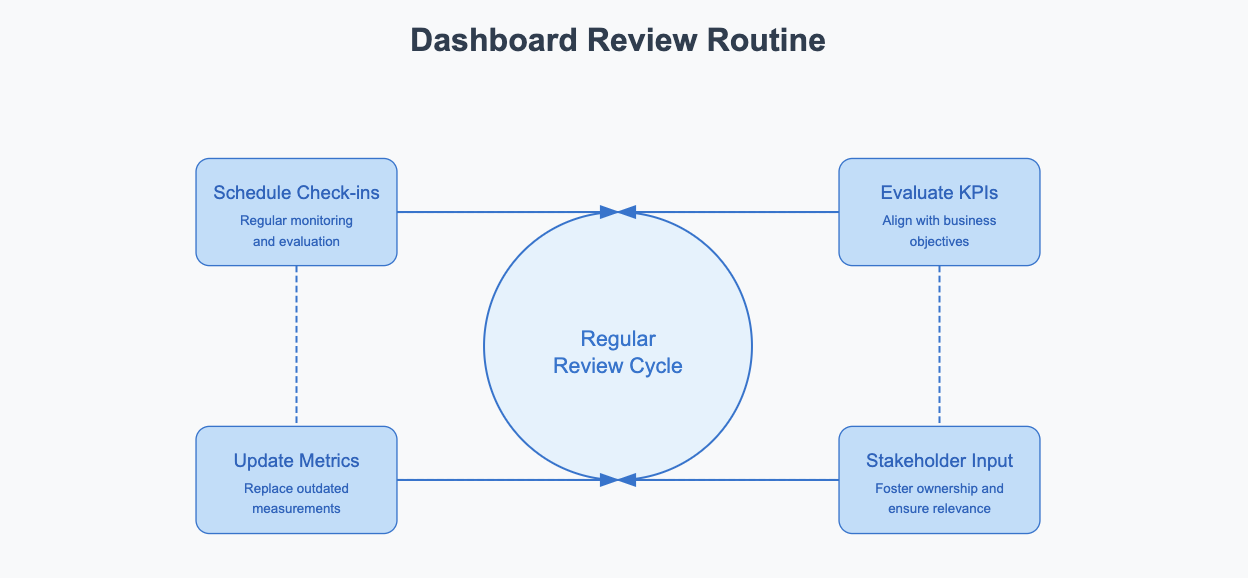
Monitor and Optimize Regularly
Regular monitoring and optimization keep your KPI dashboard relevant and effective. The frequency of updates depends on the metrics you track and your organizational needs. For example, real-time or daily updates are crucial for metrics like sales figures or website traffic. In contrast, quarterly financial performance may only require weekly or monthly updates.
Establishing a routine for reviewing your dashboard ensures it remains accurate and actionable. Schedule regular check-ins to evaluate whether the KPIs still align with your business objectives. If a metric no longer provides value, replace it with one that better reflects your goals. Involving stakeholders in this process fosters ownership and ensures the dashboard meets user needs.
Optimization also involves refining the dashboard’s design and functionality. Analyze user feedback to identify areas for improvement. For instance, if users find a chart confusing, consider simplifying it or using a different visualization method. Regular updates to the dashboard’s layout and features enhance its usability and effectiveness.
By monitoring and optimizing your dashboard, you ensure it continues to provide meaningful insights. A case study from Netflix illustrates the importance of continuous optimization. By regularly updating its KPI dashboards to reflect changing business priorities, Netflix has been able to maintain its position as a leader in the streaming industry. This proactive approach ensures that the company stays ahead of market trends and customer preferences. This proactive approach helps you stay ahead of challenges and make data-driven decisions that drive success.
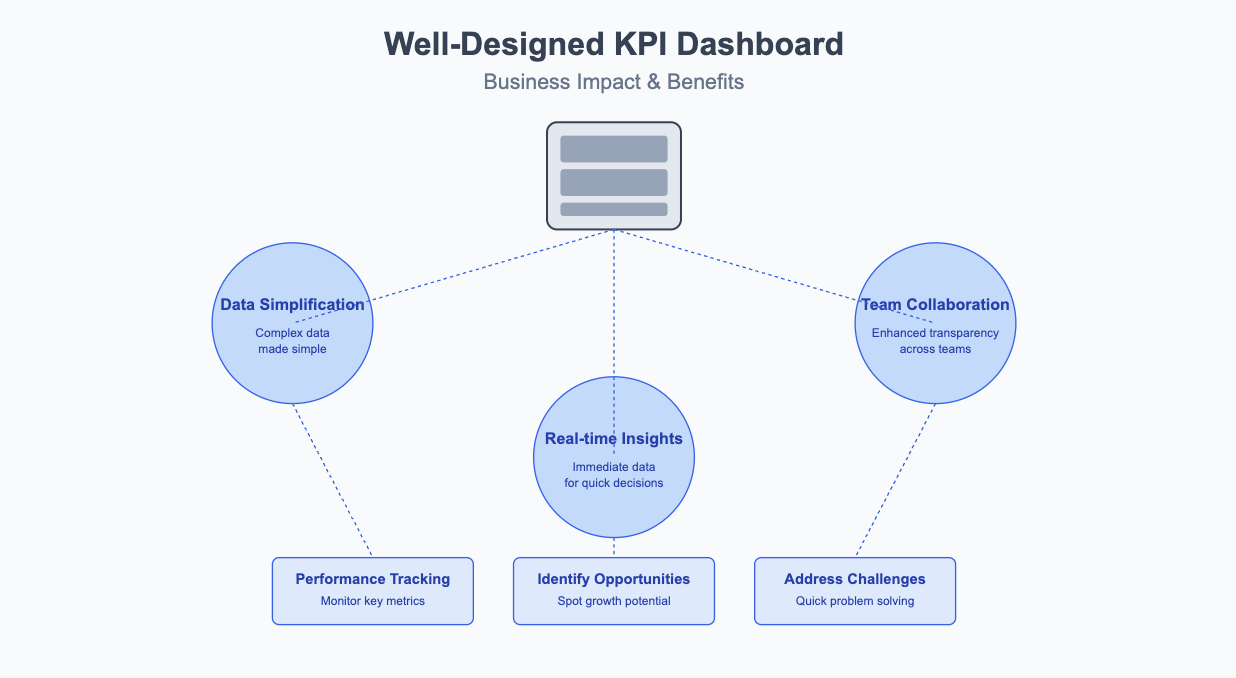
A well-designed KPI dashboard is a game-changer for your business. It simplifies complex data, enabling you to make informed decisions based on real-time insights. By centralizing key metrics, it fosters collaboration and transparency across teams. You can track performance, identify opportunities, and address challenges quickly, ensuring your business stays on course.
Businesses that adopt KPI dashboards often experience improved accountability and operational efficiency. By incorporating advanced tools like FineBI and FineReport, organizations can further enhance operational efficiency, automate reporting processes, and visualize performance metrics in real time. These tools empower teams with actionable insights that align with strategic goals, driving better business outcomes.
For example, e-commerce companies use them to monitor conversion rates, while manufacturers track production efficiency. These tools connect daily activities to strategic goals, helping you align your team with your company’s vision. Start leveraging a KPI dashboard today to unlock your business’s full potential.
FAQ
What is the main purpose of a KPI dashboard?
A KPI dashboard helps you track and visualize key performance indicators. It simplifies data analysis by presenting metrics in visual formats like charts and graphs. This tool enables you to monitor progress, identify trends, and make informed decisions quickly.
How do I choose the right KPIs for my dashboard?
Focus on metrics that align with your business goals. Consult with your team to identify the most relevant KPIs. Avoid vanity metrics that do not provide actionable insights. Choose indicators that directly impact your objectives and help measure success effectively.
Can I customize a KPI dashboard for my business?
Yes, most KPI dashboards offer customization options. You can tailor layouts, visuals, and metrics to suit your specific needs. This flexibility ensures the dashboard aligns with your goals and provides meaningful insights for your team.
How often should I update my KPI dashboard?
Update your dashboard based on the metrics you track. For real-time data like sales or website traffic, frequent updates are essential. For long-term metrics like quarterly financials, weekly or monthly updates may suffice. Regular reviews ensure accuracy and relevance.
What tools can I use to create a KPI dashboard?
Popular tools include Tableau, Power BI, and Looker Studio. These platforms offer robust features for data visualization and integration. Choose a tool that supports your data sources, provides real-time updates, and allows for easy customization.
Click the banner below to experience FineDataLink for free and empower your enterprise to convert data into productivity!