Have you ever thought about how big brands change their marketing so fast? An internet marketing dashboard lets you see all your key data in one spot. This tool helps you watch social media reactions and check how people interact. You can also change your plans quickly. Big companies like Nike use dashboards to see results right away and make better choices. With dashboard internet marketing, you get the info you need to help your business do better every day.
What Is an Internet Marketing Dashboard?
Core Purpose and Functionality
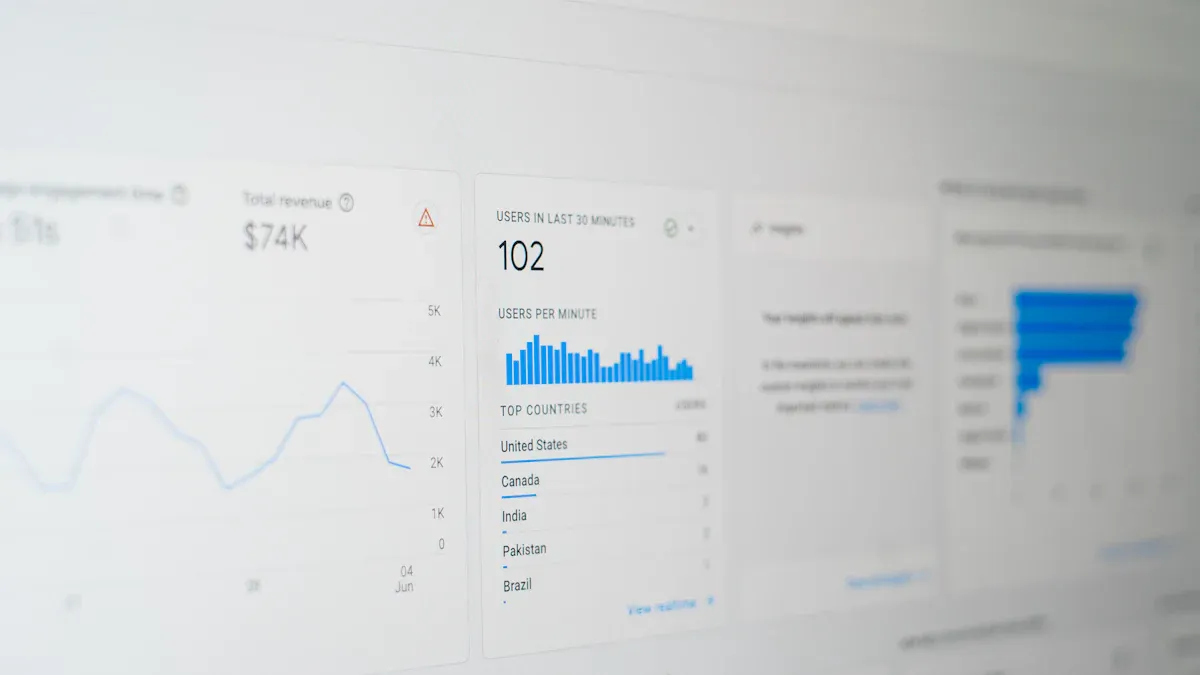
An internet marketing dashboard gives you a single place to see all your marketing data. You do not need to jump between different tools or spreadsheets. You can track your campaigns, website visits, social media, and sales in one view. This makes your work easier and faster.
You use an internet marketing dashboard to understand how people find your business and what they do next. You can see which ads bring in leads, which leads turn into sales, and how much money each campaign makes. This helps you know what works and what does not.
Here are the main things an internet marketing dashboard does for you:
- It brings together data from all your digital channels, so you can see the whole customer journey.
- You spot problems quickly and fix them before they grow.
- You connect sessions, leads, and sales, so you know which marketing efforts help your business most.
- You make decisions based on facts, not guesses.
You get real-time updates on your marketing. This means you can see trends as they happen. If something changes, you can act fast. You do not have to wait for weekly or monthly reports. You can adjust your campaigns right away.
A marketing dashboard also helps your team work better. Everyone sees the same numbers. You can share results and set goals together. This builds trust and keeps everyone focused.
You move from guessing to knowing. You see what works and what does not. You can spend your budget on the best channels. You can stop wasting money on things that do not help.
How FineReport Support Dashboard Internet Marketing
FineReport gives you strong tools for dashboard internet marketing. You can build interactive dashboards that show your key numbers in real time. You do not need to be a tech expert. You can drag and drop charts, tables, and graphs to create your own view.
FineReport connects to many data sources. You can pull in data from your website, social media, and sales systems. You can see everything in one place. This helps you spot trends and make better choices.
Here is a table that shows how FineReport helps you with your internet marketing dashboard:
| Feature | Description |
|---|---|
| Dashboard Creation | You can quickly build dashboards by dragging and dropping charts and tables. |
| Data Analysis | You can get data from many databases and do calculations across different reports. |
| Multi-Datasource Connection | You can connect to many data sources for a full view of your marketing. |
| Mobile Terminal Report Display | You can check your dashboards on your phone or tablet, with fast loading and easy use. |
You can use FineReport on your computer or mobile device. This means you can check your marketing dashboard anywhere. You can see your numbers at your desk or on the go.
FanRuan and FineReport stand out because they focus on making your work easier. You get a flexible tool that fits your needs. You can use it for digital marketing dashboard projects in many industries. You can trust the numbers you see and share them with your team.
If you want to improve your marketing, you need the right marketing dashboard tools. FanRuan and FineReport help you see your data, act fast, and reach your goals.
Why Use a Internet Marketing Dashboard?
Key Benefits for Marketers
You want to know what works in your marketing. An internet marketing dashboard helps you do this. You see all your data in one place. You do not need to open many tabs. You do not have to search through emails. You get a clear view of your marketing performance dashboard every day.
A marketing dashboard helps you track important numbers. You can see website visits, leads, and sales. You can find out which channels work best. You can spot trends and problems fast. This saves you time and helps you make better choices.
Here is a table that shows the main benefits you get from using an internet marketing dashboard:
| Benefit | Description |
|---|---|
| Increased Return On Investment | You target your campaigns better and track results, so you get more value for your money. |
| More Efficient Marketing Channels | You find out which channels work best and put your budget where it matters most. |
| Improved Customer Insights | You learn what your customers want, so you can make them happier and improve your products. |
A digital marketing dashboard brings all your data together. You do not have to guess which campaign works. You see the facts. You can measure your conversion rate. You know which ads turn visitors into buyers. You can also track your marketing ROI. You see how much each campaign earns.
A marketing analytics dashboard lets you set goals and measure progress. You can share results with your team. Everyone stays on the same page. You can use interactive dashboards to look deeper into your data. You can click on charts and see more details. This helps you understand your conversion funnel and find ways to improve.
A marketing kpi dashboard helps you focus on what matters. You can track performance metrics like sales, leads, and website visits. You can see if you reach your goals. You can change your plan if something does not work.
FineReport makes this process easy. You can connect data from many sources. You can build custom dashboards that fit your needs. You can use marketing dashboard tools to track every part of your marketing. You get the full picture.
Real-Time Insights for Better Decisions
You need to act fast in digital marketing. Trends change quickly. A real-time internet marketing dashboard gives you the latest numbers. You do not have to wait for weekly reports. You see what happens as it happens.
FineReport gives you real-time insights to help you make smart choices. You can watch your campaign performance live. If you see a problem, you can fix it right away. You do not waste time or money.
Here is a table that compares digital marketing dashboards to traditional reports:
| Feature/Benefit | Digital Marketing Dashboards | Traditional Marketing Reports |
|---|---|---|
| Data Tracking | Real-time | Historical |
| Efficiency | High | Moderate |
| Insights | Immediate | Delayed |
A marketing dashboard lets you see the whole customer journey. You can track users from the first click to the final sale. You can spot where people drop off in the conversion funnel. You can test new ideas and see results right away.
FineReport helps you make decisions using data. You can use real-time insights to change your ads, emails, or social posts. You can see which messages work best. You can stop what does not work and try something new.
You can use a marketing dashboard to track your return on investment. You can see how much you spend and how much you earn. You can use this data to plan your next steps.
A marketing dashboard also helps you work better with your team. Everyone sees the same numbers. You can set goals together and celebrate wins. You can use the dashboard internet marketing approach to stay ahead of your competition.
FineReport gives you the tools to build interactive dashboards. You can track key marketing metrics and see real-time changes. You can use these insights to grow your business.
You can set up your marketing dashboard to show the numbers that matter most to you. You can track website visits, leads, sales, and more. You can use FineReport to create dashboards for any industry.
A marketing dashboard is not just a tool. It is your guide to better marketing. You get real-time insights, clear data, and the power to make smart choices every day.
Essential Features of a Internet Marketing Dashboard
Must-Have Metrics and KPIs
You need to watch the right numbers to use your internet marketing dashboard well. Important metrics help you see how your marketing is doing. You can count website visits, leads, sales, and conversion rate. You can also check campaign performance and customer engagement. These numbers show where your marketing works and where you can do better.
Here are some features your marketing dashboard should have:
- Website traffic and sources
- Conversion funnel steps
- Conversion rate
- Campaign performance
- Customer engagement
- Sales and revenue
- Cost per lead
- Return on investment
- Social media activity
A marketing performance dashboard lets you see these numbers live. This helps you make smart choices and change your plan fast. You can spot trends and problems early. You can set goals and check progress with performance metrics.
FineReport’s Customization and Integration
FineReport gives you strong marketing dashboard tools to build interactive dashboards. You can connect data from many places and see it all together. The drag-and-drop interface makes building dashboards simple. You do not need special skills to make visualizations.
FineReport supports different chart types. You can show your data in tables, graphs, or maps. You can use plugins for time and location visualization. This helps you study marketing results across time and place. You can also make self-service dashboards. Your team can build reports and look at data without waiting for IT help.
Here is a table that shows how FineReport helps with dashboard internet marketing:
| Feature | Description | Application Areas |
|---|---|---|
| Integration of Data Sources | Brings many data sources into dashboards for live monitoring. | Businesses needing to bring together marketing metrics from different tools. |
| Drag-and-Drop Interface | Makes dashboard building easy for users. | Users wanting a simple way to make visualizations without special skills. |
| Various Chart Types | Supports many chart types for different data views. | Marketing teams needing to see data in different ways for better insights. |
| Geographic and Temporal Visualization | Plugins for better data views across time and place. | Organizations needing detailed time and location analysis for marketing plans. |
| Self-Service BI Capabilities | Lets users make their own reports and dashboards. | Teams wanting to study data on their own without IT help. |
You can use FineReport to track digital marketing metrics and build dashboards for any industry. You get live updates and clear insights. You can share results with your team and make smarter choices every day.
Who Needs an Internet Marketing Dashboard?
Roles and Teams That Benefit
An internet marketing dashboard makes your job easier and smarter. Many people on your team use this tool. You can see how your campaigns do and find ways to improve. Here are some roles that benefit most:
- Digital marketing managers watch campaigns and change plans.
- Content writers check if their posts bring traffic and engagement.
- SEO specialists use a seo dashboard to track search rankings and website visits.
- Marketing strategists plan new campaigns using clear data.
- Marketing analysts look at numbers to spot trends and patterns.
Your IT team and business managers also use marketing dashboard tools. They connect data sources and keep things running well. You see how your team works together and shares results.
A marketing dashboard helps you analyze data and track performance. You improve strategies and report insights to your team. You spot patterns and unusual things in your marketing performance dashboard. You make guesses and test ideas. You use data to make smart choices. You keep getting better as you learn more.
Use Cases Across Industries
Many industries use internet marketing dashboard solutions. Each industry uses dashboards to fix problems and reach goals. Here is a table showing common use cases:
| Dashboard Type | Use Case Description |
|---|---|
| Ecommerce Dashboard | You see revenue, customer behavior, and funnel efficiency for online stores. |
| SaaS Dashboard | You track recurring revenue, customer retention, and subscription efficiency. |
| B2B Marketing Dashboard | You connect marketing activity to the sales pipeline, from lead generation to closed-won revenue. |
You use dashboard internet marketing to get real-time insights. You see results right away. You change your campaigns quickly. You use digital dashboards to track sales, customer engagement, and website visits. You build interactive dashboards for your team. You share results and set goals together.
A marketing dashboard works for any industry. You use it to track key metrics and make your business better. You make smarter choices every day.
Setting Up Your Internet Marketing with FineReport
Step-by-Step Implementation
You can make your marketing dashboard with FineReport by following easy steps. First, connect your data sources. FineReport lets you bring in website analytics, social media, and sales data. This helps you see the whole customer journey. Next, pick the most important numbers for your business. Focus on things like click-through rate, conversion rate, and sales. Build your dashboard using drag-and-drop tools. Add charts, tables, and maps to show your data in a clear way. FineReport gives you real-time customer data, so you always see the newest numbers.
You can change your marketing dashboard to fit your team’s needs. For example, a digital marketing manager may want to see campaign results. An SEO specialist might want a seo dashboard with rankings and traffic. FineReport makes it simple to share dashboards with your team. You can use your dashboard internet marketing tools on any device, like phones or tablets.
Best Practices and Pitfalls
To get the best results from your internet marketing dashboard, follow some smart tips. Always choose a small set of KPIs. Too many numbers can make your dashboard hard to read. Use clear pictures and charts that show trends and important facts. Update your dashboard often. Treat it like a tool you use every day, not just once.
Watch out for common mistakes. Some teams add too many numbers instead of picking key performance indicators. Others use bad charts that hide important details. If you do not track things the same way each time, your data may not be right. Using only big totals can hide small problems. Do not think your dashboard is done after you make it. Keep making it better as your business changes.
FineReport helps you with training and getting started. You get help setting up your marketing dashboard tools and learning how to use real-time data for checking performance. You can track the whole customer journey, from first visit to sale, and use your marketing kpi dashboard to make smart choices.
You get clear benefits when you use an internet marketing dashboard for your digital campaigns:
- Enhanced visibility helps you see your marketing work easily.
- Increased efficiency saves time by showing all metrics together.
- Real-time customer data lets you understand behavior and lead generation.
- Better decision-making comes from easy-to-find data and quick insights.
- KPI monitoring keeps your goals in sight.
Try FineReport to help your business make smarter choices and get useful insights.


FAQ

The Author
Lewis Chou
Senior Data Analyst at FanRuan
Related Articles

How to Build an Investment Portfolio Reporting Dashboard for Executives: KPIs, Benchmarks, and Drill-Down Views
Investment portfolio reporting for executives is not about showing every holding, transaction, and chart your investment team can produce. It is about giving CEOs, CFOs, CIOs, boards, and investment committees a fast, re
Yida YIn
Jun 25, 2026

12 KPI Reporting Examples for Executive Dashboards: What to Show in Weekly, Monthly, and Quarterly Reviews
Executive leaders do not need more data. They need decision ready $1 examples that match how often they review the business and what actions they are expected to take. A weekly $1 should surface fast moving risks and per
Yida YIn
Jun 25, 2026

How to Build a Digital Marketing Reports Dashboard: Executive Examples, KPIs, and Templates
A $1 is the control layer that helps executives and marketing leaders turn scattered channel data into fast, confident decisions. If you are a CEO, CMO, operations director, or marketing analytics lead, the real problem
Yida Yin
May 07, 2026