Enterprise leaders rarely struggle to understand why master data management matters. The harder question is whether the investment will produce measurable business value. If your organization is considering an MDM initiative, the real decision is not just about data quality. It is about whether better control of customer, product, supplier, finance, or location data can improve revenue, reduce operating cost, lower risk, and support faster execution.
That is why measuring the return on investment of master data management must go beyond technical indicators such as match rates, completeness scores, or duplicate reduction. Those are important, but they are not enough for executive funding decisions. Leaders need a framework that connects master data improvement to business outcomes.
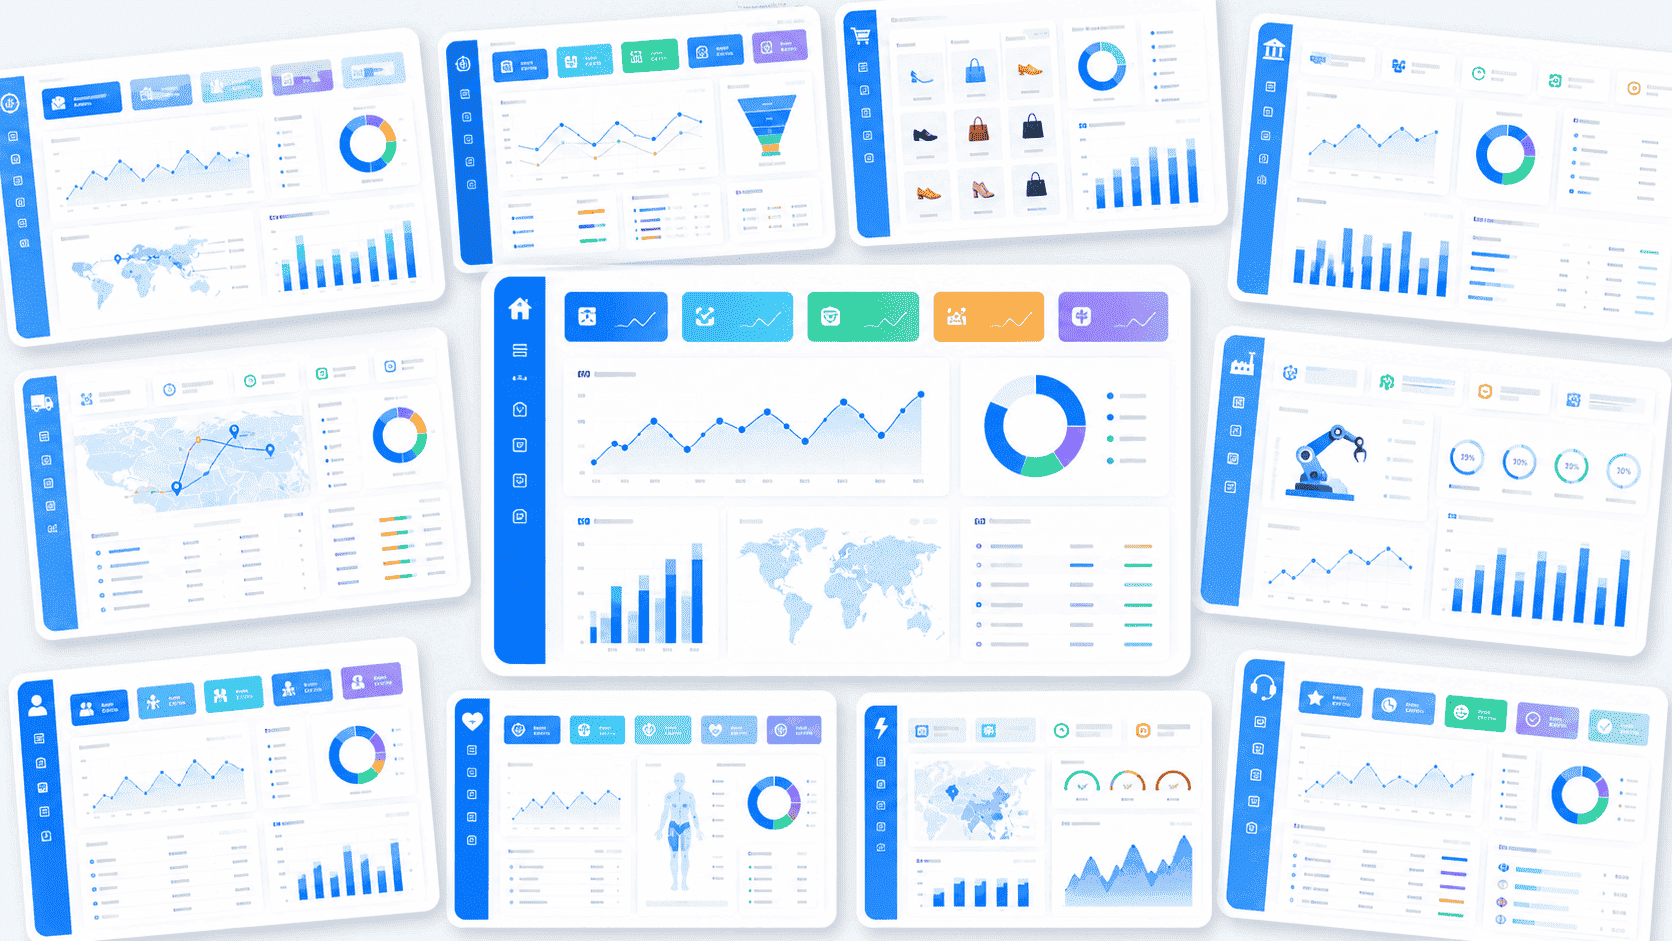
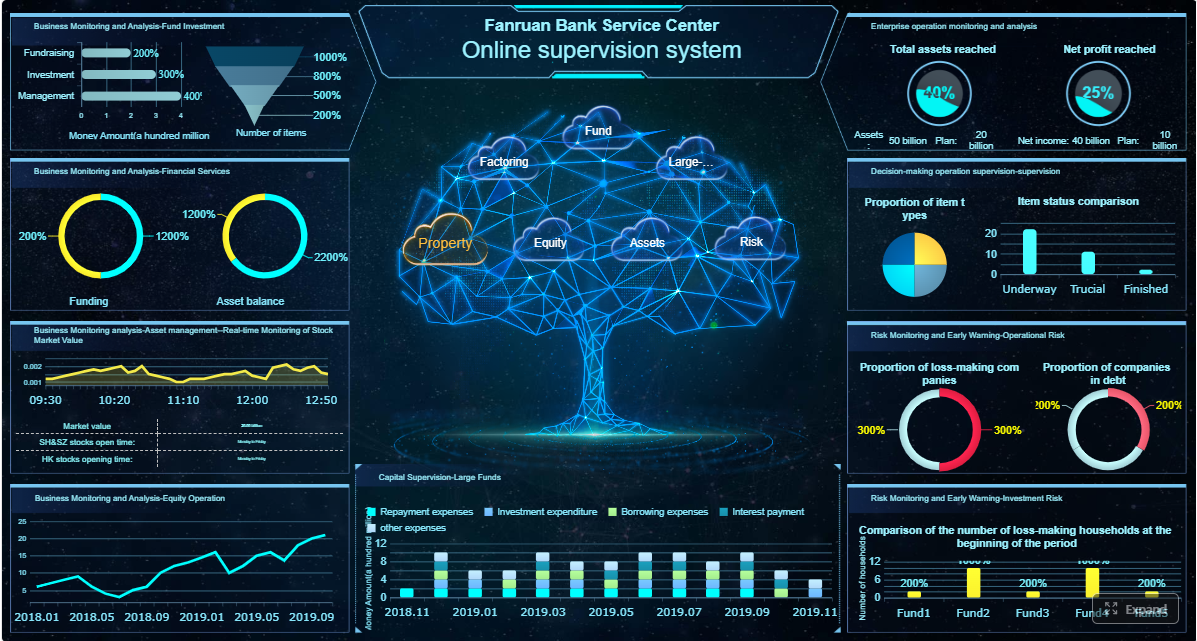
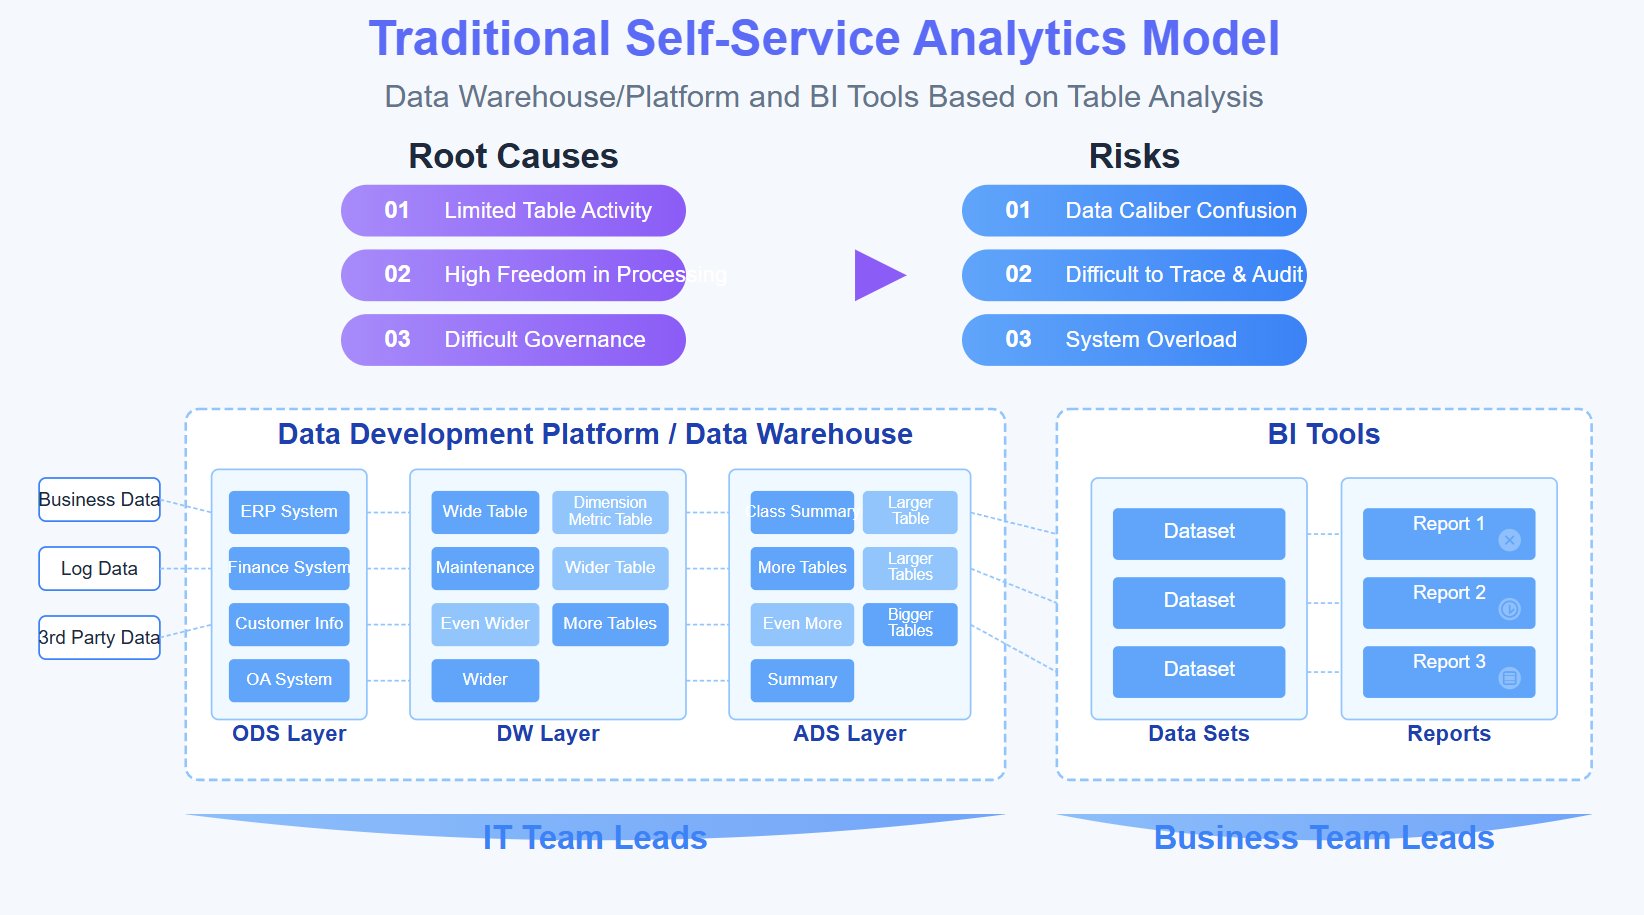
With FineBI + Dora, business users can ask for analysis in chat, generate chart-based answers or dashboard-style views from trusted BI assets, and receive scheduled summaries before the next meeting. That matters because MDM ROI is often hard to prove when business teams cannot easily see the impact across sales, operations, finance, compliance, and service processes.
 Click To Try The Dashboard
All dashboards in this article are built with FineBI
Why the Return on Investment of Master Data Management Matters
A master data management program usually competes for budget with ERP upgrades, analytics projects, automation, AI initiatives, and front-office transformation. Without a clear business case, MDM can be viewed as a back-office data cleanup effort rather than a strategic enabler.
For enterprise leaders, ROI measurement matters for three reasons:
- It justifies investment with business language, not only technical language.
- It aligns data work with enterprise priorities such as growth, resilience, compliance, and margin improvement.
- It creates accountability across IT, operations, finance, and business owners.
A strong ROI model helps leadership answer practical questions:
- Will better customer master data improve campaign conversion or retention?
- Will cleaner product and supplier data reduce order errors and procurement delays?
- Will governed master data reduce audit effort and compliance exposure?
- Will standardized data improve the speed and quality of management decisions?
This is also where many programs fail. Teams often report technical success metrics, such as:
- percentage of duplicate records removed
- number of records standardized
- number of systems integrated
- completion of governance workflows
Those metrics show delivery progress. They do not automatically show business value. Business value outcomes look different:
- reduced order fallout
- fewer billing disputes
- lower manual reconciliation cost
- faster onboarding time
- improved cross-sell conversion
- shorter reporting cycle
- fewer compliance incidents
The return on investment of master data management becomes credible when you can trace a line from data improvement to operational change, then from operational change to financial impact.
Build a Practical ROI Framework Before You Measure
A useful MDM ROI model does not start after implementation. It starts before the program goes live, when expectations, baseline conditions, and measurement ownership are defined.
Define the business objectives behind the initiative
Every MDM program should begin with a clear business purpose. If the goal is vague, the ROI will also be vague.
Common objectives include:
- improving customer experience through a single customer view
- reducing supply chain disruption through cleaner product and supplier data
- strengthening compliance over regulated or sensitive records
- accelerating decision-making through more trusted reporting inputs
- supporting digital transformation and system consolidation
The key is to translate each objective into a measurable business effect.
For example:
-
Customer experience objective: unify customer records across channels
Expected business effect: fewer service delays, better segmentation, higher retention -
Supply chain objective: standardize product and vendor master data
Expected business effect: fewer procurement errors, faster replenishment, lower rework -
Compliance objective: improve governance over legal entities, financial codes, or regulated data
Expected business effect: lower audit effort, reduced control failures, stronger traceability
FineBI helps organizations define and monitor these business outcomes through governed dashboards, while Dora can turn those same metrics into an enterprise Data Agent workflow for leadership review, operational follow-up, and periodic status communication.
Establish the baseline and scope
You cannot measure ROI if you do not know the starting point. Before implementation, document the current state in operational and financial terms.
Baseline inputs may include:
- duplicate customer, supplier, or product records
- order errors caused by inconsistent master data
- manual hours spent on reconciliation or correction
- reporting delays caused by inconsistent codes or hierarchies
- revenue leakage from poor account visibility
- audit findings linked to weak data control
- cycle time for onboarding products, suppliers, or customers
A strong baseline should answer three questions:
- What data issue exists?
- What process problem does it create?
- What is the financial impact of that problem?
For example:
- duplicate customer records may cause fragmented account visibility
- fragmented visibility may reduce cross-sell effectiveness
- reduced cross-sell effectiveness may create missed revenue opportunities
Scope matters too. A global, enterprise-wide MDM program may deliver broad long-term value, but its ROI can be hard to isolate early. Many organizations get better results by starting with a high-value domain such as customer, product, or supplier master data in one region or business unit.
Choose the right time horizon and stakeholders
MDM rarely produces full value in one quarter. Some gains appear quickly, such as reduced manual reconciliation. Others take longer, such as revenue lift, control improvements, or process standardization.
Set a realistic measurement horizon, such as:
- 0-6 months: implementation cost, adoption, early efficiency gains
- 6-12 months: process improvements, reduced rework, reporting speed
- 12-24 months: revenue impact, stronger governance, downstream transformation benefits
Stakeholder alignment is essential. ROI should not be defined only by IT.
Include:
- Finance to validate benefit logic and financial conversion
- Operations to confirm workflow impact
- IT and data teams to define data lineage, scope, and quality metrics
- Business owners to confirm usage, adoption, and outcome relevance
- Compliance or risk leaders when regulated data is involved
Identify the Core Value Drivers of MDM
The return on investment of master data management usually comes from three categories: growth, efficiency, and risk reduction. The exact balance depends on the use case and data domain.
Revenue and growth impact
MDM can drive growth when trusted master data improves how the business sells, serves, launches, or retains.
Common revenue drivers include:
- better cross-sell and upsell through a unified customer view
- improved customer retention through cleaner service and account data
- faster product launches with better product data governance
- more accurate pricing, segmentation, and channel execution
- quicker market response due to consistent hierarchies and definitions
Key ROI KPIs for growth
-
Cross-sell conversion rate: Percentage of customers buying additional products or services.
Business value: Shows whether unified customer master data improves account visibility and targeting.
AI use: Dora can retrieve this KPI through chat, compare periods or segments, and include it in a scheduled leadership briefing. -
Customer retention rate: Percentage of customers retained over a given period.
Business value: Reflects whether consistent customer records support better service continuity and proactive engagement.
AI use: Dora can summarize retention trends, flag abnormal churn segments, and push follow-up insights to account owners. -
Time to market for new products: Time required to onboard and launch a product across systems and channels.
Business value: Measures whether cleaner product master data reduces delay and improves growth agility.
AI use: Dora can generate a chart-based answer showing launch cycle trends by business unit and identify bottlenecks.
Cost savings and productivity gains
This is often the easiest category to quantify early. Many MDM programs produce visible savings through error reduction and less manual work.
Common cost-saving drivers include:
- fewer duplicate records
- reduced data correction effort
- lower manual reconciliation workload
- fewer order entry or billing errors
- less time spent searching for trusted records
- faster reporting and close cycles
- reduced process bottlenecks across systems
Key ROI KPIs for efficiency
-
Duplicate record rate: Percentage of records identified as duplicates within a master domain.
Business value: Indicates avoidable process friction, inaccurate reporting, and wasted labor.
AI use: Dora can retrieve duplicate trends, correlate them with operational issues, and include alerts when thresholds worsen. -
Manual reconciliation hours: Staff time spent resolving mismatched records or conflicting identifiers.
Business value: Converts data inconsistency into measurable labor cost.
AI use: Dora can summarize reconciliation trends by process or team and support weekly exception reviews. -
Order or invoice error rate: Percentage of transactions requiring correction due to bad master data.
Business value: Links MDM quality directly to service cost, delay, and customer satisfaction.
AI use: Dora can surface where error rates are rising and generate a dashboard-style analysis view for operations managers. -
Reporting cycle time: Time required to prepare recurring management or operational reports.
Business value: Demonstrates whether governed master data speeds analysis and decision-making.
AI use: Dora can prepare periodic reporting summaries from FineBI assets and reduce friction for business users who need timely updates.
Risk, compliance, and governance benefits
Some leaders underestimate this category because the financial value is less direct. But for regulated industries or complex enterprises, risk reduction can be one of the strongest value drivers.
Common risk-related benefits include:
- fewer compliance breaches linked to inconsistent records
- reduced audit preparation effort
- better traceability of critical business entities
- stronger control over legal, supplier, product, or financial master data
- reduced exposure to fraud, sanction, or reporting errors
Key ROI KPIs for governance and risk
-
Compliance issue count: Number of data-related compliance findings or control failures.
Business value: Quantifies preventable exposure and remediation effort.
AI use: Dora can monitor exception metrics, summarize issue patterns, and push alerts to governance owners. -
Audit preparation effort: Hours spent preparing evidence, validating records, and resolving discrepancies.
Business value: Converts weak data governance into a measurable productivity and control cost.
AI use: Dora can compile scheduled summaries for audit-readiness reviews from governed FineBI dashboards. -
Critical data ownership coverage: Percentage of master data elements with assigned stewardship and governance rules.
Business value: Indicates whether the organization can sustain MDM value over time.
AI use: Dora can identify gaps in governance coverage and notify relevant owners for follow-up.
Calculate ROI Using Measurable Inputs
Once value drivers are identified, the next step is to turn them into a financial model that leaders can trust.
Quantify costs comprehensively
A common mistake is undercounting the true cost of MDM. Software is only one part of the picture.
Include:
- software licensing or subscription
- implementation services
- systems integration
- data migration and cleansing
- stewardship and governance effort
- training and change management
- internal IT and business participation
- ongoing maintenance and enhancement
- data quality monitoring and issue resolution
If you are using analytics and AI to operationalize ROI tracking, also consider the cost of building governed KPI models, semantic layers, dashboard assets, and Data Agent Skills that support recurring insight delivery.
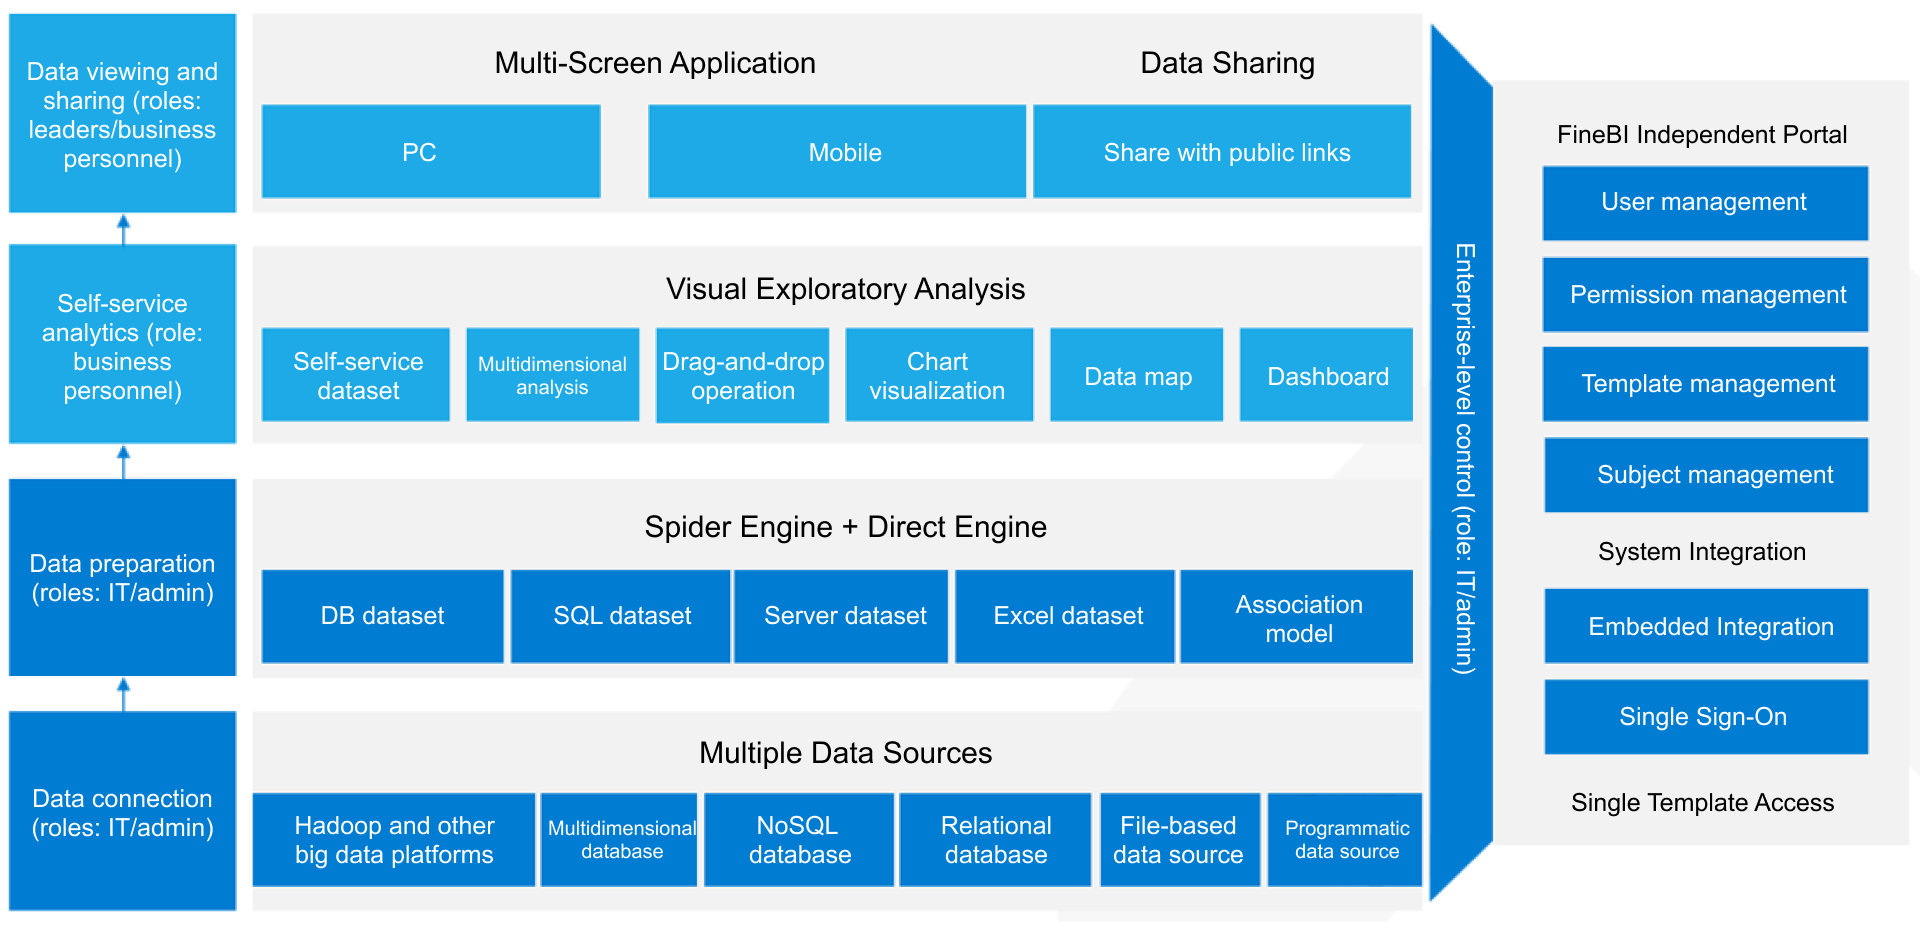
FineBI provides the BI foundation for this layer, including dashboards, metrics, and semantic assets. Dora builds on top of that with governed AI workflows, digital employees, and chat-based access that make ROI monitoring more usable for business stakeholders.
Translate benefits into financial terms
Benefits should be converted with transparent business logic. The goal is not perfect precision. The goal is a defensible estimate that finance and business owners accept.
Typical approaches include:
- Labor savings: manual hours reduced × fully loaded labor rate
- Avoided losses: error volume reduced × average cost per error
- Incremental revenue: uplift rate × affected revenue base × contribution margin
- Audit savings: reduced preparation time × labor rate
- Cycle time gains: faster launch or onboarding × estimated revenue acceleration or cost avoidance
Examples:
- reducing manual reconciliation by 2,000 hours per year can be monetized using labor cost
- lowering order errors from inconsistent product data can be monetized using rework cost, delay cost, or customer compensation cost
- improving account matching can be monetized through better sales visibility and higher cross-sell capture
Where assumptions are less direct, create low, medium, and high scenarios rather than one aggressive estimate.
Apply a simple ROI formula and supporting metrics
A basic formula works well:
ROI = (Total Financial Benefits - Total Costs) / Total Costs × 100
Also present supporting metrics for better executive context:
- Payback period: how long it takes to recover the investment
- Total cost of ownership: full life-cycle cost of the MDM program
- Net business value: total benefits minus total cost
- Benefit realization by category: revenue, cost, risk, and productivity impact
A simple example structure:
- total annualized benefits: $2.4M
- total program cost over the same period: $1.5M
- net business value: $900K
- ROI: 60%
- payback period: 9-12 months
The important point is not the sample math. It is the discipline of linking every line item to observed process change and governed business assumptions.
How an AI Data Agent Handles This Scenario
Measuring the return on investment of master data management often becomes difficult after the first steering committee meeting. Executives want updates, operations teams want breakdowns, finance wants validated assumptions, and IT wants to avoid manually rebuilding reports for every question.
This is where Dora adds value as an enterprise Data Agent layer on top of FineBI.
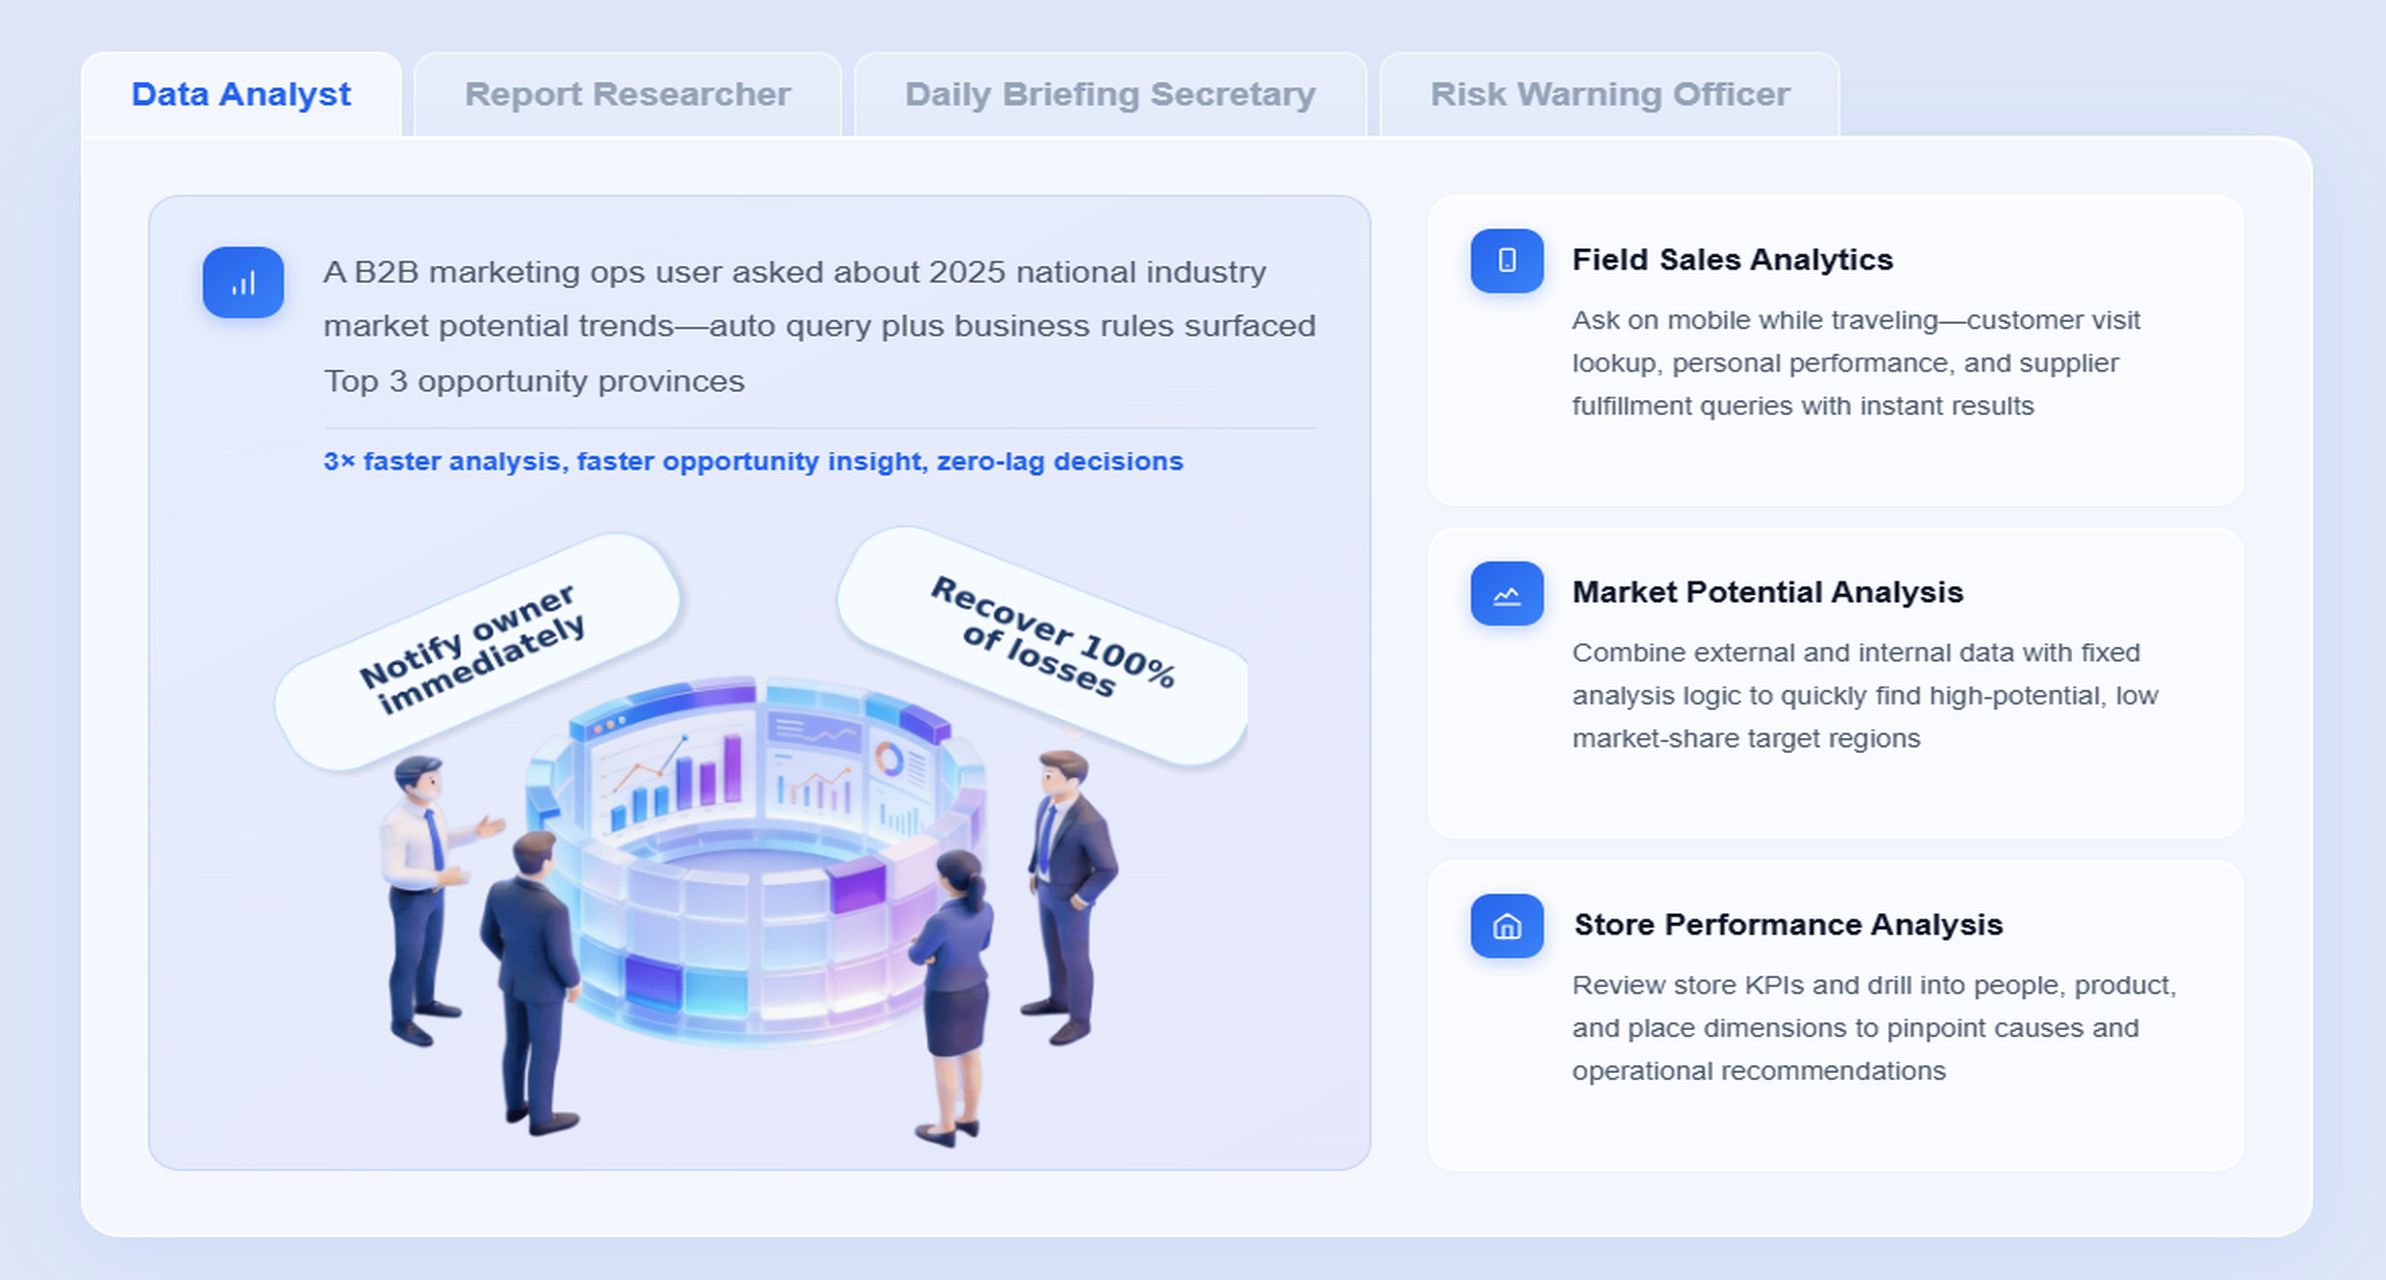
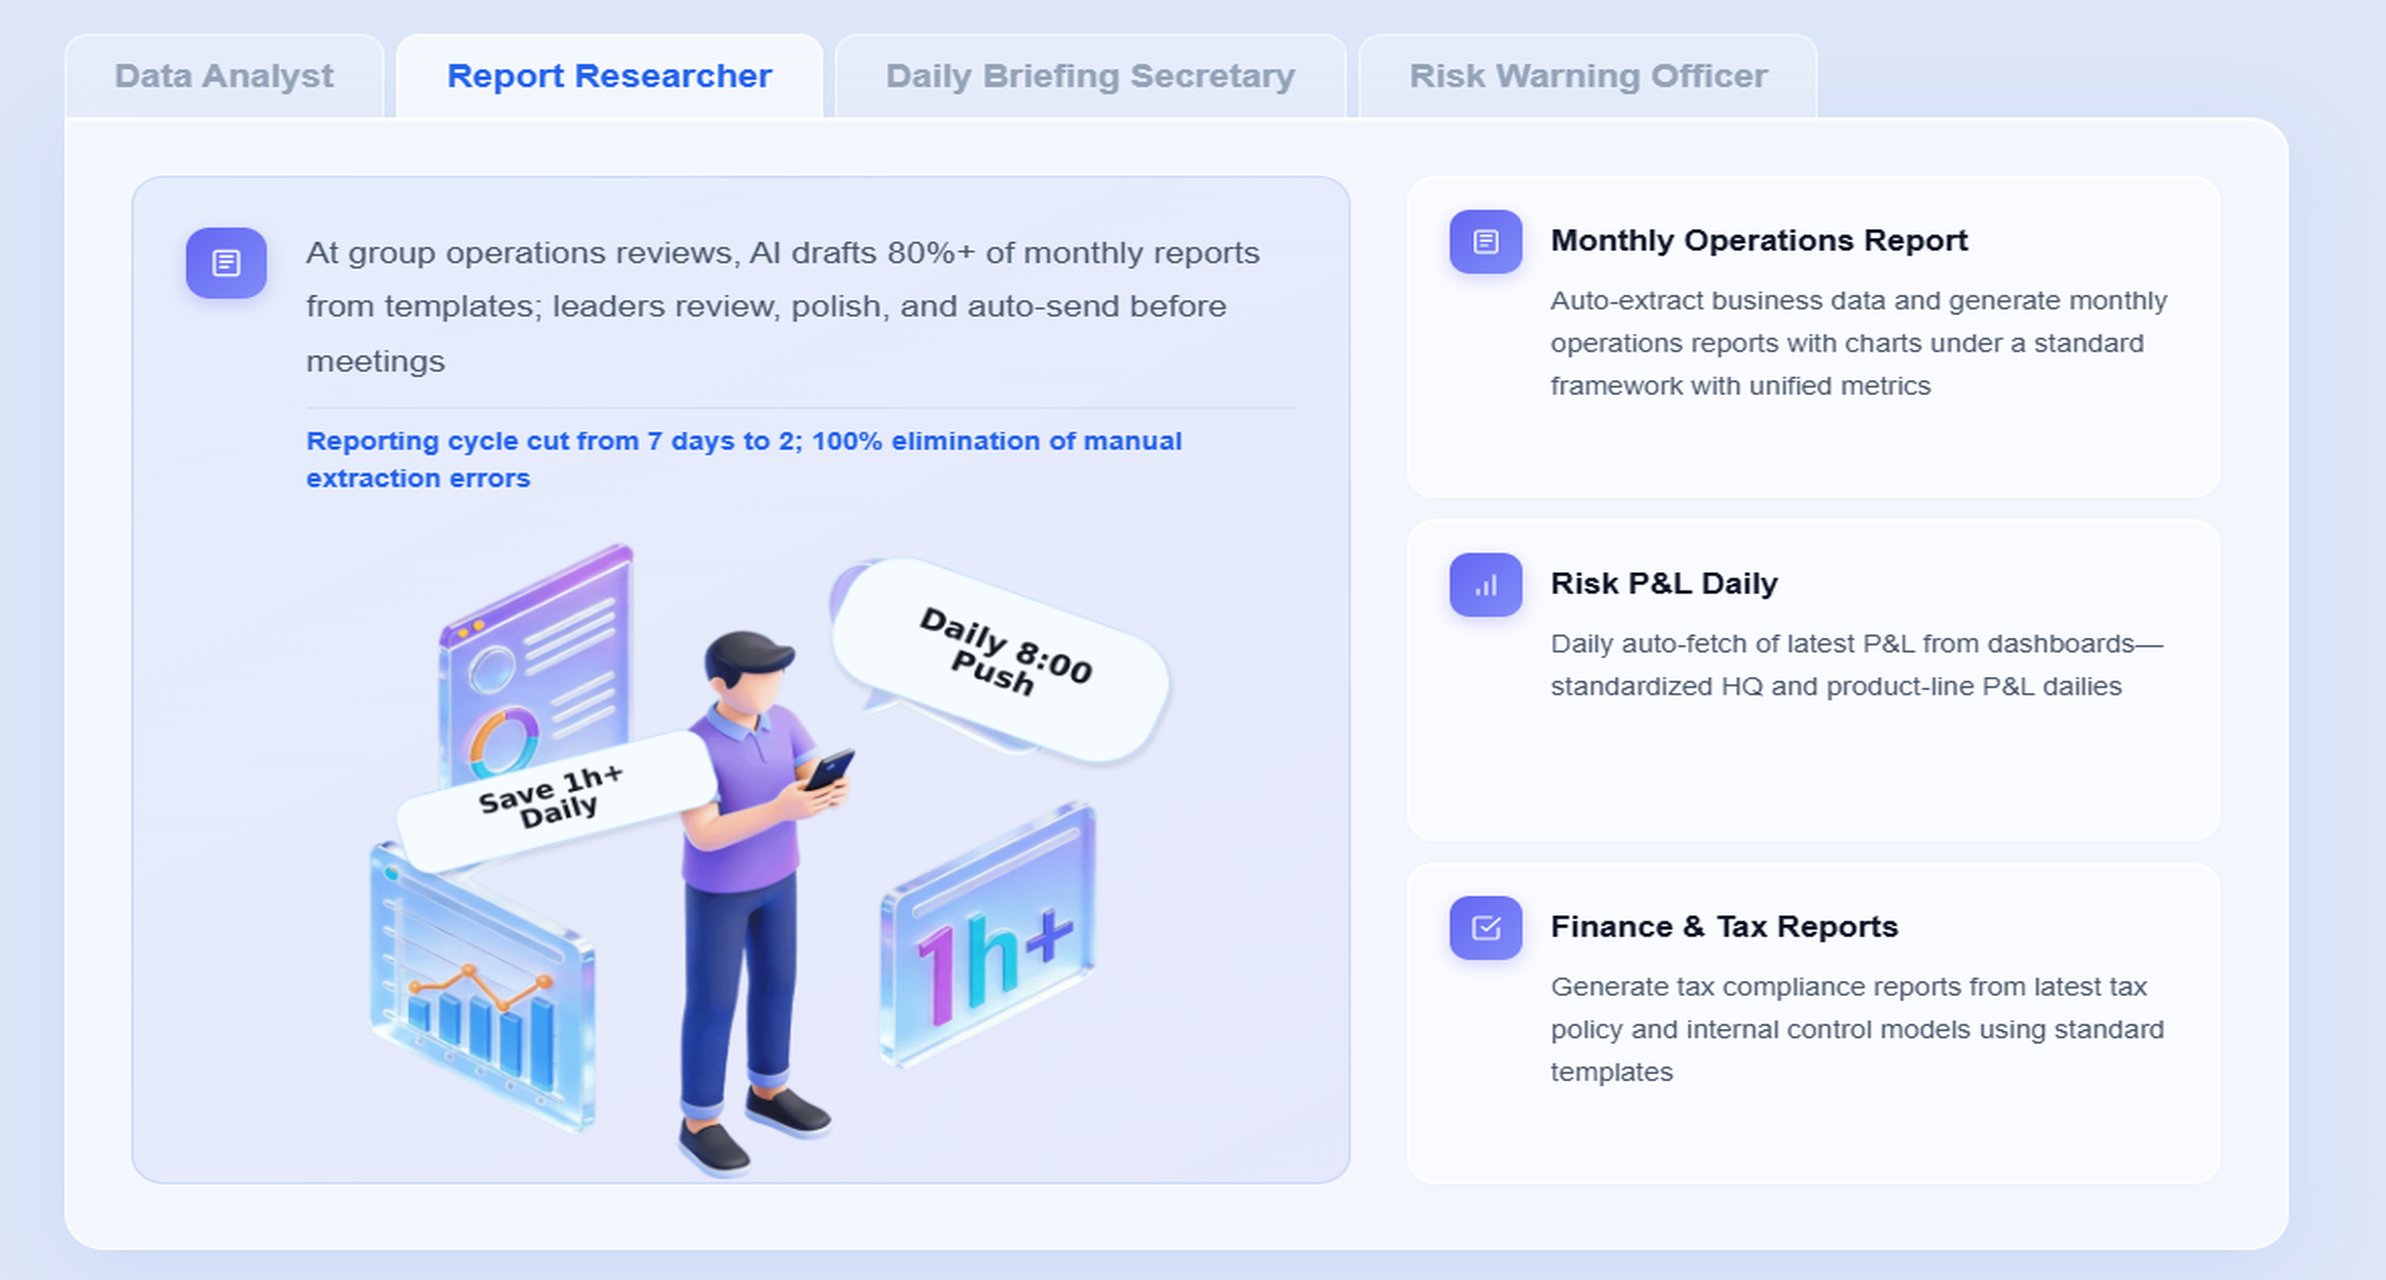
The most relevant Dora digital employees for this scenario are:
- Data Analyst digital employee for natural-language KPI analysis and follow-up questions
- Report Researcher for structured ROI reporting and management-ready summaries
- Daily Briefing Secretary for scheduled executive updates on MDM value realization
- Risk Alert Officer for monitoring exception thresholds in data quality, compliance, or process impact
Instead of asking analysts to manually compile each update, business users can interact with trusted MDM ROI metrics in chat.
A scenario-specific example query:
“Show me the quarterly return on investment of master data management for the customer and product domains, including duplicate reduction, reconciliation labor savings, order error trends, and any compliance exceptions by business unit.”
Here is how the AI workflow can work in practice:
-
Retrieve trusted FineBI assets
Dora accesses the relevant FineBI dashboards, metric models, and analysis subjects for MDM value tracking. -
Understand KPI definitions and semantic rules
Dora uses governed business definitions for duplicate rate, labor savings, order error cost, compliance issue count, and ROI calculation logic. -
Generate chart-based answers or dashboard-style analysis views
The user receives a structured response in chat with trend charts, breakdowns by business unit or data domain, and summary commentary. -
Detect abnormal changes or missed targets
If duplicate reduction slows, error rates rise, or adoption weakens, Dora can identify the exception against defined thresholds. -
Push insights and alerts to responsible users
Relevant owners receive scheduled summaries, exception notices, or follow-up prompts for stewardship, operations, or finance review. -
Produce follow-up summaries for meetings or reviews
Dora can prepare leadership-ready briefings that summarize realized value, open risks, and recommended next actions.
This workflow matters because MDM ROI is not a one-time spreadsheet exercise. It is a cross-functional management process. FineBI provides the trusted dashboard, metric, and semantic foundation. Dora turns that foundation into a governed AI assistant that supports chat-based analysis, periodic reporting, anomaly monitoring, and follow-up execution.
That is a much stronger enterprise model than relying on raw prompt-only tools. With governed Skills, permissions, semantic rules, and reusable BI assets, FineBI + Dora is designed for better control, stronger auditability, lower token waste, and more stable execution paths in recurring data work.
Avoid Common Mistakes in MDM ROI Analysis
Even well-funded MDM programs can struggle to prove value if the ROI method is weak.
Overestimating benefits or ignoring adoption
Expected value depends on more than data cleanup. It depends on whether the business actually changes behavior.
For example:
- sales teams must use unified account views
- operations teams must trust and adopt governed records
- stewards must maintain rules consistently
- finance must accept the benefit logic
If adoption is low, realized ROI will lag modelled ROI. Measure both implementation completion and business usage.
Measuring too narrowly or too late
If you only track data quality metrics, you may miss the business story. Duplicate reduction is useful, but leadership wants to know whether it reduced cost, improved service, or lowered risk.
At the same time, waiting too long can weaken sponsorship. Start with early indicators, then build toward broader business outcomes over time.
A practical approach is to track:
- operational metrics early
- financial conversion next
- strategic impact over longer periods
Failing to refresh assumptions over time
The return on investment of master data management is not static. Business models change. Systems change. Product lines expand. Regulations evolve. Data maturity improves.
Review assumptions periodically:
- is the labor rate still valid?
- has transaction volume changed?
- are new systems now in scope?
- have governance roles matured?
- are there new revenue or risk effects to include?
A living ROI model creates better decisions than a one-time business case filed away after approval.
Turn ROI Measurement Into an Ongoing Leadership Tool
The best organizations do not treat MDM ROI as a project-closing exercise. They use it as a leadership instrument for steering priorities, funding, and governance maturity.
A strong operating model includes:
- a recurring executive reporting cadence
- domain-level scorecards for customer, product, supplier, or finance data
- clear ownership for each KPI and benefit assumption
- periodic finance validation
- decision rules for where to invest next
This allows leadership to answer questions such as:
- Which data domain should receive the next wave of stewardship investment?
- Which business unit is realizing value fastest?
- Where are poor adoption or control gaps limiting returns?
- Which master data issues are now creating the greatest operational or compliance risk?
FineBI supports this with trusted KPI dashboards, drill-down analysis, and reusable semantic assets. Dora extends it by giving leaders and business teams a practical AI assistant layer for natural-language access, scheduled summaries, exception alerts, and scenario-specific follow-up.
Actionable Best Practices
Below are practical ways to improve the accuracy and usefulness of MDM ROI measurement.
1. Standardize KPI definitions, synonyms, filters, and metric ownership
Do not let each department define savings or quality differently. Align on one business glossary for terms such as duplicate rate, active customer, corrected transaction, and compliance exception. This is essential for both dashboard trust and AI interpretation.
2. Build a semantic layer inside the BI workflow
A semantic layer makes ROI metrics reusable, understandable, and governed across reports and AI interactions. FineBI plays a key role here by turning business logic into trusted analytics assets rather than scattered spreadsheet formulas.
3. Treat data quality as part of the AI implementation
If AI is used to summarize MDM outcomes, the underlying metrics must be trustworthy. Dora performs best when KPI definitions, permissions, business rules, and data quality controls are already governed through FineBI and enterprise data workflows.
4. Start with high-value recurring workflows instead of automating everything
Pick a scenario where MDM value is visible and repeatable, such as customer deduplication impact, product onboarding efficiency, supplier risk control, or audit-readiness reporting. This creates faster business credibility for both BI and Agentic BI adoption.
5. Preserve permission governance and human review
Executives may want summary views, while stewards and operations managers need more detailed analysis. Ensure AI outputs respect FineBI access boundaries. Use human review for AI-generated summaries and gradually expand Dora Skills where workflows are stable and auditable.
FineBI + Dora Solution Pitch
Building this manually is complex. FineBI helps teams build trusted dashboards, metrics, and semantic assets. Dora turns those assets into an AI assistant that can answer questions in chat, generate dashboard-style analysis views, push scheduled summaries, monitor anomalies, and follow up with responsible owners.
For enterprise leaders measuring the return on investment of master data management, this combination is practical because it supports both sides of the problem:
- FineBI provides governed metrics, dashboards, visual exploration, and trusted semantic assets
- Dora provides the AI assistant layer for scenario execution through chat, summaries, alerts, pushes, and follow-up
This matters because MDM value usually spans multiple teams and reporting cycles. Leadership needs a trusted way to see the results, not just a technical data quality report. Business users need timely answers without waiting for analysts to rebuild every view. IT needs governance, permissions, and reusable logic rather than uncontrolled prompt experiments.
FineBI + Dora is not only a BI upgrade; it is a practical fourth-generation Agentic BI path. FineBI provides governed metrics and visual analysis. Dora provides the AI assistant layer for scenario execution, with more controlled Skills, lower token waste, faster execution paths, and more stable workflows than prompt-only agents.

Get Ready-to-Use Dashboard Templates in Fine Gallery
The strongest Dora pitch is scenario + product + service: FineBI provides the trusted BI foundation, Dora provides the AI digital employee, and implementation service connects data, governance, semantic setup, Skills, and rollout.
If your organization wants to prove the value of MDM with more than static reports, FineBI + Dora offers a practical way to measure, explain, and operationalize that value across the business.
FAQs
Measure MDM ROI by linking data improvements to operational changes and then to financial results. Typical inputs include cost savings, revenue uplift, risk reduction, and productivity gains compared with the full program cost.