Emerging business intelligence in 2026 is no longer about producing better reports. It is about helping leaders, analysts, and operations teams make faster, more confident decisions from live, trusted, and increasingly AI-assisted data. For enterprise teams, the pressure is clear: business cycles are moving faster, manual analysis does not scale, and disconnected dashboards create delays, rework, and poor execution. The organizations that win are the ones that turn data into action inside daily workflows, not just in monthly review meetings.
All dashboards in this article are built with FineBI. Ready to unlock smarter insights? Click below to start your free FineBI trial and see what’s possible!
Emerging business intelligence refers to the next generation of BI capabilities that combine self-service analytics, real-time data, AI-driven insights, trusted governance, and workflow integration. In plain language, it means business users can explore data faster, ask better questions, and act on insights without waiting on long reporting cycles.
Traditional BI was largely built around static dashboards, scheduled reports, and backward-looking analysis. It answered questions like:
What happened last month?
Which region missed target?
How did revenue compare to plan?
Emerging business intelligence goes further. It helps answer:
What is changing right now?
What is likely to happen next?
What should we do about it?
How can this insight trigger action inside the business process?
That difference is critical in 2026. Companies are dealing with shorter planning horizons, more data sources, higher customer expectations, and growing pressure to prove ROI on every technology investment. BI is becoming AI-native, operational, and decision-centric.
Why 2026 Is a Turning Point
Several shifts are converging at once:
Faster data cycles: Teams increasingly need hourly or real-time visibility, not end-of-week reports.
AI-native analytics: Generative AI, machine learning, and automated insights are entering mainstream BI workflows.
Operational integration: Insights are being embedded into CRM, ERP, support, and supply chain systems.
Executive pressure for measurable value: Leaders expect BI to improve revenue, cost control, service levels, and execution speed.
This article focuses on the trends, technologies, and business outcomes that matter most for decision-makers evaluating emerging business intelligence.
Key Metrics (KPIs) for Emerging Business Intelligence
When evaluating a modern BI initiative, leaders should track more than dashboard delivery. The most useful KPIs include:
Data freshness: How current the data is when users access it.
Time to insight: How long it takes from identifying a question to getting an answer.
Dashboard adoption rate: The percentage of target users actively using analytics tools.
Metric consistency: The degree to which teams use the same definitions for core KPIs.
Forecast accuracy: How closely predictions align with actual outcomes.
Decision cycle time: The speed from insight discovery to business action.
Alert response time: How quickly teams respond to operational exceptions.
Self-service rate: The share of analysis completed without heavy IT or analyst intervention.
Data quality score: A measure of completeness, accuracy, and reliability of source data.
Business impact realized: Improvements in revenue, margin, efficiency, retention, or risk reduction tied to BI usage.
9 Trends Shaping the Emerging Business Intelligence
AI-Driven Analytics Becomes Standard
AI is quickly becoming a default layer within BI platforms. Instead of relying only on manual filtering and chart creation, users can now generate summaries, detect anomalies, surface hidden drivers, and explore likely outcomes with far less effort.
In practical terms, AI-driven analytics is changing workflows in three major ways:
Machine learning models identify patterns, forecast trends, and flag unusual behavior.
Generative AI turns natural language prompts into visual analysis, summaries, or explanations.
Automated insights proactively highlight changes in performance before someone asks.
This matters because analysts are no longer spending all their time gathering data and building repetitive reports. More effort can shift toward interpretation, validation, and decision support.
However, human judgment still matters. AI can accelerate pattern detection, but it cannot fully understand business context, policy constraints, customer nuance, or strategic trade-offs. Teams still need people to validate assumptions, challenge weak outputs, and make final decisions.
Static reporting is being replaced by live operational intelligence. Teams want to know what is happening now, not just what happened at the end of the reporting period. At the same time, analytics is moving out of standalone BI tools and into the systems where work actually happens.
This trend shows up clearly across functions:
Sales: Pipeline changes, deal risk, and rep activity are tracked in near real time.
Supply chain: Inventory, fulfillment delays, and supplier performance are monitored continuously.
Customer support: Teams watch queue backlogs, SLA risk, and issue categories as they evolve.
Finance: Cash flow, expense variance, and collections risk are refreshed more frequently.
Embedded intelligence is equally important. When analytics sits inside a CRM, ERP, service portal, or mobile app, users are more likely to act on it. This reduces friction between analysis and execution.
Real-time Analysis
Self-Service, Data Governance, and Trust Must Evolve Together
One of the biggest mistakes organizations make is treating self-service analytics and governance as separate priorities. In reality, they must mature together.
As more users gain access to data, the risk of confusion also increases. Teams may define revenue differently, build conflicting dashboards, or use low-quality data without realizing it. This leads to mistrust, slower decisions, and unnecessary debate.
To avoid that, organizations need a balanced model:
Broader access to trusted data
Clear metric definitions
Role-based permissions
Standardized dimensions and hierarchies
Data quality monitoring
Auditability and compliance controls
The goal is not to slow users down. The goal is to let them move quickly within a controlled and reliable framework.
Self-service BI not only improves productivity but also creates a single version of the truth, enabling organizations to act on reliable, up-to-date data.
Predictive and Prescriptive BI Gain More Attention
Descriptive analytics explains what happened. Predictive analytics estimates what may happen next. Prescriptive analytics recommends the best action based on available options and constraints.
In 2026, businesses are demanding more from BI than historical visibility. They want forward-looking guidance.
Examples include:
Forecasting customer churn risk
Predicting product demand by region
Estimating cash collection delays
Recommending reorder points
Identifying the next best action for sales teams
Scenario modeling is becoming especially valuable. Leaders want to test assumptions, compare potential outcomes, and prepare for uncertainty. This shifts BI from a reporting function to a decision support capability.
Trend Summary: What Defines Emerging Business Intelligence
The most important trends can be summarized in a simple framework:
Trend Area
What Is Changing
Business Value
AI-driven analytics
Faster pattern discovery and automated insight generation
Reduces analysis effort and improves responsiveness
Core Technologies Behind Emerging Business Intelligence
Cloud Data Platforms and Lakehouse Architectures
Modern BI depends on flexible, scalable data foundations. Cloud data platforms and lakehouse architectures make it easier to store large volumes of structured and semi-structured data while supporting different workloads across teams.
For growing organizations, this matters because traditional on-premise reporting environments often create bottlenecks around storage, compute, and data preparation. Cloud-first architectures help teams:
Scale analytics without major infrastructure delays
Support many users and workloads simultaneously
Combine operational, financial, customer, and external data
Reduce dependency on rigid reporting pipelines
A lakehouse approach is especially useful when organizations need both governed reporting and more exploratory analytics from broader data sets.
Semantic Layers, Metrics Stores, and Data Modeling
A powerful BI platform is not enough if every team calculates core metrics differently. This is why semantic layers, metrics stores, and strong data modeling are becoming foundational.
A semantic layer creates a shared business logic layer between raw data and dashboards. It defines common terms such as revenue, active customer, gross margin, fulfillment rate, or on-time delivery. A metrics store extends that idea by centralizing KPI definitions for consistent reuse.
The result is simple but powerful:
Finance, sales, and operations see the same version of key metrics
Dashboard builders work faster
Users trust what they see
Executive reviews spend less time debating numbers
Without trusted metrics, adoption suffers. People stop using BI when every report tells a different story.
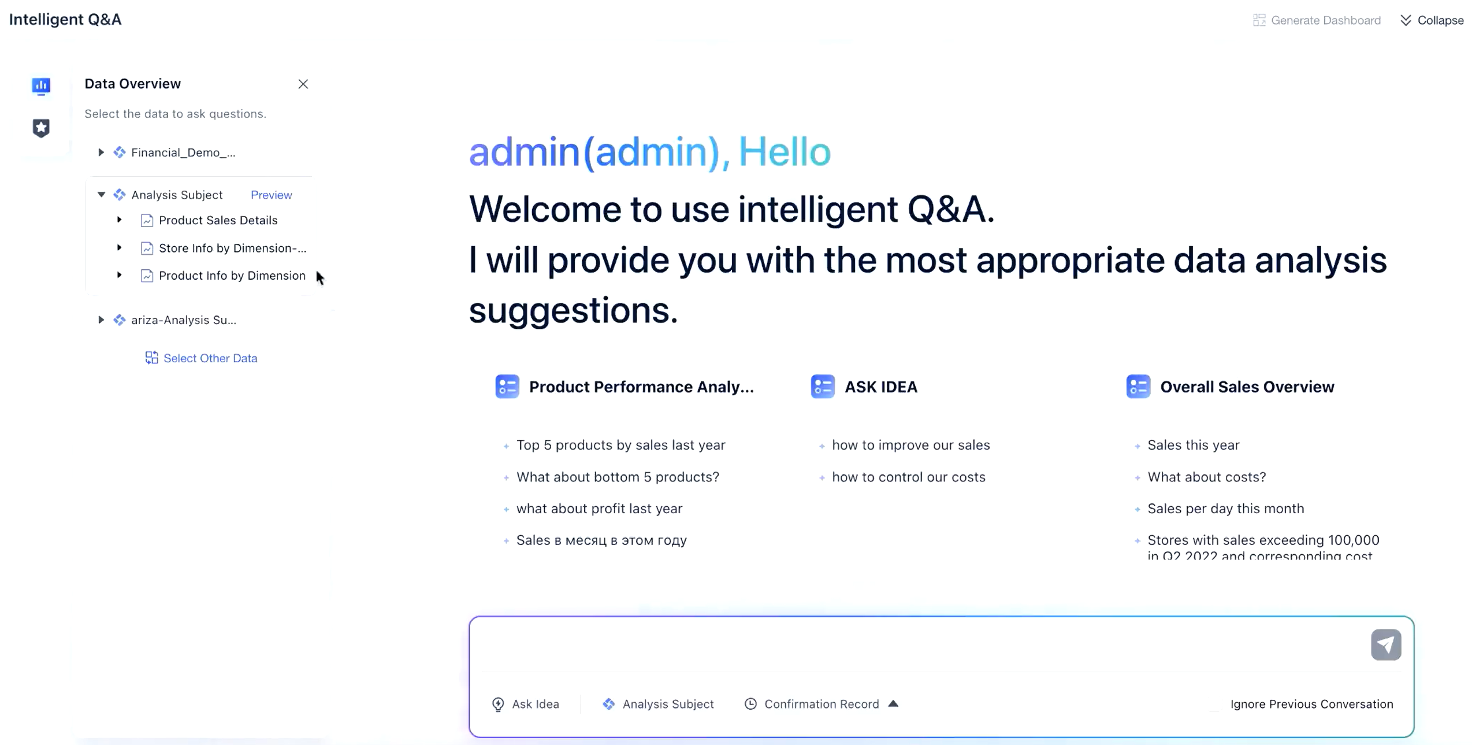
Natural Language Interfaces and Conversational Analytics
Natural language interfaces allow users to ask business questions in everyday language, such as:
Which product category had the highest growth this quarter?
Why did gross margin decline in the east region?
Show the top drivers of support ticket volume this week.
This lowers the barrier to entry for non-technical users and speeds up analysis for experienced teams. Conversational analytics can also return summaries, chart suggestions, and follow-up questions.
But there is an important limitation: natural language querying only works well when the underlying data is clean, modeled, and governed. If fields are inconsistent, definitions are unclear, or permissions are weak, conversational BI will generate misleading results or poor user experiences.
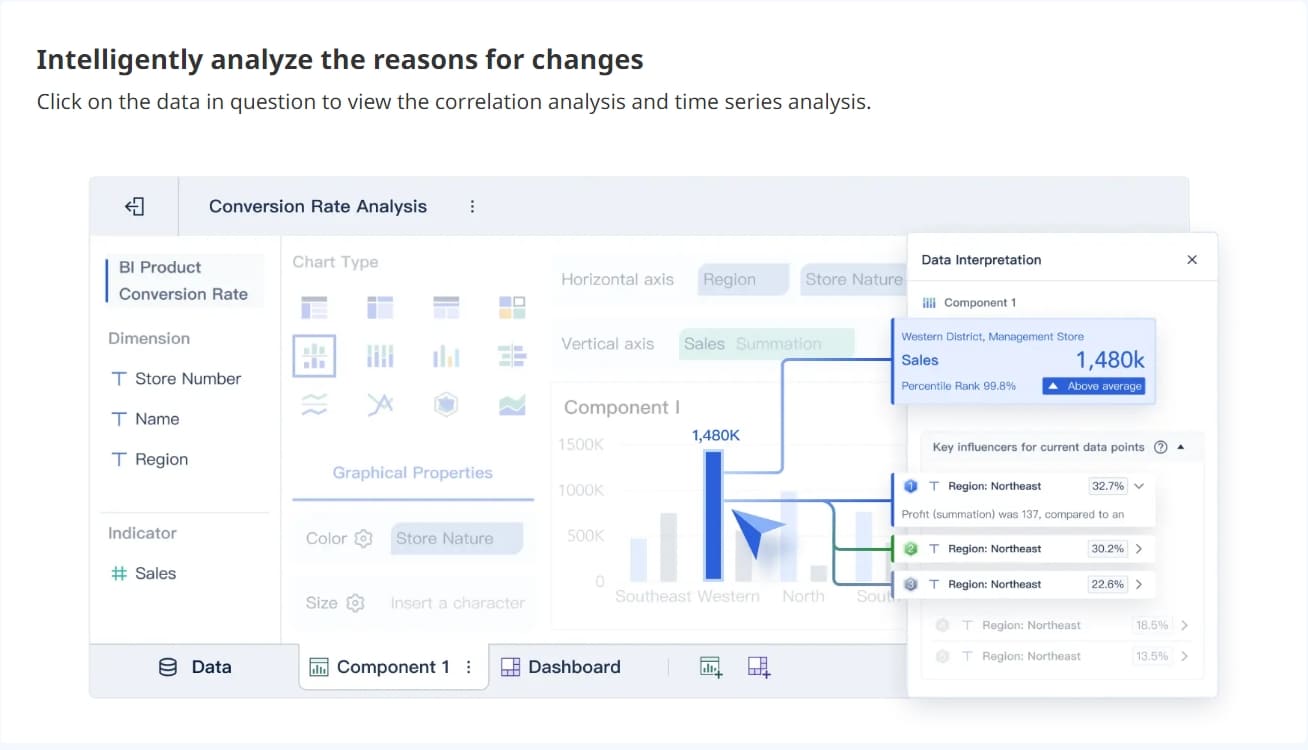
Automation, APIs, and Reverse ETL
A defining feature of emerging business intelligence is that it does not stop at visualization. Insights increasingly connect to operational systems through APIs, workflow tools, and reverse ETL processes.
This makes BI actionable. For example:
A churn-risk score can be pushed into CRM for account managers
A stockout alert can create a replenishment workflow
A service quality threshold breach can notify supervisors instantly
A finance variance alert can trigger review tasks automatically
Automation closes the gap between analysis and execution. Instead of waiting for a meeting, teams can respond as soon as a threshold changes or a predictive signal appears.
Real Business Impact of Emerging Business Intelligence Across Teams
Better Decision Speed and Visibility
One of the clearest benefits of emerging business intelligence is improved decision speed. When leaders and frontline teams share live visibility into the same trusted metrics, they can identify changes earlier and act faster.
This creates benefits across the organization:
Fewer delays caused by manual report preparation
Faster escalation of performance issues
Quicker alignment between departments
Better ability to spot trends before they become problems
Shared visibility also reduces the hidden cost of siloed data. When each team works from isolated reports, coordination slows down. Modern BI creates a common operating picture.
Stronger Customer, Financial, and Operational Outcomes
The real value of emerging business intelligence is not the dashboard itself. It is the repeated use of insights inside real business workflows.
Common business outcomes include:
Customer retention improvement: Identify churn signals early and intervene proactively.
Demand forecasting gains: Use predictive models to improve planning and reduce stock issues.
Pricing optimization: Monitor margin sensitivity and competitive shifts more effectively.
Waste reduction: Detect process inefficiencies, spoilage, and idle resources sooner.
Service performance improvement: Manage SLA risk and staffing with live operational signals.
The strongest ROI usually comes from use cases that are frequent, measurable, and tied to clear owners.
Risks, Limits, and Common Missteps
Despite the opportunity, emerging business intelligence does not automatically create business value. Several issues commonly undermine results:
Poor data quality: Bad source data leads to low trust and poor decisions.
Weak adoption: Even strong dashboards fail if users do not embed them in daily work.
Overreliance on AI outputs: Automated insights still require human validation.
Unclear ownership: If no team owns metric definitions, quality, and usage, progress stalls.
Overbuilding too early: Some organizations try to launch advanced AI features before fixing fundamentals.
Disconnected workflows: Insights without action pathways become passive reporting again.
The lesson is straightforward: technology matters, but operating model, governance, and business alignment matter just as much.
How to Evaluate and Adopt Emerging Business Intelligence Capabilities in 2026
Questions Leaders Should Ask Before Investing
Before selecting tools or launching new BI programs, leaders should evaluate readiness across data, governance, people, and process.
Key questions include:
Do we have a high-value business use case with measurable impact?
Are our source systems reliable enough for trusted analytics?
Do we have agreed definitions for core KPIs?
Can business users access data safely without overloading IT?
How easily does the BI platform integrate with our current stack?
Can it support real-time, predictive, and embedded use cases over time?
What is the true total cost, including implementation, maintenance, and change management?
How will we measure adoption and business outcomes after rollout?
A strong evaluation process should connect BI investment to specific decisions, not abstract reporting goals.
A Practical Adoption Roadmap
The most successful organizations do not try to transform everything at once. They build momentum through phased adoption.
1. Start with a high-value use case
Choose a business scenario where faster insight can drive visible impact. Good candidates include:
Sales pipeline visibility
Inventory and fulfillment monitoring
Financial variance management
Customer churn reduction
Service-level performance tracking
Start where the business pain is obvious and outcomes are measurable.
2. Define trusted metrics and ownership
Before scaling dashboards, align on KPI definitions, dimensions, refresh logic, and data owners. This is where many BI programs succeed or fail.
Create a governance model that includes:
Business metric owners
Data stewards
Access and permission rules
Data quality checks
Change management standards
3. Build self-service on top of governed data
Once trusted foundations are in place, enable broader user access through intuitive dashboards, exploration tools, and reusable semantic models. Self-service should expand access, not create metric chaos.
4. Expand into predictive, real-time, and embedded analytics
After the initial reporting layer proves value, extend into more advanced capabilities:
Real-time alerts for operational action
Predictive models for forecasting and risk management
Track both usage and business impact. At minimum, measure:
Active users and adoption by role
Time to insight
Reduction in manual reporting effort
Improvement in forecast accuracy
Decision cycle time
Operational or financial outcomes tied to the use case
Actionable Best Practices for Implementing Emerging Business Intelligence
If you want emerging business intelligence to deliver measurable results in 2026, focus on disciplined execution rather than feature chasing.
1. Prioritize one operational decision loop first
Do not begin with a generic enterprise dashboard strategy. Start with one decision loop that repeats frequently and affects performance, such as pricing review, inventory allocation, lead conversion, or SLA management.
Consultant advice: Pick a use case with high pain, clear ownership, and fast feedback cycles. This creates visible ROI and executive support.
2. Standardize metrics before scaling self-service
Many BI rollouts fail because teams scale access before they standardize definitions. Resolve core KPI logic early, especially for revenue, margin, customer counts, service levels, and forecast assumptions.
Consultant advice: Build a governed semantic layer so business users can move fast without creating inconsistent reports.
3. Design dashboards for action, not just visibility
A dashboard should help users decide what to do next. That means highlighting exceptions, trends, thresholds, and drivers instead of flooding users with charts.
Consultant advice: Every critical dashboard should answer three questions:
What changed?
Why did it change?
What action should the user take?
4. Put analytics where work happens
If users must leave their core systems to find insights, adoption will drop. Embed analytics into sales, finance, support, and operations workflows whenever possible.
Consultant advice: The best BI programs reduce clicks between insight and action. This is where embedded analytics and automation deliver outsized value.
5. Treat AI as a co-pilot, not an autopilot
AI can accelerate analysis, summarize findings, and suggest next steps. But it should not replace controls, governance, or expert review.
Consultant advice: Use AI to improve analyst productivity and user access, while keeping humans accountable for validation and final decisions.
Why Emerging Business Intelligence Matters Now
Emerging business intelligence matters now because BI is becoming more proactive, accessible, and actionable at the same time. AI is speeding up analysis. Real-time data is improving responsiveness. Embedded analytics is increasing adoption. Semantic layers and governance are making metrics more trustworthy. Automation is helping insights drive action directly.
For enterprise leaders, this is not just a technology trend. It is an operating model shift. The companies that invest early in the right emerging business intelligence capabilities will be better positioned to:
Make decisions faster
Reduce manual reporting bottlenecks
Improve visibility across teams
Forecast and plan with greater confidence
Turn analytics into measurable business outcomes
FineBI fits naturally into this shift by helping organizations build governed, self-service, and action-oriented dashboards that support both strategic oversight and operational execution.
Get Ready-to-Use Dashboard Templates in Fine Gallery
The 2026 winners will not be the companies with the most dashboards. They will be the ones with the most trusted, usable, and operationally embedded intelligence.
Emerging business intelligence combines self-service analytics, real-time data, AI-assisted insights, trusted governance, and workflow integration. Its goal is to help teams make faster decisions based on current and actionable information.
Traditional BI mainly focuses on static reports and historical dashboards. Emerging BI adds real-time visibility, predictive analysis, AI support, and the ability to trigger action inside daily business processes.
Real-time data helps teams respond to changes as they happen instead of waiting for weekly or monthly reports. This improves execution speed, alert response, and decision quality in fast-moving operations.
AI helps detect anomalies, generate summaries, surface hidden trends, and support forecasting with less manual effort. It improves speed and scale, but human review is still needed to validate results and apply business context.
Useful BI KPIs include data freshness, time to insight, dashboard adoption, metric consistency, forecast accuracy, self-service rate, and decision cycle time. The best set depends on whether the business is prioritizing speed, governance, or measurable ROI.
Product Trial
FineReport
Pixel-perfect reports · Interactive dashboards · Easy data entry · Digital twins


 Real-time Analysis