You can start your first data analysis project even if you have never worked with data before. Many people think data analysis is too hard, but you can learn each step with practice. When you use the right tools, such as FineBI from FanRuan, you make your data analysis project much easier. You will find that your data analytics project helps you understand data and solve real problems. Take action now and begin your journey in data analysis.

Every successful data analysis project begins when you clearly define the problem. You need to know what question you want to answer or what issue you want to solve. For example, you might want to find out why sales dropped last quarter or understand which products customers like most. When you define the problem, you set the direction for your data analytics project.
Ask yourself these questions:
Tip: Write down your problem statement in one or two sentences. This helps you stay focused during your data analysis.
You should avoid starting your data analysis project without a clear problem. If you skip this step, you may waste time looking at data that does not help you.
After you define the problem, you need to set clear goals for your data analysis project. Goals help you measure success and keep your work on track. For example, your goal might be to increase customer satisfaction by 10% or to reduce delivery times by two days.
Use the SMART method to set your goals:
When you set clear goals, you make your data analytics project easier to manage. You also make it easier to share your results with others.
You need to start your data analysis project by finding the right data sources. Data can come from many places. You might use sales records, customer feedback, website logs, or even public datasets. Think about the problem you want to solve. Choose data that helps you answer your main question. Good data collection is the foundation of every successful project.
Tip: Make a simple list of all possible data sources before you begin. This helps you organize your data collection and makes it easier to collect and understand the data.
You should check if your data is accurate and up-to-date. Reliable data leads to better results in your data analysis.

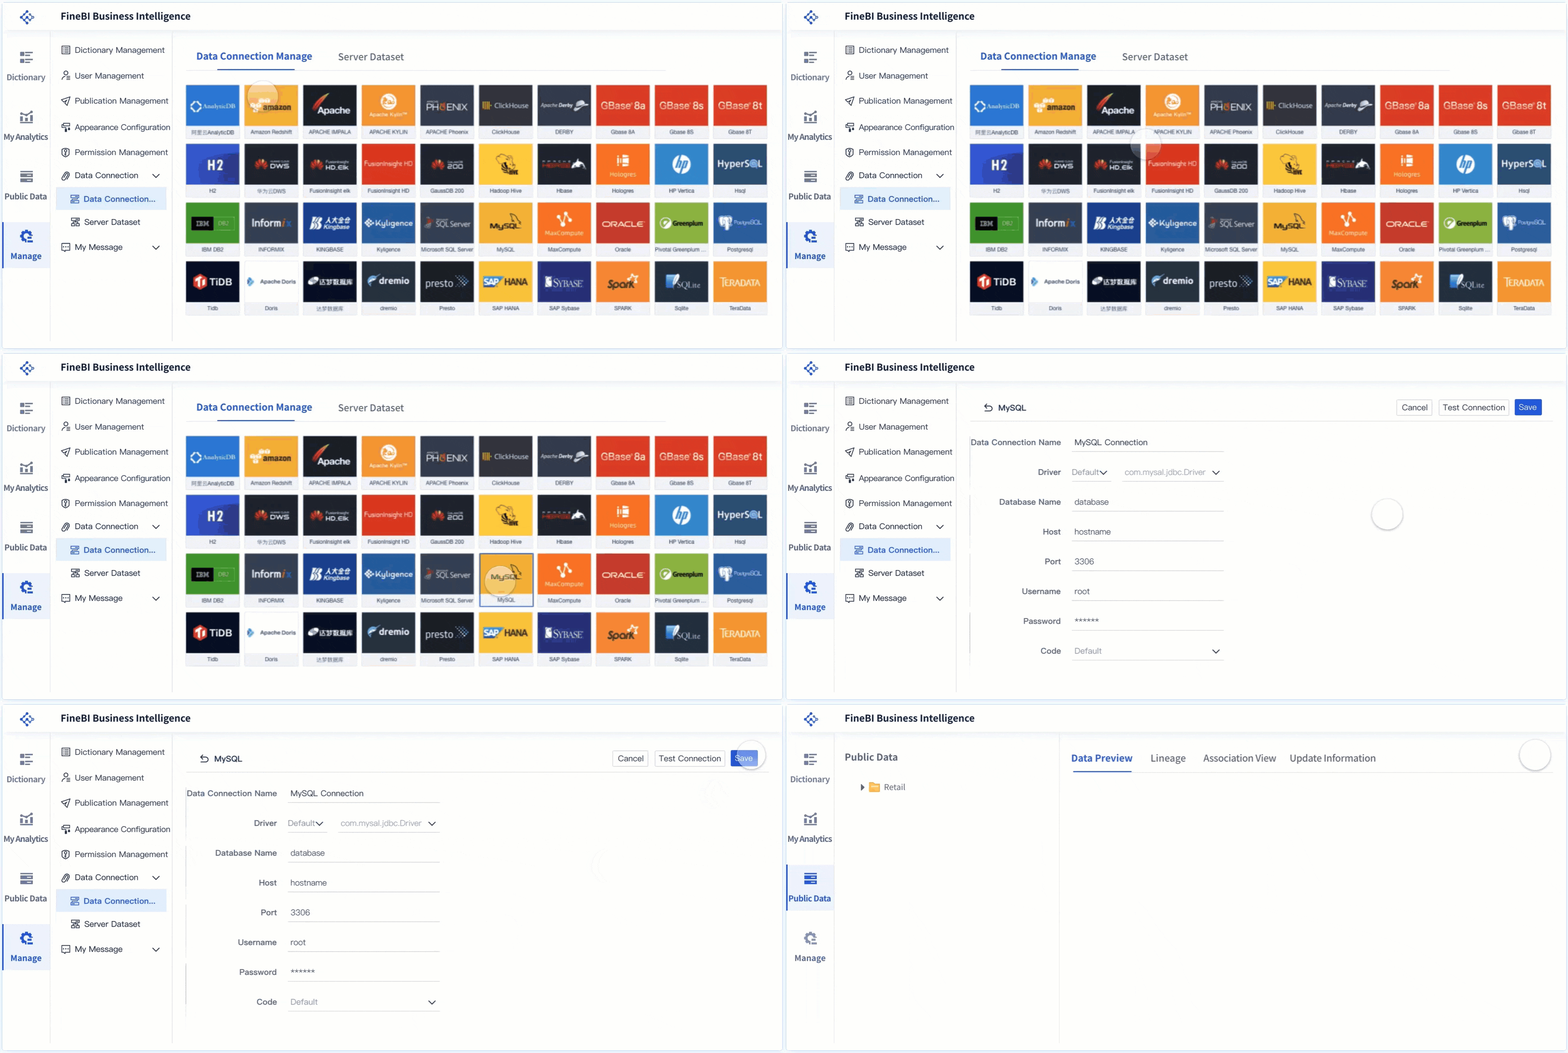
Once you know where your data lives, you need to bring it into your analysis tool. FineBI by FanRuan makes this step simple. You can connect to many types of data sources, such as databases, Excel files, and APIs. FineBI supports over 60 connectors, so you can link to almost any system. You do not need to write code. Just follow the steps in FineBI to connect and import your data.

Unified data integration is very important. When you collect and prepare the data in one place, you avoid mistakes and save time. FineBI lets you combine data from different sources into a single view. This helps you see the big picture and makes your data analysis more powerful.
Note: FineBI also works with FineDataLink for advanced data integration. This gives you even more control over your data collection and management.
When you collect and integrate your data well, you set yourself up for success. You can move forward with confidence, knowing your data is ready for the next steps.
Before you start your data analysis, you need to make sure your data is clean and ready to use. This step is called data cleaning and preprocessing. You cannot skip this step if you want accurate results. When you collect and prepare the data, you remove errors and make your data easier to understand. FineBI gives you tools to help with this process.
Missing values are common in any data set. Sometimes, you find empty cells or gaps in your data. These missing values can cause problems in your data analysis. You need to decide how to handle them. You can fill in missing values with an average or a default number. You can also remove rows that have too many missing values. FineBI lets you spot missing values quickly and fix them with just a few clicks.

Tip: Always check for missing values before you move to the next step. This helps you avoid mistakes later.
You need to make sure your data looks the same in every row. Standardizing means you use the same format for dates, numbers, and text. For example, write all dates as "YYYY-MM-DD" and use the same units for measurements. Formatting your data helps you compare values and find patterns. FineBI makes it easy to change formats and standardize your data with simple tools.
A clean and well-formatted data set gives you confidence in your results. You can trust your data analysis when you know your data is correct. Data cleaning is a key part of every project.
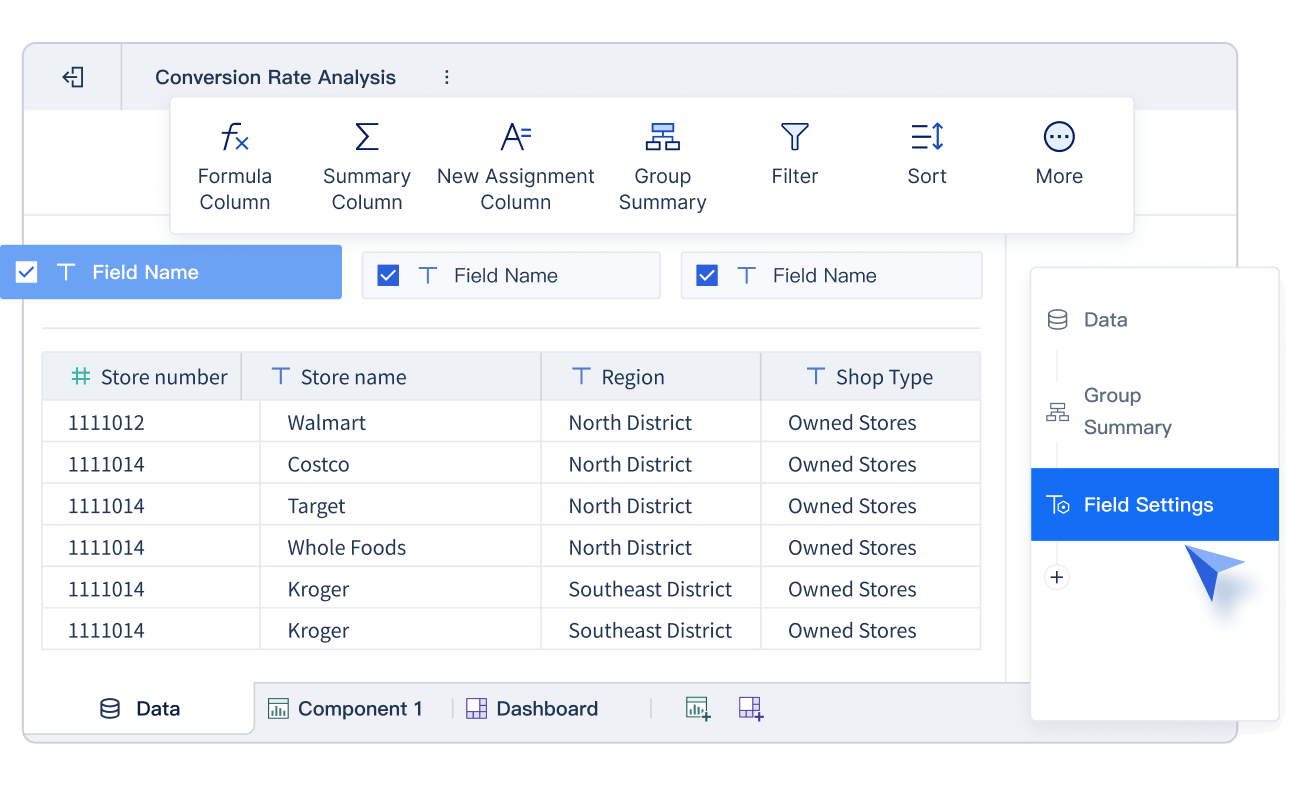
You have prepared your data. Now, you can start to analyze and model the data using FineBI’s powerful tools. FineBI gives you a simple way to perform exploratory data analysis. You do not need to write code or have advanced technical skills. You can use the drag-and-drop interface to select the fields you want to explore. This makes data exploration easy for beginners.
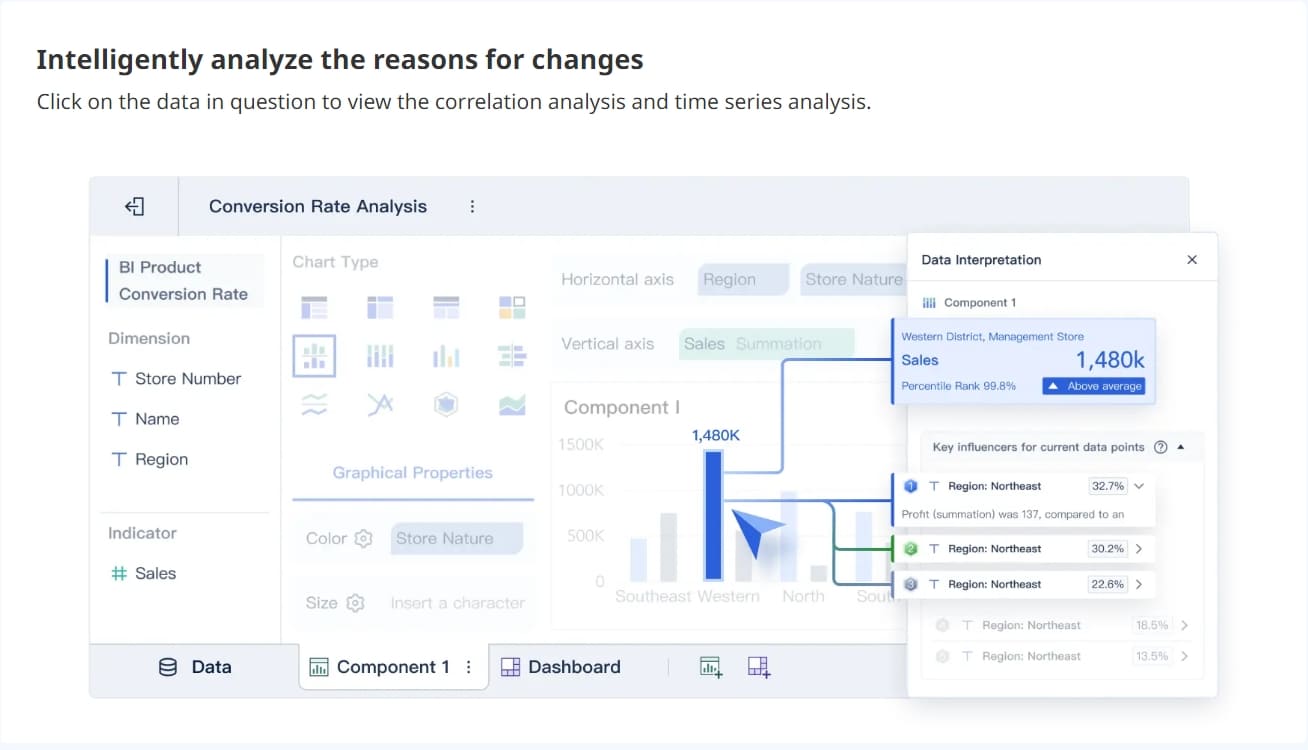
FineBI helps you analyze your data by offering summary statistics, such as averages, totals, and counts. You can quickly spot trends and patterns. For example, you might see which products sell best in each region. You can also filter your data to focus on specific groups or time periods. This step helps you find the most important insights.
Tip: Use FineBI’s self-service analytics to test different ideas. Try changing filters or grouping your data in new ways. You may discover insights you did not expect.
When you analyze and model the data, you can answer your original questions. You can also check if your goals are being met. FineBI lets you save your analysis steps, so you can repeat them or share them with your team. This makes your data analysis project more efficient.
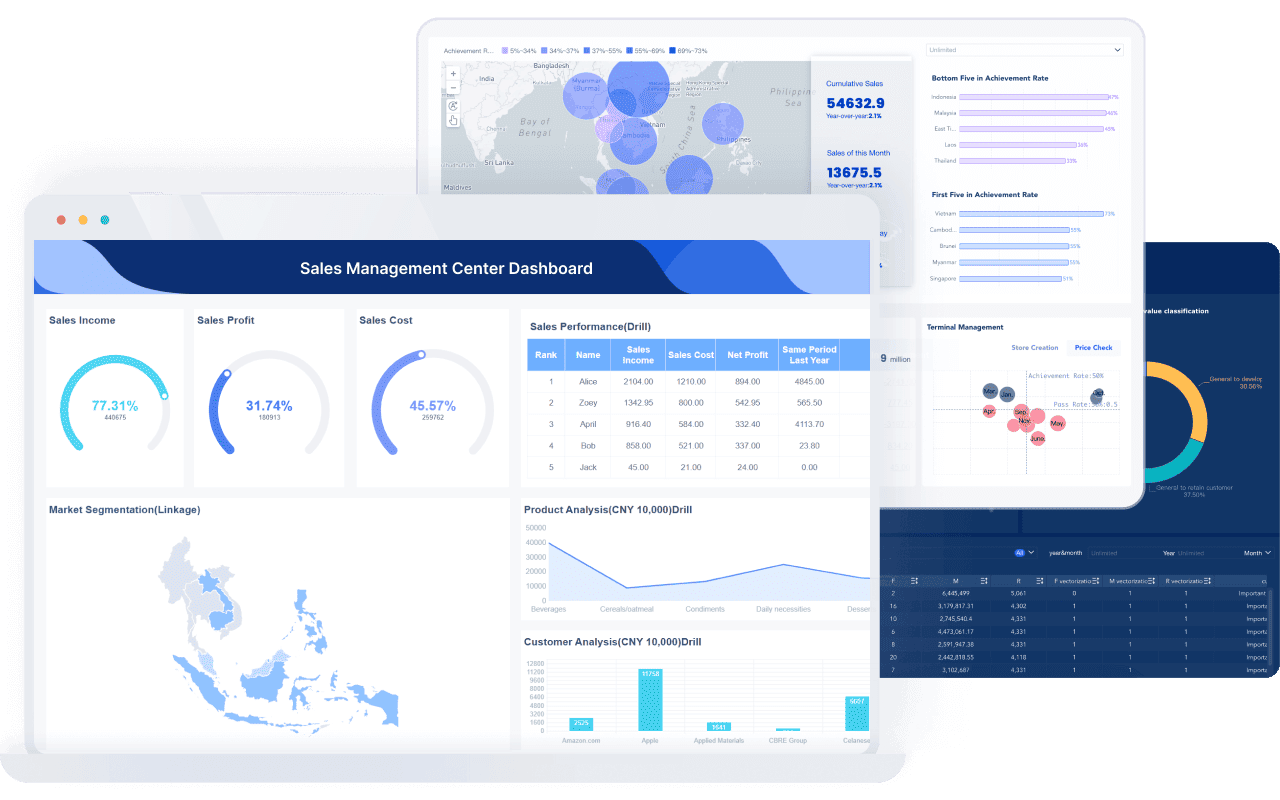
After you analyze your data, you need to visualize your insights. Visualization turns numbers into pictures. FineBI offers many types of charts and graphs. You can choose bar charts, line graphs, pie charts, and more. Each type helps you see different patterns in your data.

You can build dashboards by dragging and dropping components. FineBI’s dashboards let you combine several visualizations in one place. You can add filters, so viewers can explore the data themselves. This makes your insights clear and easy to understand.
Here is a simple table showing how different visualizations can help you:
| Visualization Type | Best For | Example Use Case |
|---|---|---|
| Bar Chart | Comparing categories | Sales by product line |
| Line Graph | Showing trends over time | Monthly revenue growth |
| Pie Chart | Showing parts of a whole | Market share by region |
Note: Good visualization helps you communicate your insights to others. People understand pictures faster than tables of numbers.
You can share your dashboards with your team or management. FineBI allows you to export your visualizations or publish them online. This way, everyone can see the insights and make better decisions. When you visualize your insights, you turn your data analysis into real business value.
Remember, the goal of data analysis is not just to find answers. You want to create insights that help people take action. FineBI makes it easy for you to analyze, model, and visualize your data. You can uncover hidden patterns and share your findings with confidence.
You have finished your data analysis. Now, you need to communicate and visualize the results. Sharing your results helps others understand your work and see the value of your project. Use clear charts, graphs, and dashboards to communicate and visualize the results. FineBI makes it easy to build dashboards that highlight your main insights. When you communicate and visualize the results, you help your team or managers make better decisions.
Try these steps to share your results:
Tip: Always match your visuals to your audience. Use simple language and clear graphics for people who are new to data analysis.
When you communicate and visualize the results well, you turn your insights into action. People can see trends, spot problems, and find new opportunities.
After you share your results, take time to document your process. Write down the steps you followed in your data analysis. Save your dashboards and reports. This record helps you and your team repeat the project or improve it next time.
You should also reflect on your results. Ask yourself what worked well and what you could do better. Did your data analysis answer your main question? Did your insights lead to real changes? Use feedback from others to improve your next project.
A simple checklist can help you review your work:
| Step | Complete? |
|---|---|
| Results shared | ☐ |
| Process documented | ☐ |
| Insights reviewed | ☐ |
| Improvements noted | ☐ |
Note: Each data analysis project helps you grow your skills. When you document and improve, you make your next results even better.
You can start your first data analysis project by following each step in this guide. FineBI from FanRuan gives you the tools to collect data, clean it, and find valuable insights. When you share your results, you help your team make better decisions. Try these steps on your own data. Reflect on your work to build your skills and gain confidence for future projects.
Click the banner below to try FineBI for free and empower your enterprise to transform data into productivity!

The Author
Lewis
Senior Data Analyst at FanRuan
Related Articles

Self-Service Analytics Defined and Why You Need It
Self-service analytics lets you analyze data without IT help, empowering faster, data-driven decisions and boosting agility for your business.
Lewis
Jan 04, 2026

Best Self-Service Tools for Analytics You Should Know
See which self-service tools for analytics let business users access data, build dashboards, and make decisions faster—no IT help needed.
Lewis
Dec 29, 2025

Understanding Predictive Analytics Services in 2026
Predictive analytics services use data and AI to forecast trends, helping businesses make informed decisions, reduce risks, and improve efficiency in 2026.
Lewis
Dec 30, 2025