To write an effective analysis example, you need to define a clear thesis, gather strong evidence, and organize your thoughts logically. Many organizations now rely on business intelligence tools, with a 49% increase in BI analytics usage and a 77% higher success rate for data-driven companies:
| Statistic / Finding | Description | Year / Source |
|---|---|---|
| 49% increase in BI analytics usage | Nearly half of companies have increased their use of business intelligence analytics compared to pre-pandemic levels, indicating growing reliance on data-driven insights. | 2025, Sisense survey |
| 77% higher success likelihood | Companies with CEOs who make data-driven decisions are significantly more likely to succeed, demonstrating BI's business value. | Deloitte survey |
When you write your analysis, watch out for these common challenges:
Use real-world data and tools like FineBI to make your analysis actionable and relevant.

You may wonder, what is analysis? Analysis means breaking down information into smaller elements and examining how these elements work together. In business intelligence, you collect data from many sources and use analysis to find patterns, trends, and connections. You do not just repeat facts. Instead, you use critical analysis to ask why and how things happen. You look at the elements of the data, clean it, and model it to uncover insights. Critical analysis helps you move beyond the surface and understand the deeper meaning behind the numbers. When you use analysis, you transform raw data into knowledge that guides your decisions.
You might ask, how is this different than summary? Summary tells you what is being said. It condenses the main points and gives you a quick overview. Analysis, on the other hand, answers how and why. You use critical analysis to break down the elements of a topic and examine each part. For example, in academic writing, summary restates the author’s ideas, but analysis adds your own thoughts and interpretations. In business, summary gives you the facts, but analysis explains what those facts mean for your company. Critical analysis always involves your own thinking and conclusions. You look at the elements, ask questions, and connect ideas to form new insights.
Tip: Use analysis to go beyond the summary. Focus on the elements that matter most to your goals.
Critical analysis is more valuable than summary in business intelligence. When you use analysis, you do more than just report results. You extract, clean, and model large datasets. You look at the elements to find root causes and trends. This process helps you understand why something happened and how you can improve. Critical analysis supports leaders in making data-driven decisions. It helps you identify growth opportunities and avoid mistakes. By focusing on the elements and using analysis, you turn information into action. Critical analysis gives you the power to guide your business toward success.
When you start writing a critical analysis, you need a strong thesis statement. This statement tells your reader what you believe and what you will prove in your analytical essay. A clear and concise thesis keeps your analysis focused and helps you avoid vague or broad claims. You should always make your thesis statement specific and arguable. This approach gives your analytical paragraph a clear direction.
Tip: Before you begin, ask yourself, "What is the main point I want to make?" Write your thesis statement in one sentence. Then, check if every analytical paragraph supports this idea.
After you define your thesis statement, you must gather strong evidence. In business intelligence, this means gathering relevant information from reliable sources. You can use statistics, factual statements, and logical arguments to support your claims. FineBI helps you streamline this process by integrating data from multiple sources, making it easier to provide evidence for your analysis.
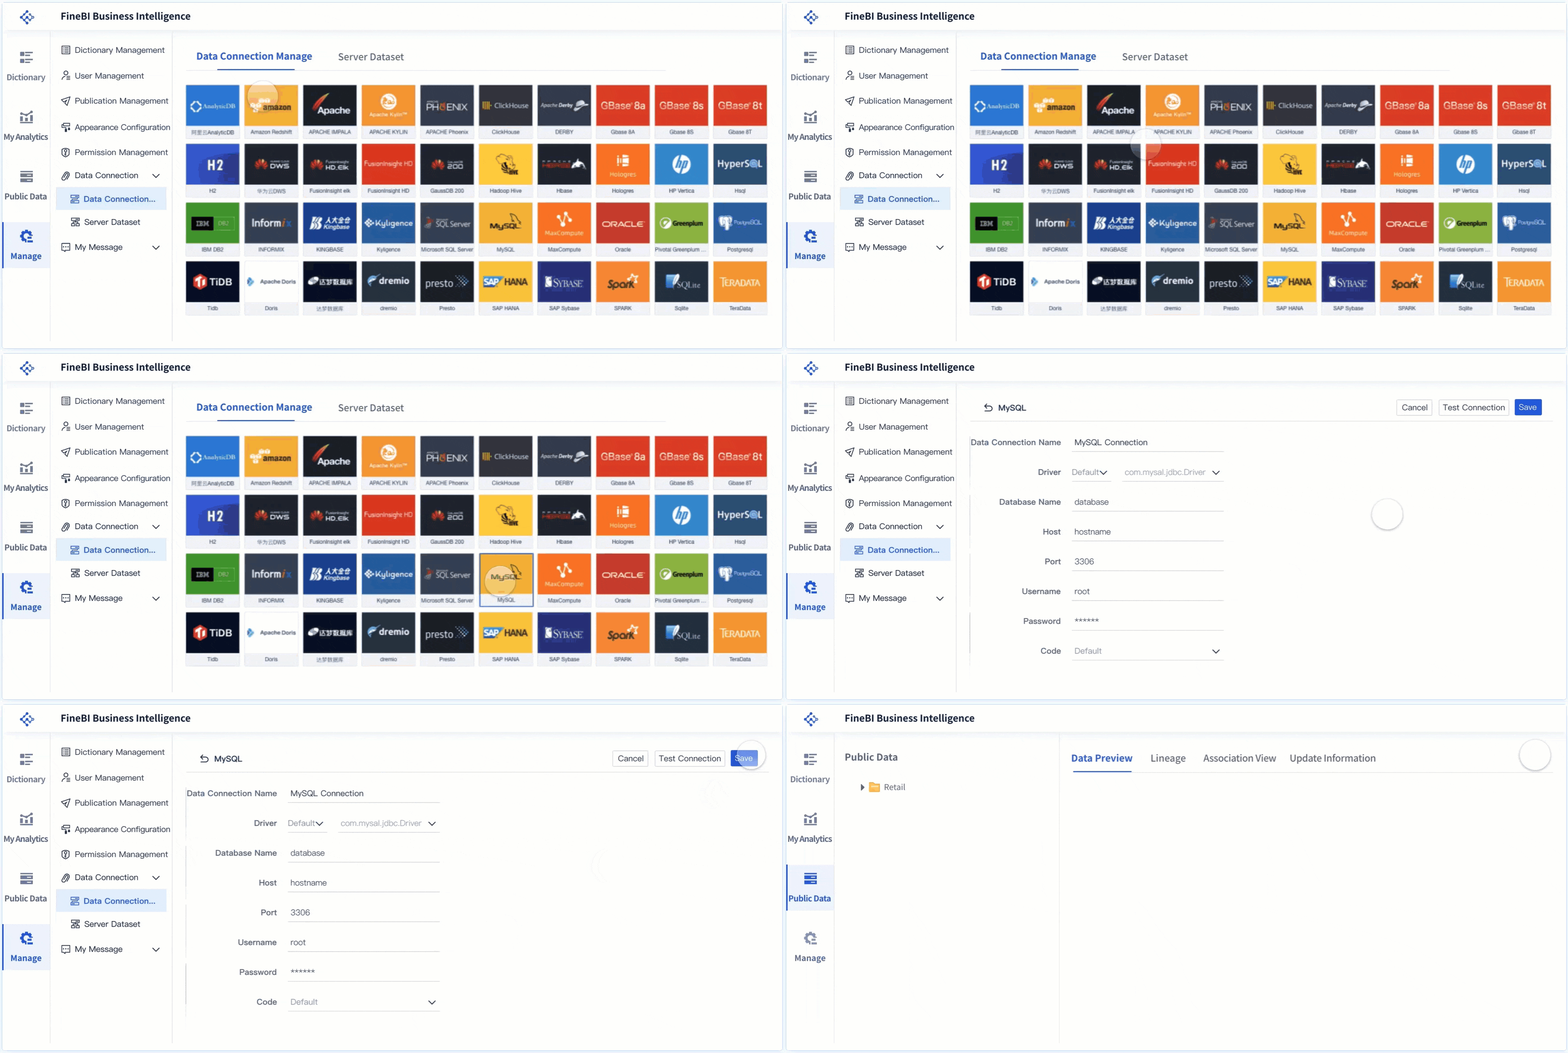
FineBI allows you to centralize your data, reducing errors and saving time. You can explore data, generate reports, and share insights without waiting for IT support. This self-service approach makes writing a critical analysis more efficient and accurate.
Writing tips: Always check the credibility of your sources. Use a mix of statistics and logical reasoning to make your analytical paragraph persuasive
Organizing your data and ideas is key to writing a critical analysis. Experts recommend using a clear structure for your analytical essay. You can use the MEAL plan for each analytical paragraph:
| Organization Method | Description and Use Case |
|---|---|
| Most general to most specific | Start with broad ideas, then move to detailed examples. |
| Chronologically | Present ideas in time order, useful for trends or changes. |
| Cause and effect | Show how one event leads to another. |
| Most important to least important | Begin with your strongest points to capture attention. |
| Compare and contrast | Highlight similarities and differences between two ideas. |
| Problem and solution | Present a challenge, then offer solutions. |
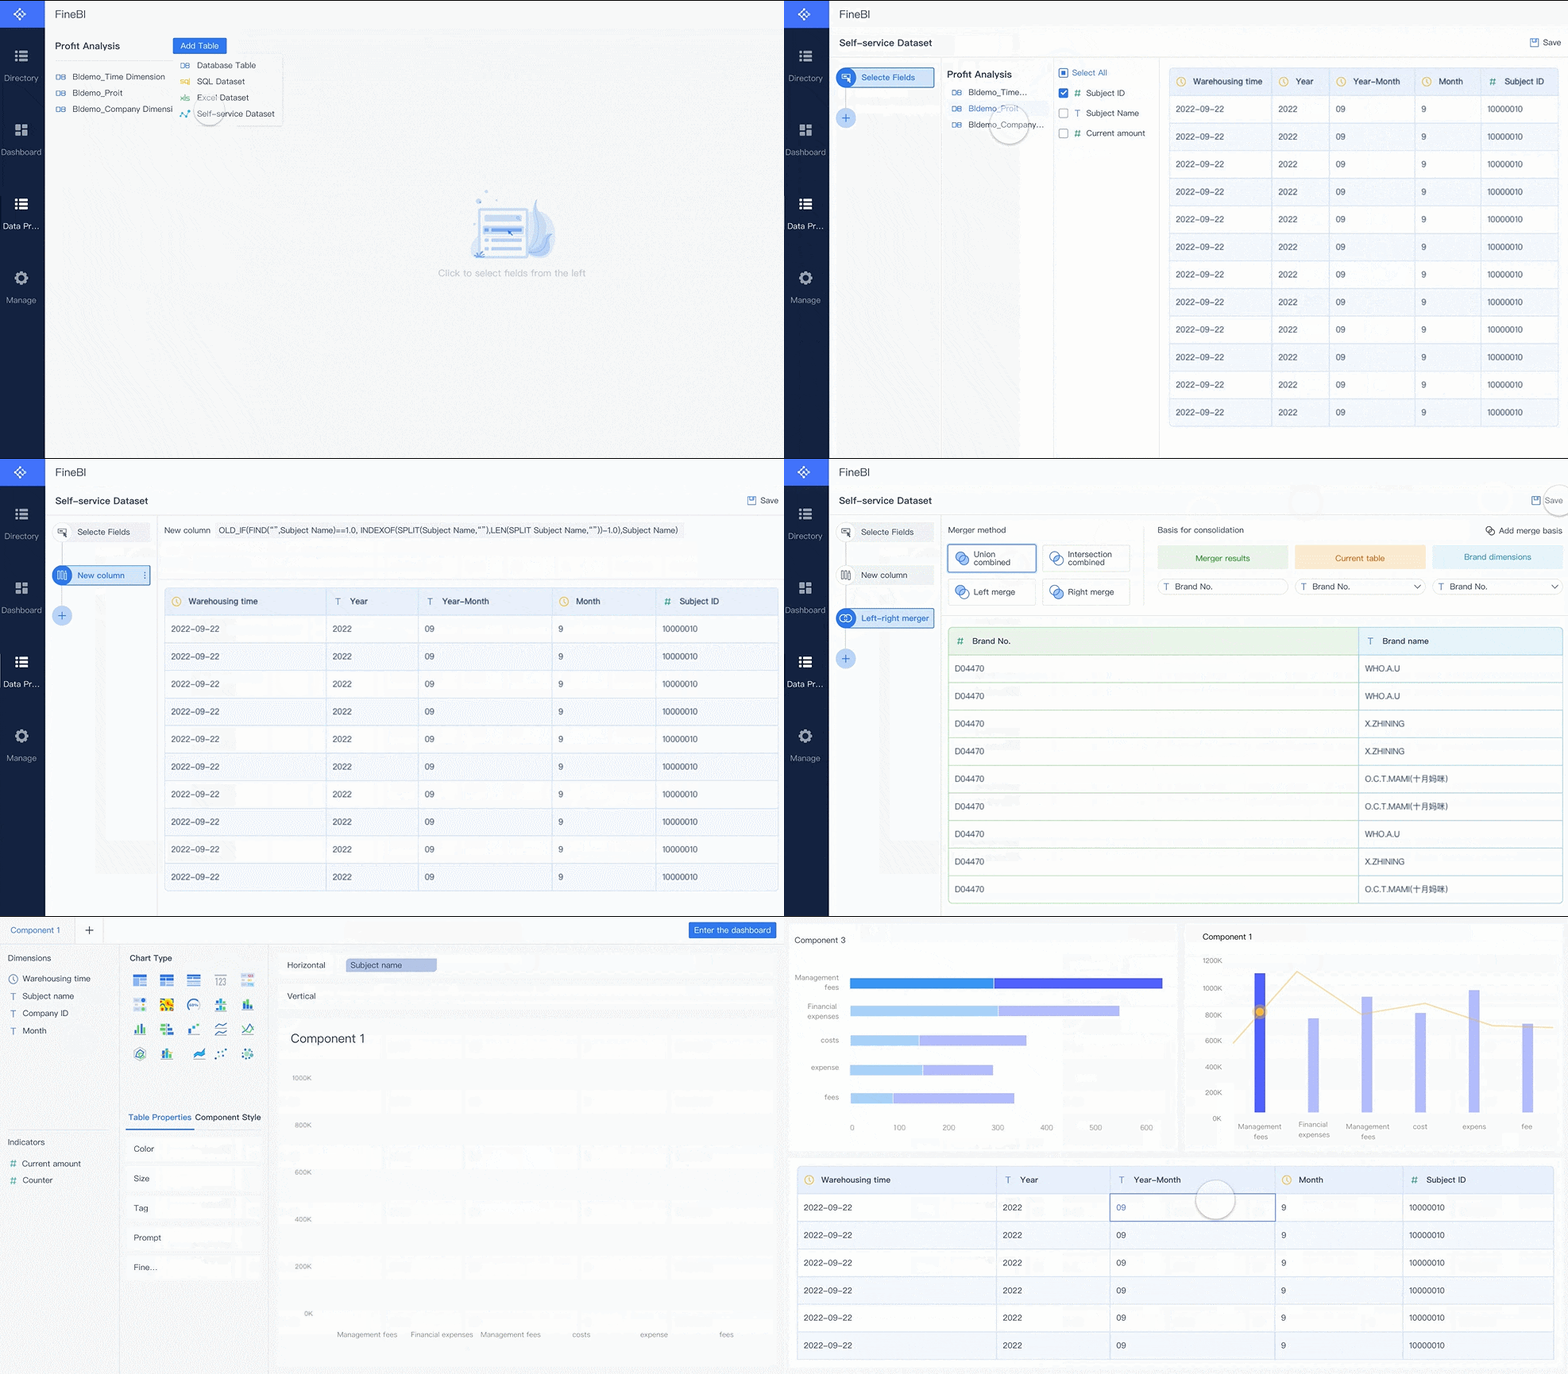
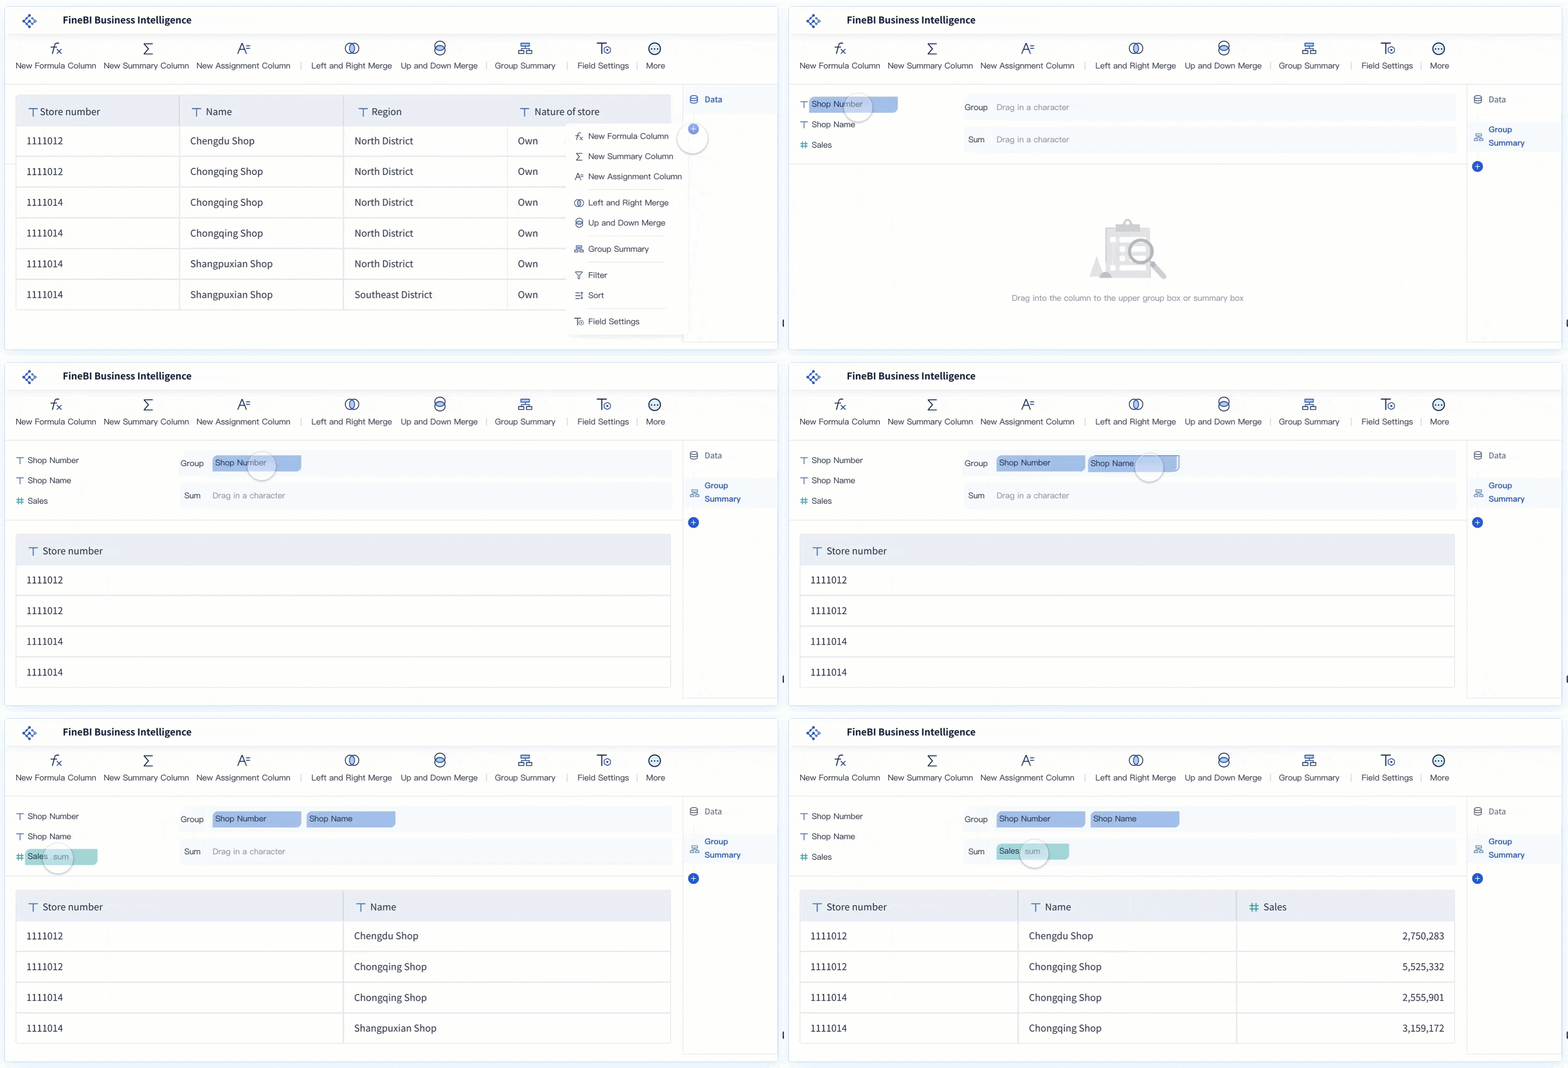
FineBI supports organizing your data by letting you join tables, filter records, and create custom datasets. This makes structuring your analysis much easier. You can preview your data at every step, ensuring each analytical paragraph has a clear topic sentence and supporting evidence.
Note: Reverse outlining is a helpful revision strategy. After drafting, check if each analytical paragraph connects to your thesis statement and supports your main argument.
Now you are ready to write your analytical paragraph. Each paragraph should begin with a topic sentence that introduces the main idea. Follow with supporting evidence, then analyze how this evidence proves your thesis statement. End with a sentence that links back to your main argument or leads to the next analytical paragraph.
Here is a simple structure for an analytical paragraph:
Writing tips: Use present tense and active voice. Avoid repetitive language and generic verbs. Proofread your analytical paragraph for grammar and spelling errors.
FineBI can help you draft analytical paragraphs by providing real-time data and visualizations. You can use its drag-and-drop tools to create charts that support your analysis. This makes providing sufficient evidence much easier and helps you avoid common mistakes like weak organization or lack of depth.
Remember: Each analytical paragraph should support your thesis statement. Organizing your data and structuring your analysis clearly will make your critical analysis more persuasive and professional.
You can create a powerful analysis example using FineBI by following a clear process. Let’s walk through a real-world analytical paragraph step by step:
Here is how an analytical paragraph might look in your report:
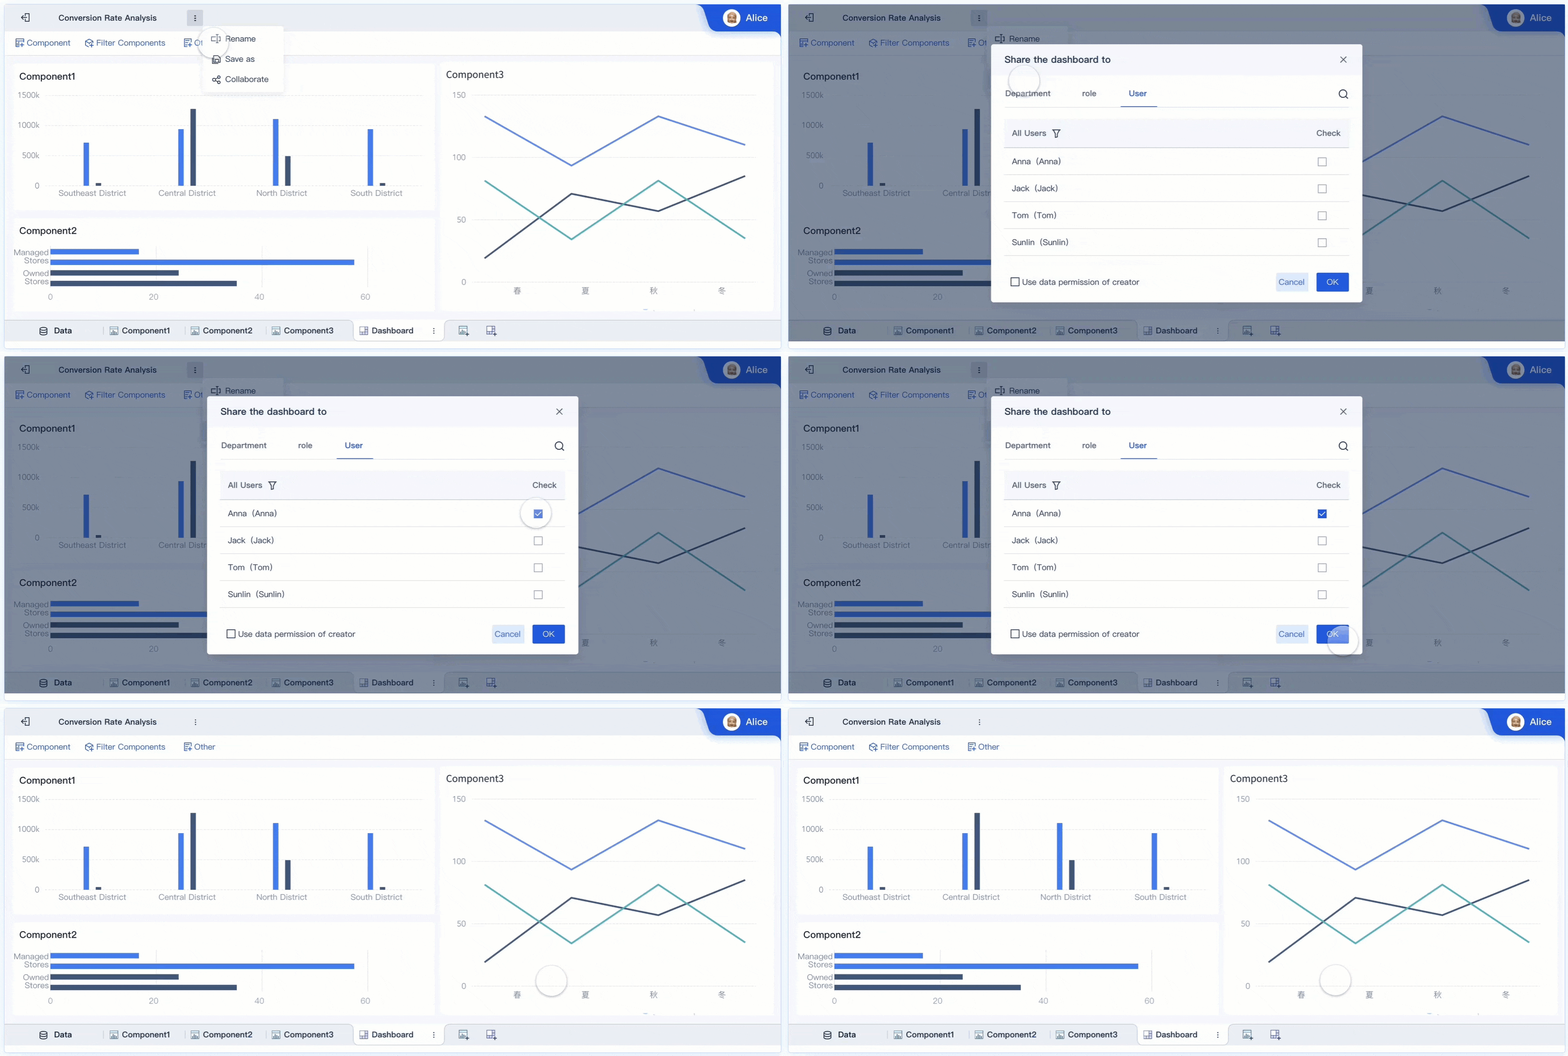
The analysis of contract data in FineBI reveals that purchase quantities vary significantly by contract type. After uploading the contract Excel table, I grouped the data by Contract Type and calculated total Purchase Quantity for each group. Using a Partitioned Column Chart, I visualized these differences, which showed that Type A contracts accounted for 60% of total purchases, while Type B and Type C made up the rest. This pattern suggests that focusing on Type A contracts could drive higher sales. The dashboard, titled "Analysis of Purchase Quantity for Different Contract Types," presents these findings clearly. By sharing this dashboard with my team, I enabled collaborative review and discussion, leading to actionable recommendations for our sales strategy.
In this analytical paragraph, you see a clear topic sentence that introduces the main idea. The paragraph then provides evidence from the data, explains the significance, and links back to the thesis. Each step in the analysis example uses FineBI’s features to make your analysis more effective.
You can write a stronger analysis by following a few best practices when using FineBI. Start every analytical paragraph with a topic sentence that states your main point. This approach helps your reader understand the focus of your analysis right away.
FineBI supports real-time data analysis and visualization. You can connect directly to databases like TDengine without writing code. This feature lets you analyze time-series data instantly. FineBI’s high-performance engine processes large volumes of data quickly, so you can handle both real-time and historical analysis in your paragraph. The drag-and-drop interface makes it easy to build dashboards and visualizations, even if you have no coding experience.
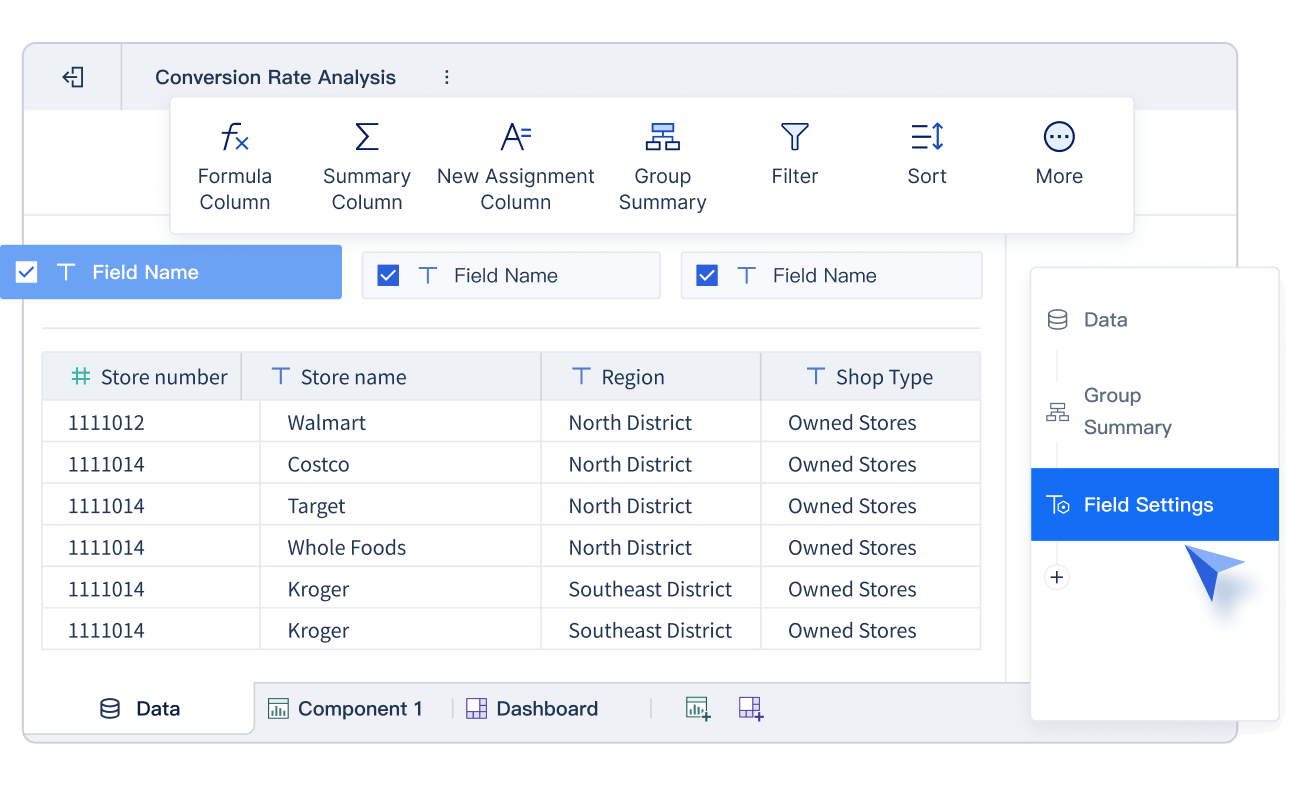
You can also collaborate with your team in FineBI. Share dashboards, edit together, and review findings in real time. This teamwork leads to a stronger analysis and more credible results. FineBI provides real-time feedback and validation, so you know your analysis is accurate and reliable.
Here is a table comparing traditional analysis methods with FineBI:
| Aspect | Traditional Analysis Methods | FineBI (Business Intelligence Tool) |
|---|---|---|
| Interaction | Fixed reports | Interactive drag-and-drop analysis |
| User Autonomy | IT-dependent | Business users analyze data independently |
| Purpose | Operational reporting | Actionable knowledge for strategic decisions |
| Data Handling | Direct database connection | High-performance engine, real-time options |
| Analysis Mode | Fixed format | Self-service OLAP, flexible |
| Mobility | Limited | Mobile viewing and sharing |
FineBI improves your analysis efficiency by at least 50%. You can complete the entire analysis process in one workflow. Real-time feedback and validation make your analytical paragraph more trustworthy. FineBI’s features—like data visualization, collaboration, and predictive analytics—help you deliver a stronger analysis example every time.
Tip: Always start your paragraph with a clear topic sentence. Use FineBI’s visual tools to support your analysis and make your findings easy to understand.
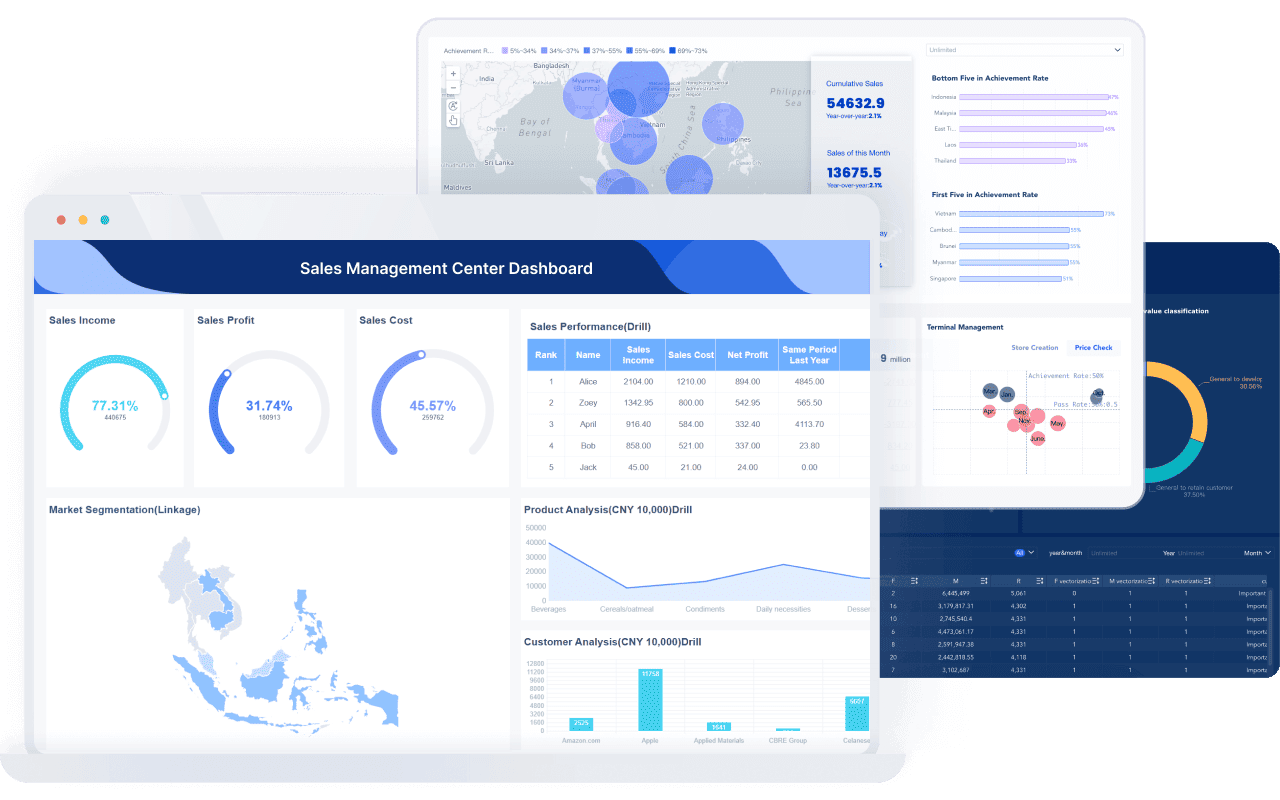
You want your critical analysis to be clear and objective. Start by writing every paragraph with a strong topic sentence. This helps your reader know what to expect. Use neutral language and avoid emotional words. When you write, focus on facts and evidence. Support your claims with data and avoid personal opinions. FineBI helps you present data visually, making your analysis easier to understand. You can use charts and graphs to show patterns and trends. This approach keeps your critical analysis focused and unbiased.
To improve clarity and objectivity in your critical analysis, follow these steps:
Tip: Always check that each topic sentence matches the main idea of your paragraph. This habit will help you draw conclusions that are logical and well-supported.
Revision is key to strong critical analysis. After you finish your first draft, review each paragraph for structure and flow. Make sure every topic sentence introduces the main idea. Check that your evidence supports your claims. Use a reverse outline to see if your analysis follows a logical order. Color-code or highlight different parts of your paragraph to spot weak areas.
Here are some effective revision strategies:
Common pitfalls in business analysis include losing sight of business objectives, using ambiguous language, and not leveraging modern tools. FineBI helps you avoid these mistakes by offering intuitive visualizations and collaboration features. You can share your analysis with your team, get real-time feedback, and ensure your critical analysis is accurate and actionable.
Note: Strong critical thinking skills help you revise your analysis. Always check if your paragraph supports your thesis and helps you draw conclusions based on evidence.
You can write a strong analysis by following a clear process. Prepare and clean your data, focus your analysis, and visualize your findings. FineBI helps you streamline each step, making your work faster and more accurate. Structure each analytical paragraph with a topic sentence, evidence, and a clear link to your main idea. Revise for clarity and impact. In your own projects, practice analysis writing with real data. Use a dynamic checklist to guide your improvement. This approach leads to better decisions and a more effective conclusion in every report.
Click the banner below to try FineBI for free and empower your enterprise to transform data into productivity!

The Author
Lewis
Senior Data Analyst at FanRuan
Related Articles

Self-Service Analytics Defined and Why You Need It
Self-service analytics lets you analyze data without IT help, empowering faster, data-driven decisions and boosting agility for your business.
Lewis
Jan 04, 2026

Best Self-Service Tools for Analytics You Should Know
See which self-service tools for analytics let business users access data, build dashboards, and make decisions faster—no IT help needed.
Lewis
Dec 29, 2025

Understanding Predictive Analytics Services in 2026
Predictive analytics services use data and AI to forecast trends, helping businesses make informed decisions, reduce risks, and improve efficiency in 2026.
Lewis
Dec 30, 2025