A customer intelligence dashboard is a reporting and analytics tool that unifies customer data into one view so teams can track behavior, trends, risks, and revenue-impacting decisions faster.
All dashboards in this article were generated by FineBI.
What to look for in a customer intelligence dashboard
Before comparing vendors, define the core jobs your customer intelligence dashboard must handle:
Unify customer data from CRM, product analytics, support, billing, marketing, and success systems
Surface trends and signals such as churn risk, expansion potential, campaign performance, or service bottlenecks
Support faster decisions with dashboards that are easy to use, trusted, and tailored to each team
The right platform depends less on flashy charts and more on whether it can answer operational questions consistently. In practice, buyers should evaluate six areas.
Core evaluation factors of customer intelligence dashboard
1. Integrations and data connectivity
A dashboard is only as useful as the data it can access. Look for native connectors to tools such as Salesforce, HubSpot, Zendesk, Intercom, Stripe, Snowflake, BigQuery, and product analytics platforms.
Best for:
Marketing: ad, campaign, CRM, and attribution data
Sales: CRM, pipeline, account activity, and enrichment data
Customer success: usage, renewals, support, and account health data
Support: ticketing, CSAT, SLA, and knowledge base data
Operations: warehouse, ERP, finance, and governance layers
2. Identity resolution and customer unification
Many teams struggle with fragmented customer records across accounts, contacts, devices, subscriptions, and support interactions. A strong customer intelligence dashboard should help consolidate these into a usable customer or account view.
Best for:
B2B teams that need account-level reporting
Lifecycle marketing that depends on consistent profiles
Customer success teams that need health scoring across touchpoints
3. Reporting flexibility
Some teams need fixed dashboards with standard KPIs. Others need ad hoc exploration, drill-downs, custom dimensions, and advanced metrics. Evaluate whether the tool supports both executive summary dashboards and analyst-grade reporting.
Best for:
Executives: high-level performance snapshots
Managers: drill-downs by segment, region, rep, or account tier
Analysts: custom models, cohort analysis, and cross-source joins
4. Usability and adoption
A technically powerful platform can still fail if business users avoid it. Review dashboard usability, self-service exploration, alerting, collaboration, and mobile access.
Best for:
Cross-functional teams that need fast access without analyst support
Lean teams that cannot maintain a complex BI stack
Frontline managers who need action-oriented reporting
5. Governance and security
As customer reporting grows, so do concerns about access control, metric consistency, and compliance. Enterprise teams should prioritize semantic layers, role-based permissions, auditability, and certified reporting.
Best for:
Enterprises with multiple departments and regulated data
Data teams managing shared metrics
Operations leaders reducing reporting sprawl
6. Total cost
Total cost includes more than subscription fees. Factor in implementation time, data modeling effort, training, consulting, maintenance, and internal ownership.
Best for:
Startups: fast deployment and lower admin overhead
Mid-market teams: balance between flexibility and manageability
Enterprises: scalable architecture and governance even at higher upfront cost
A useful rule of thumb: for personal or lightweight team use, open-source products can be enough; for enterprises handling enterprise-grade data and governance requirements, a dedicated enterprise dashboard platform such as FineBI is usually more appropriate.
10 customer intelligence dashboard tools compared at a glance
How the comparison is structured
Each tool below is reviewed using the same lens:
Primary use case
One-sentence overview
Key features
Pros & cons
Best for
Pricing approach
This structure makes side-by-side differences easier to evaluate, especially when comparing customer intelligence platforms, BI tools, and service intelligence dashboards that overlap but are not identical.
Quick comparison table
Tool
Primary Strength
Main Weakness
Implementation Effort
Best-Fit Company Type
Gainsight
Customer success and account health
Can be complex and expensive
High
Mid-market to enterprise B2B
Salesforce CRM Analytics
Deep Salesforce and service ecosystem integration
Best value depends on Salesforce stack
Medium to high
Salesforce-centric organizations
Totango
Practical customer success dashboards and playbooks
Customer intelligence dashboard tool breakdown: features, pros, cons, and best-fit teams
1. FineBI
One-sentence overview:FineBI is an enterprise BI and dashboard platform designed for governed self-service analytics, scalable reporting, and cross-functional customer intelligence.
Key Features:
Self-service dashboard creation with centralized governance
Strong support for enterprise data sources and large datasets
Reusable data models and shared metrics
Interactive visual analysis for customer, sales, and service reporting
Permission controls for multi-department deployment
Pros & Cons:
Pros: Well suited for enterprises that need standardized customer dashboards across departments; balances self-service with governance; useful when reporting must scale beyond one team.
Cons: More than smaller teams may need; implementation works best with defined data ownership and BI processes.
Best For (Target user/scenario): Enterprises managing enterprise-grade customer data, especially where multiple business units need consistent dashboard access.
Pricing approach: Typically quote-based for business and enterprise deployments.
One-sentence overview: Salesforce CRM Analytics extends the Salesforce ecosystem with dashboards for pipeline, customer engagement, service metrics, and account intelligence.
Key Features:
Pros: Strong fit for teams already standardized on Salesforce; useful for combining service intelligence dashboards with sales visibility; supports operational workflows well.
Cons: Less attractive if your stack is not Salesforce-centered; advanced analytics can raise cost and complexity.
Best For (Target user/scenario): Organizations running sales, service, and account operations primarily in Salesforce.
Pricing approach: Tiered enterprise pricing, often as part of a broader Salesforce contract.
3. Totango
One-sentence overview: Totango focuses on customer success intelligence with dashboards that help teams monitor onboarding, health, retention, and lifecycle progress.
Key Features:
Customer health monitoring
Segmentation and journey tracking
Success playbooks and alerts
Account and portfolio views
Integrations with CRM and support tools
Pros & Cons:
Pros: More accessible than some heavier enterprise CS platforms; practical for CS managers; useful balance of analytics and action.
Cons: Not as flexible as full BI platforms for cross-functional reporting; advanced customization may be limited compared with warehouse-first tools.
Best For (Target user/scenario): Customer success teams that want guided retention and lifecycle dashboards without building a BI stack from scratch.
Pricing approach: Custom pricing.
4. Tableau
One-sentence overview: Tableau is a mature BI platform known for interactive dashboards and deep visual analysis across customer, revenue, and operational data.
Key Features:
Pros: Excellent for flexible customer insights dashboards; strong for full-funnel reporting; supports sophisticated storytelling across teams.
Cons: Requires clean data and ownership; licensing can become costly at scale; self-service quality depends on governance.
Best For (Target user/scenario): Organizations with analysts or BI teams that need broad, customizable customer intelligence dashboard capabilities.
Pricing approach: Per-user pricing with different viewer, explorer, and creator tiers.
5. Power BI
One-sentence overview: Power BI is a cost-effective BI platform that works especially well for customer reporting in Microsoft-centric environments.
Key Features:
Pros: Strong value for money; flexible enough for marketing, sales, support, and finance use cases; familiar for many business users.
Cons: Complex models can become difficult to maintain; dashboard sprawl is common without governance; some advanced scenarios require premium capacity.
Best For (Target user/scenario): SMB and enterprise teams that want a flexible customer intelligence dashboard at relatively low software cost.
Pricing approach: Low entry cost with premium options for enterprise scale.
6. Gainsight
One-sentence overview: Gainsight is a customer success platform built for B2B teams that need account health, retention tracking, and expansion visibility across the customer lifecycle.
Key Features:
Customer health scoring
Renewal and churn risk dashboards
Journey orchestration and playbooks
CRM and product usage integrations
Account-level reporting for CS and leadership
Pros & Cons:
Pros: Strong for managing complex account portfolios; purpose-built for retention and expansion workflows; aligns dashboards with action.
Cons: Implementation can be resource-intensive; customization often requires mature CS operations; pricing is usually enterprise-oriented.
Best For (Target user/scenario): B2B SaaS, recurring revenue businesses, and customer success teams managing high-value accounts.
Pricing approach: Custom pricing.
7. Looker
One-sentence overview: Looker is a modern BI platform that emphasizes governed metrics, reusable semantic modeling, and embedded analytics.
Key Features:
Semantic layer for metric consistency
SQL-based modeling
Embedded dashboards
Cloud warehouse integration
Self-service exploration on governed data
Pros & Cons:
Pros: Excellent for organizations that need one source of metric truth; good fit for customer analytics built on modern cloud warehouses; supports scale well.
Cons: Requires technical modeling expertise; not the fastest option for teams wanting plug-and-play dashboards.
Best For (Target user/scenario): Mid-market and enterprise teams with modern data stacks and a strong analytics function.
Pricing approach: Custom pricing.
8. Zendesk Explore
One-sentence overview: Zendesk Explore is a reporting layer for support teams that need service intelligence dashboards tied directly to ticketing and customer service operations.
Key Features:
Ticket volume and resolution dashboards
SLA, CSAT, and agent performance reporting
Cross-channel service visibility
Custom support reporting
Native Zendesk integration
Pros & Cons:
Pros: Fast path to useful service reporting; minimal integration friction for Zendesk users; practical for frontline operations.
Cons: Narrower than a full customer intelligence dashboard; cross-functional customer views may require exporting or additional BI tools.
Best For (Target user/scenario): Support leaders, service operations, and CX teams standardizing on Zendesk.
Pricing approach: Bundled or tiered based on Zendesk plans.
9. Mixpanel
One-sentence overview: Mixpanel is a product analytics platform focused on user behavior, funnels, retention, and cohort analysis.
Key Features:
Event-based product analytics
Funnel and retention reporting
User segmentation
Cohorts and behavioral comparisons
Experiment and engagement analysis
Pros & Cons:
Pros: Strong for understanding feature adoption and user journeys; faster to launch than many enterprise BI stacks; useful for product-led growth.
Cons: Less complete for sales, support, and account-level reporting; may need to be paired with BI or warehouse tools for full customer intelligence.
Best For (Target user/scenario): Product, growth, and digital teams that prioritize in-app customer behavior insights.
Pricing approach: Free tier plus usage-based and enterprise plans.
10. HubSpot
One-sentence overview: HubSpot offers easy-to-launch dashboards for marketing, sales, and customer data, making it a practical option for smaller teams that value speed and simplicity.
Key Features:
CRM-based customer reporting
Marketing attribution and campaign dashboards
Sales pipeline and lifecycle views
Service metrics and contact history
Native automation and segmentation
Pros & Cons:
Pros: Quick setup; easy for non-technical users; good out-of-the-box reporting across go-to-market teams.
Cons: Less suitable for highly customized enterprise customer intelligence analytics; advanced cross-source reporting can be limiting.
Best For (Target user/scenario): Startups, SMBs, and growing revenue teams that need dashboards quickly without heavy BI implementation.
Pricing approach: Hub-based tiered pricing with additional cost for advanced features.
Real-world customer intelligence dashboard use cases by team
Marketing and growth teams
For marketing teams, a customer intelligence dashboard should connect acquisition activity to downstream revenue outcomes. The most useful setups combine ad platform data, web analytics, CRM lifecycle stages, and closed-won revenue.
Common marketing use cases include:
Audience segmentation: identify high-value customer groups by behavior, source, firmographic traits, or lifecycle stage
Campaign performance: compare spend, MQLs, pipeline, conversion rates, and revenue by channel
Funnel conversion: track movement from visitor to lead to opportunity to customer
Retention and reactivation: measure how onboarding, engagement, and campaigns affect customer value over time
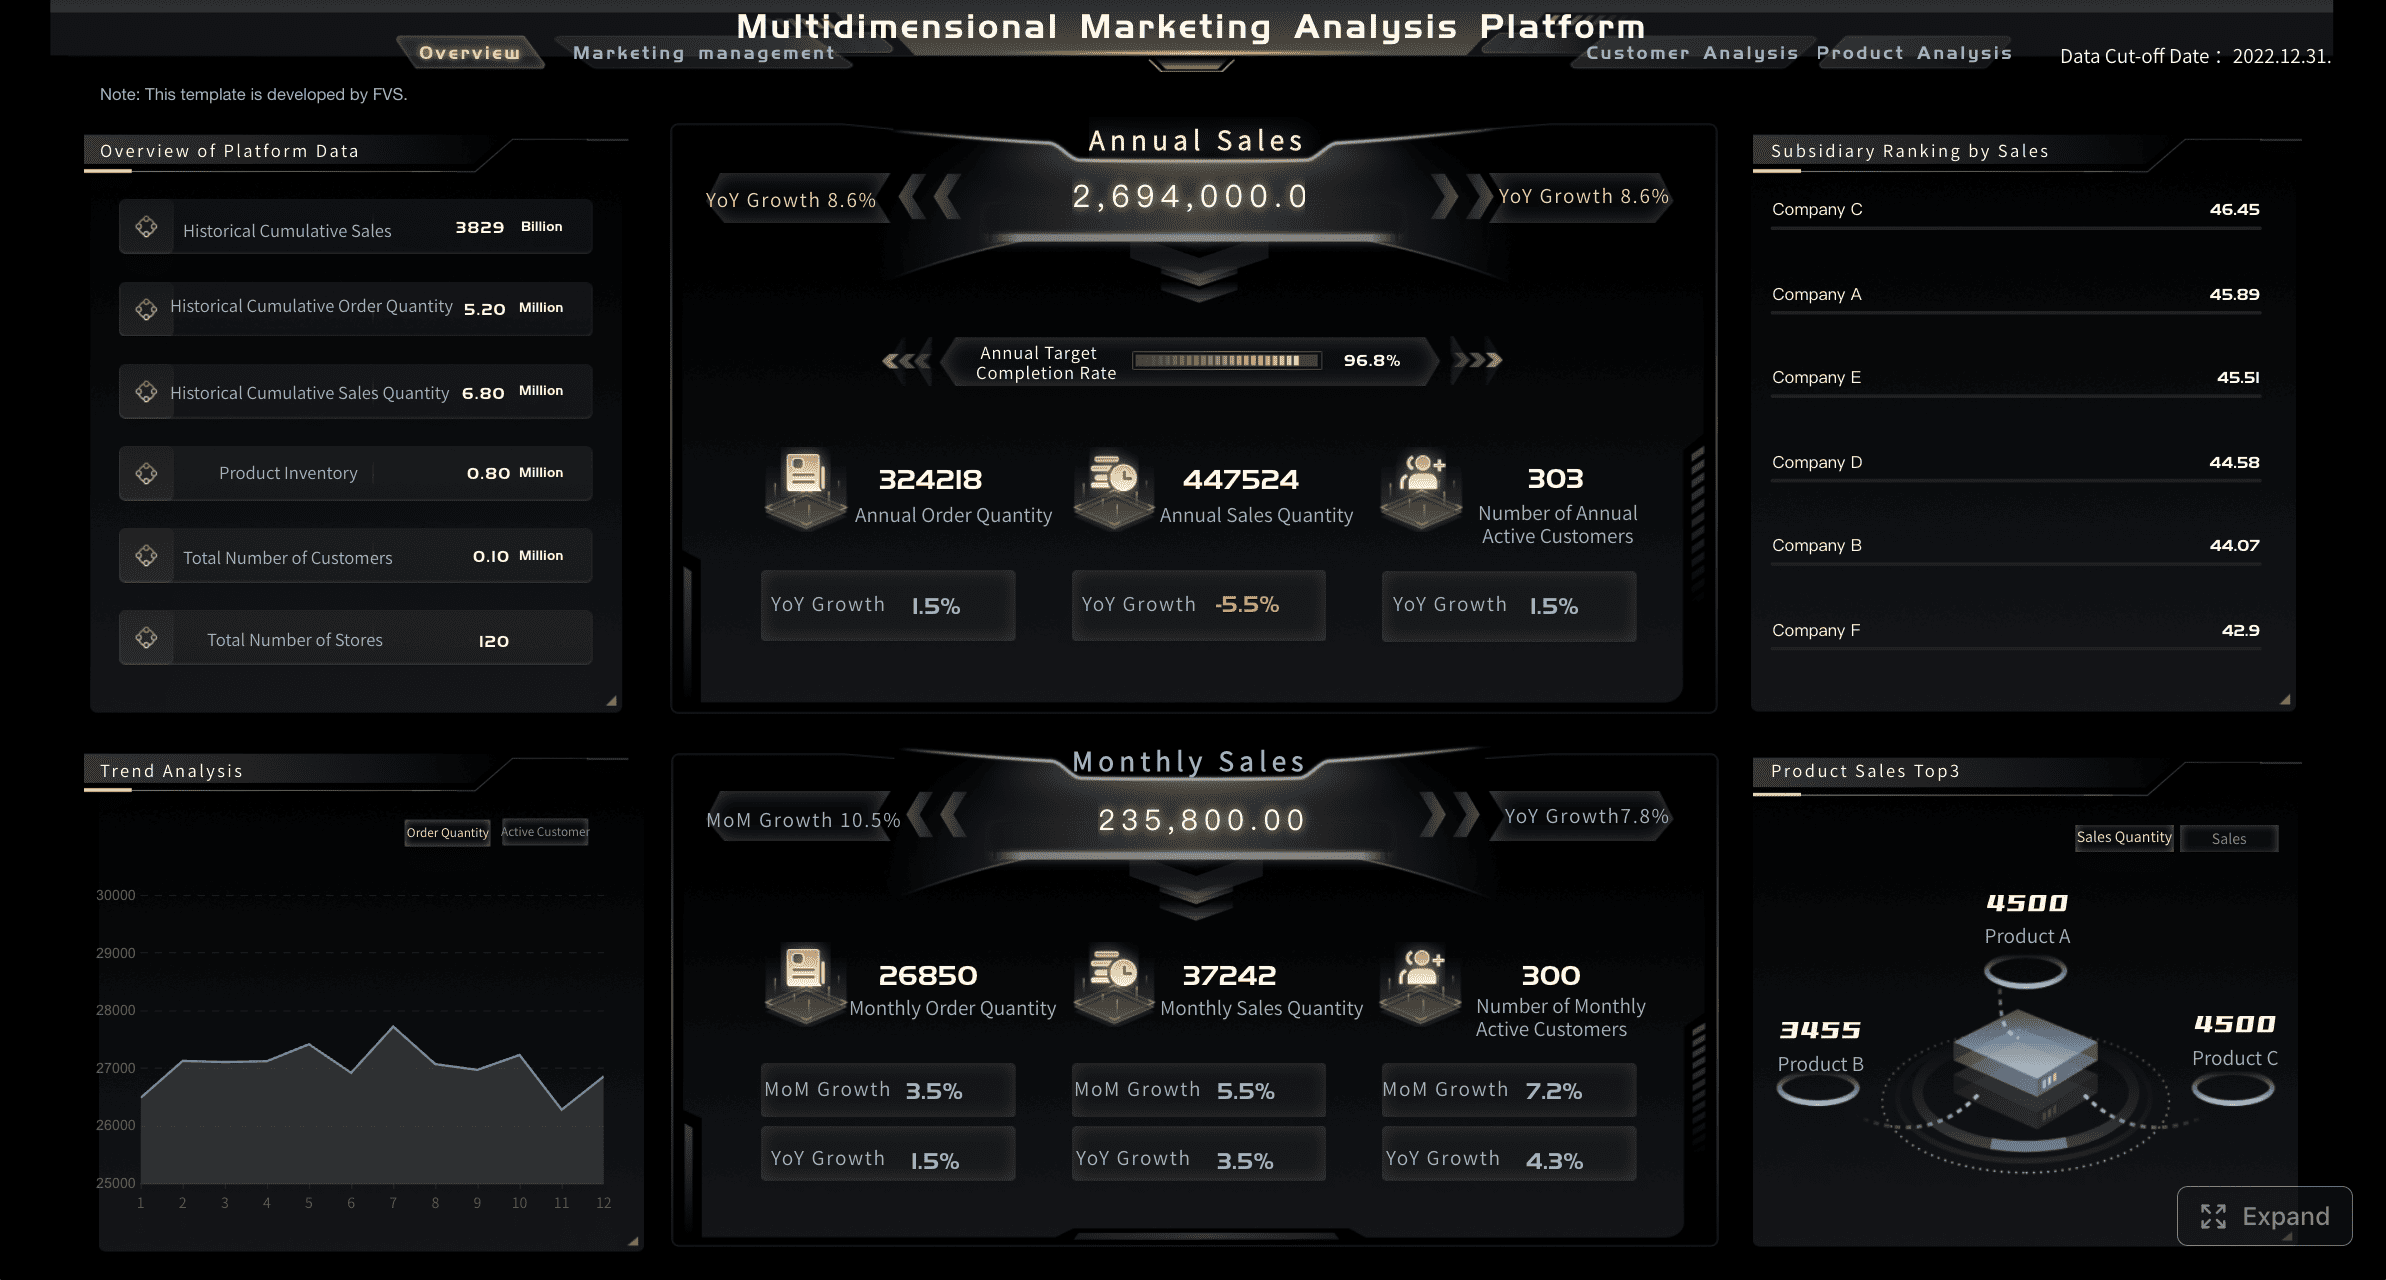
Figure 1: Customer Intelligence Marketing Dashboard created with FineBI
Best-fit tools here:
HubSpot for fast setup and SMB reporting
Tableau for full-funnel custom analysis
Power BI for cost-conscious marketing analytics
Looker for warehouse-driven metric consistency
A strong customer insights dashboard helps growth teams move beyond lead volume and focus on what drives efficient revenue.
Sales, success, and account teams
Sales and customer success teams often need a shared account view: pipeline status, product usage, support issues, stakeholder activity, renewal timing, and expansion signals in one place.
Typical use cases include:
Account health tracking: combine product adoption, support cases, NPS/CSAT, and executive engagement
Expansion signal detection: find customers with rising usage, new teams onboarded, or increased cross-sell potential
Churn risk monitoring: identify low engagement, support escalation, poor adoption, or declining sentiment
Prioritization: rank accounts for outreach based on risk and opportunity instead of rep intuition
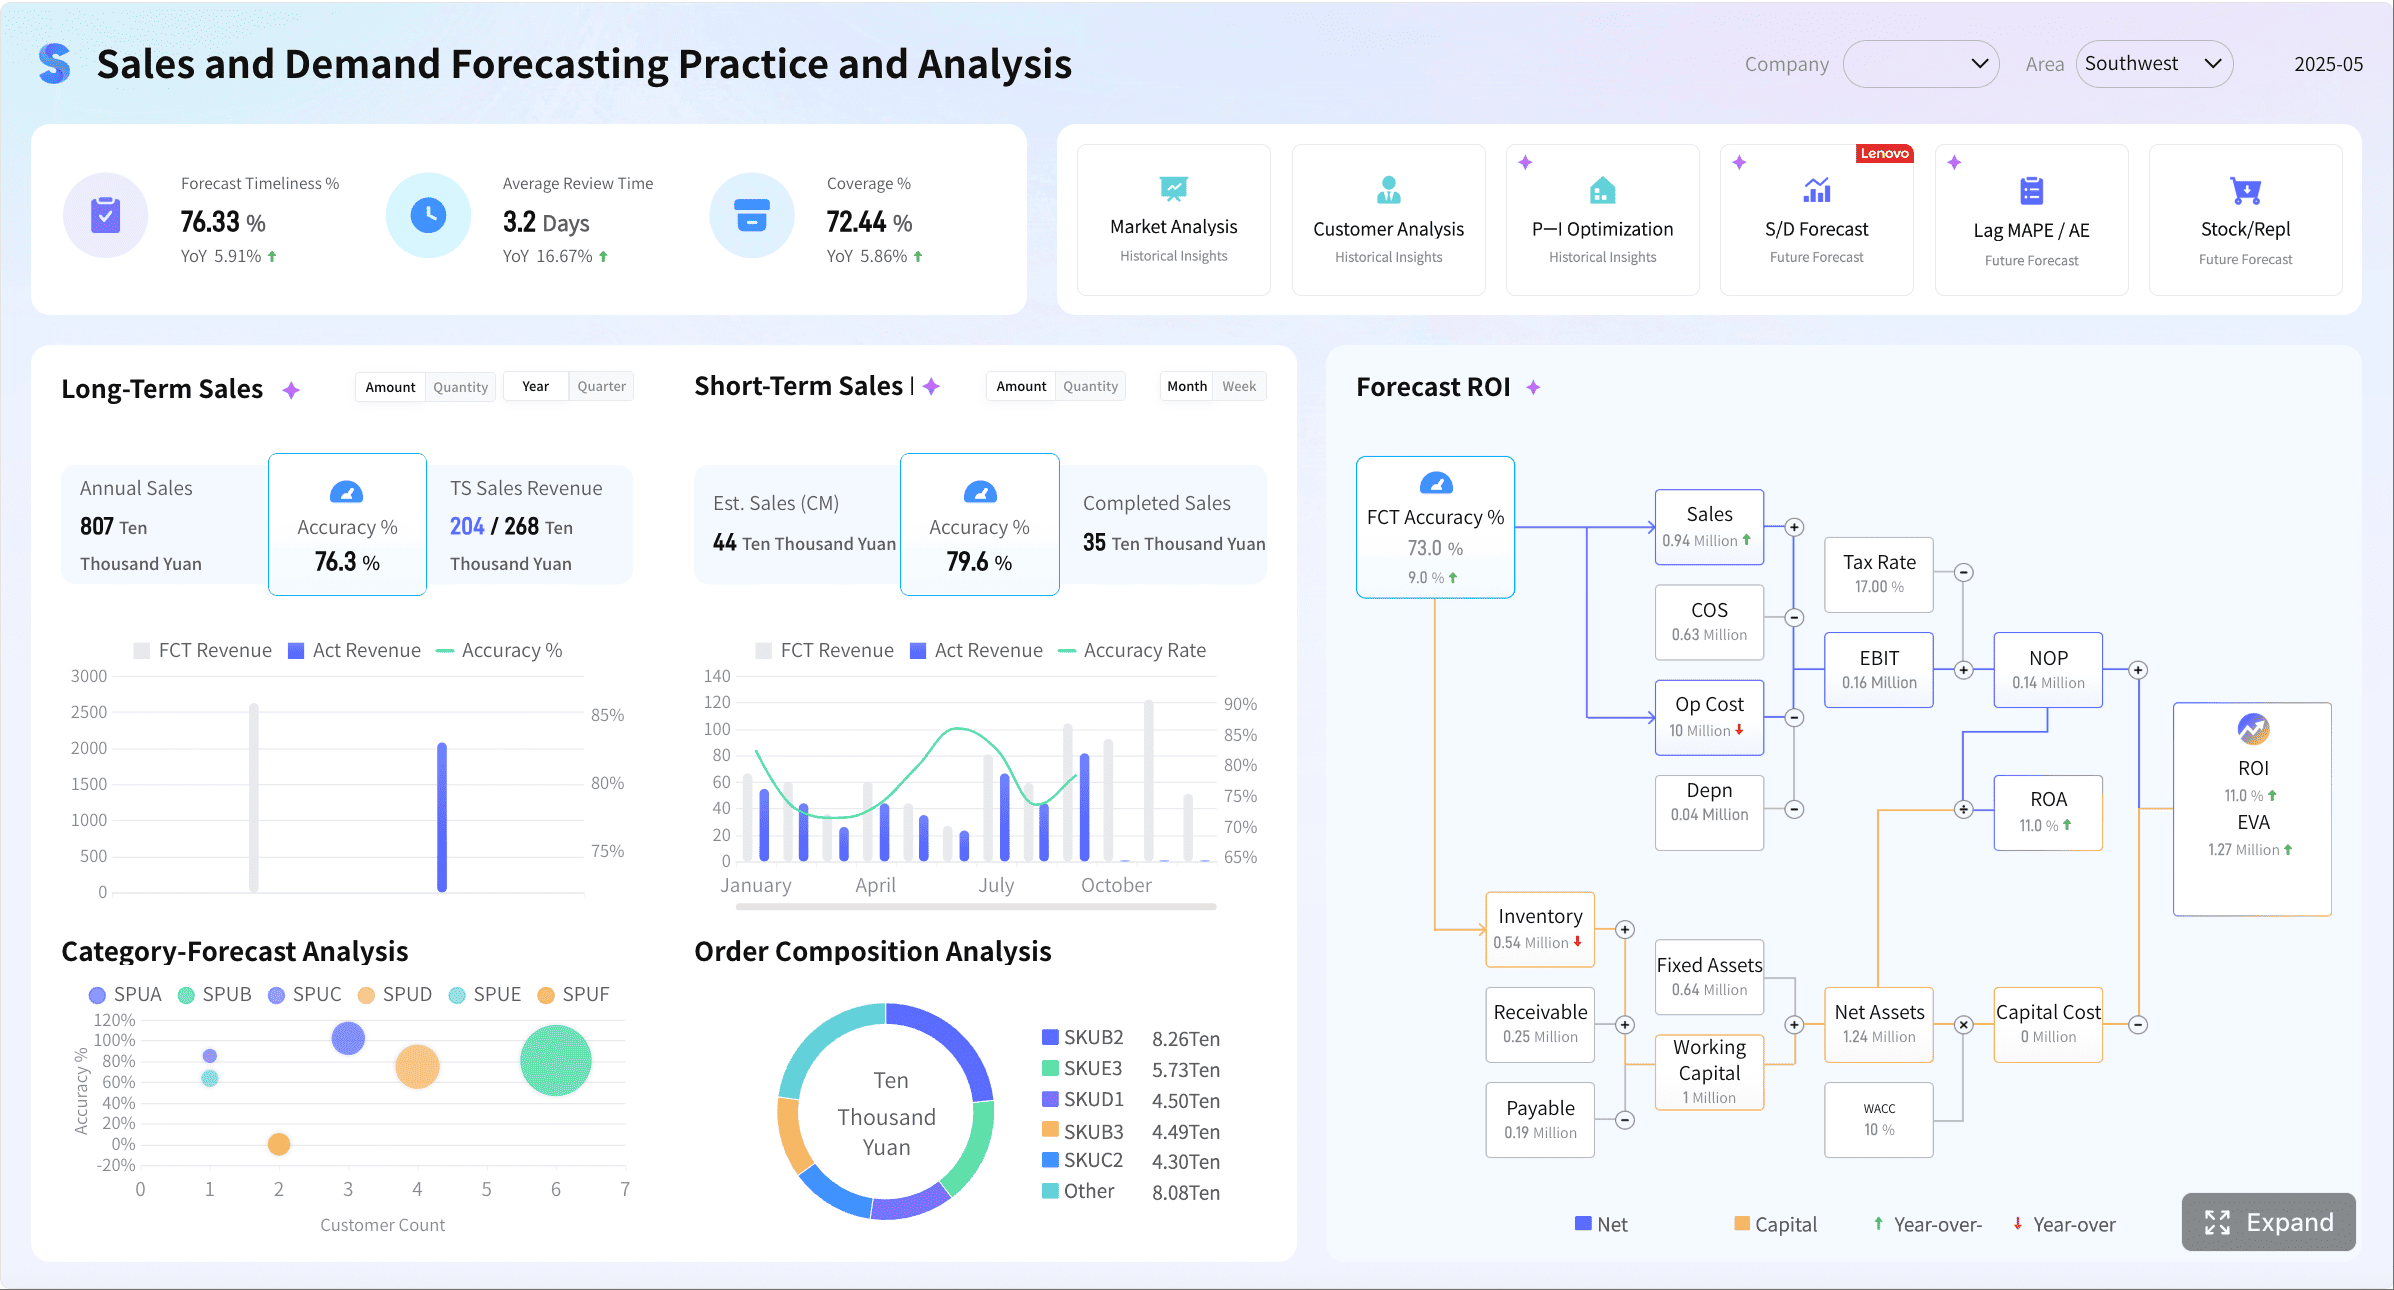
Figure 1: Customer Intelligence Sales Dashboard created with FineBI
Best-fit tools here:
Gainsight for mature B2B CS operations
Totango for practical lifecycle and health monitoring
Salesforce CRM Analytics for account and service views within Salesforce
FineBI for enterprise-wide account intelligence spanning departments
This is where customer intelligence analytics matters most: teams act on measurable signals rather than instincts.
Support and service operations
Support dashboards answer different questions than revenue dashboards. Service leaders need operational visibility into resolution speed, backlog trends, quality, customer satisfaction, and recurring issues.
High-value service use cases include:
Ticket trend monitoring: spikes by product area, region, channel, or customer segment
Resolution efficiency: first response time, time to resolution, reopen rates, and SLA adherence
Voice of customer analysis: complaint categories, sentiment, escalation themes, and root causes
Customer context: combine support interactions with account tier, lifecycle, and historical value
Best-fit tools here:
Zendesk Explore for support-native reporting
Salesforce CRM Analytics for service teams inside Salesforce
Tableau or Power BI when support data must be blended with revenue and product data
Specialized service intelligence dashboards often outperform general BI setups when frontline support teams need immediate operational reporting. General BI becomes more valuable when service metrics must be analyzed alongside product, sales, and financial outcomes.
How to choose the best-fit tool for your team
Match the tool to your data maturity
The best customer intelligence dashboard is the one that matches both your reporting needs and your operational maturity.
Startups and lean teams
Priorities:
Fast setup
Minimal admin overhead
Easy reporting for non-technical users
Best fits:
HubSpot
Mixpanel
Power BI if someone can own reporting
These teams usually benefit from simpler dashboards before investing in a full customer intelligence platform.
Mid-market teams
Priorities:
Better cross-functional visibility
More customization
Scalable reporting without enterprise overhead
Best fits:
Totango
Power BI
Tableau
Looker if a warehouse is already in place
Mid-market companies often need to balance flexibility with adoption. The wrong choice here is usually either an underpowered SMB tool or an overbuilt enterprise platform.
If the requirement is enterprise-grade data management across departments, a governed enterprise dashboard platform is more suitable than a lightweight or open-source setup. Open-source tools may be sufficient for personal use or small internal projects, but large-scale customer intelligence reporting generally needs enterprise-grade controls.
Avoid common buying mistakes
Many dashboard purchases fail for reasons unrelated to chart quality. Watch for these common mistakes:
Underestimating implementation effort: even “easy” tools need clean definitions, ownership, and integration work
Ignoring dashboard ownership: someone must maintain metrics, permissions, and stakeholder requests
Buying for one team only: a support-first or product-first tool may not serve broader customer intelligence needs
Overvaluing surface-level usability: simple interfaces do not replace data quality or metric consistency
Creating reporting sprawl: too many dashboards without standard KPI definitions reduce trust and adoption
Skipping adoption planning: if managers do not review dashboards in workflows, usage drops quickly
The best tool answers current questions while leaving room for deeper customer intelligence analytics later.
Final shortlist checklist
Use this checklist to build a practical shortlist:
Use case: Do you need marketing funnel reporting, account health, service intelligence, product usage, or all of the above?
Integrations: Does the platform connect cleanly to your CRM, helpdesk, warehouse, billing, and product tools?
Reporting depth: Do you need fixed dashboards, self-service exploration, or advanced modeling?
Governance: Are permissions, shared metrics, and auditability important?
Budget: What is the true cost including setup, admin time, and training?
Internal expertise: Do you have analysts, BI developers, or only business users?
Scalability: Will the tool still fit as your customer data volume and team count grow?
A simple decision framework works well:
Start with the primary team and use case
List the must-have integrations
Decide whether you need a platform or a point solution
Assess implementation capacity honestly
Shortlist 2 to 3 tools only
Run a pilot using real customer questions, not demo scenarios
If you need broad, cross-functional customer intelligence with strong visualization and governance, shortlist BI-first platforms. If your priority is retention and account health, shortlist CS-focused tools. If you need fast operational reporting for smaller teams, favor lightweight options that can launch quickly.
The best customer intelligence dashboard is not necessarily the most advanced one. It is the one your teams will trust, adopt, and use to make better decisions every week.
FAQs
A customer intelligence dashboard brings customer data from multiple systems into one view so teams can monitor behavior, revenue trends, churn risk, and service performance. It helps marketing, sales, support, and customer success make faster, more consistent decisions.
Start by matching the tool to your main use case, such as customer success, product analytics, support reporting, or enterprise BI. Then compare integrations, identity resolution, reporting flexibility, usability, governance, and total implementation cost.
The most important features are strong data connectors, a unified customer or account view, flexible reporting, and role-based access controls. Teams should also look for alerting, self-service exploration, and governance tools that keep metrics trustworthy.
A customer intelligence dashboard focuses specifically on customer behavior, lifecycle signals, account health, and revenue-impacting actions. A BI tool is broader and can analyze many business areas, but it may need more setup to support customer-specific use cases well.
FineBI is a better fit when an organization needs governed self-service analytics, scalable reporting, and stronger control over metric consistency and permissions. It is usually most suitable for enterprises managing complex data and cross-functional reporting at scale.
Product Trial
FineReport
Pixel-perfect reports · Interactive dashboards · Easy data entry · Digital twins


 Key Features:
 Pros & Cons:
 Key Features:
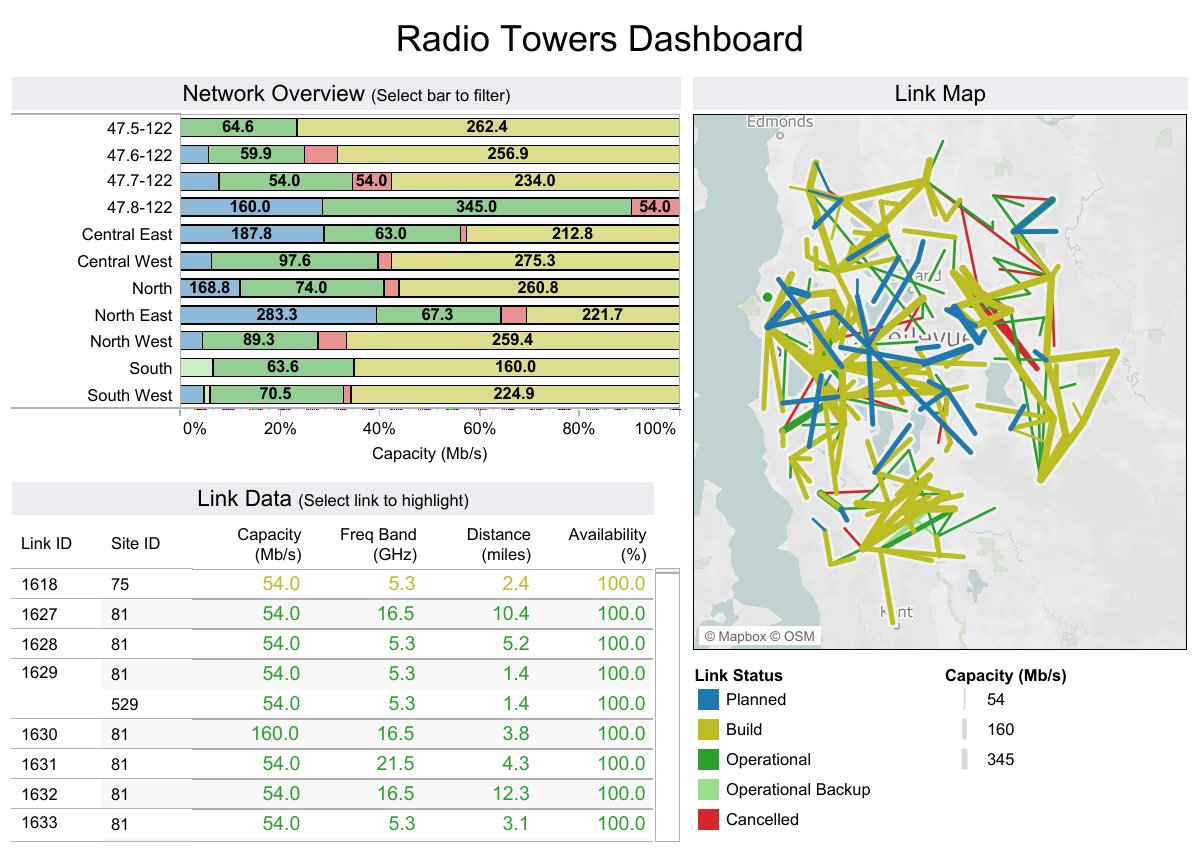 Key Features:
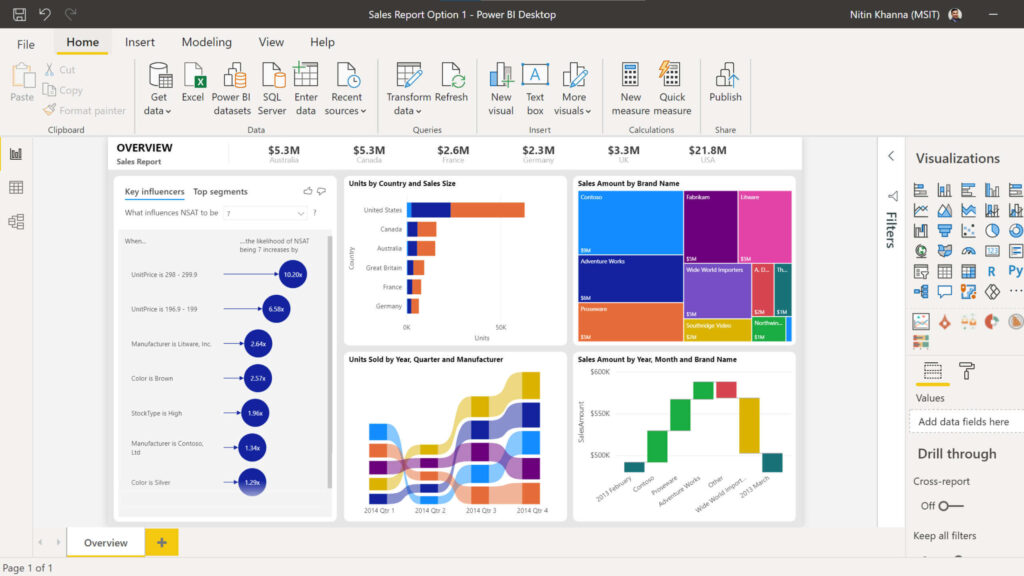 Key Features:
 Key Features:
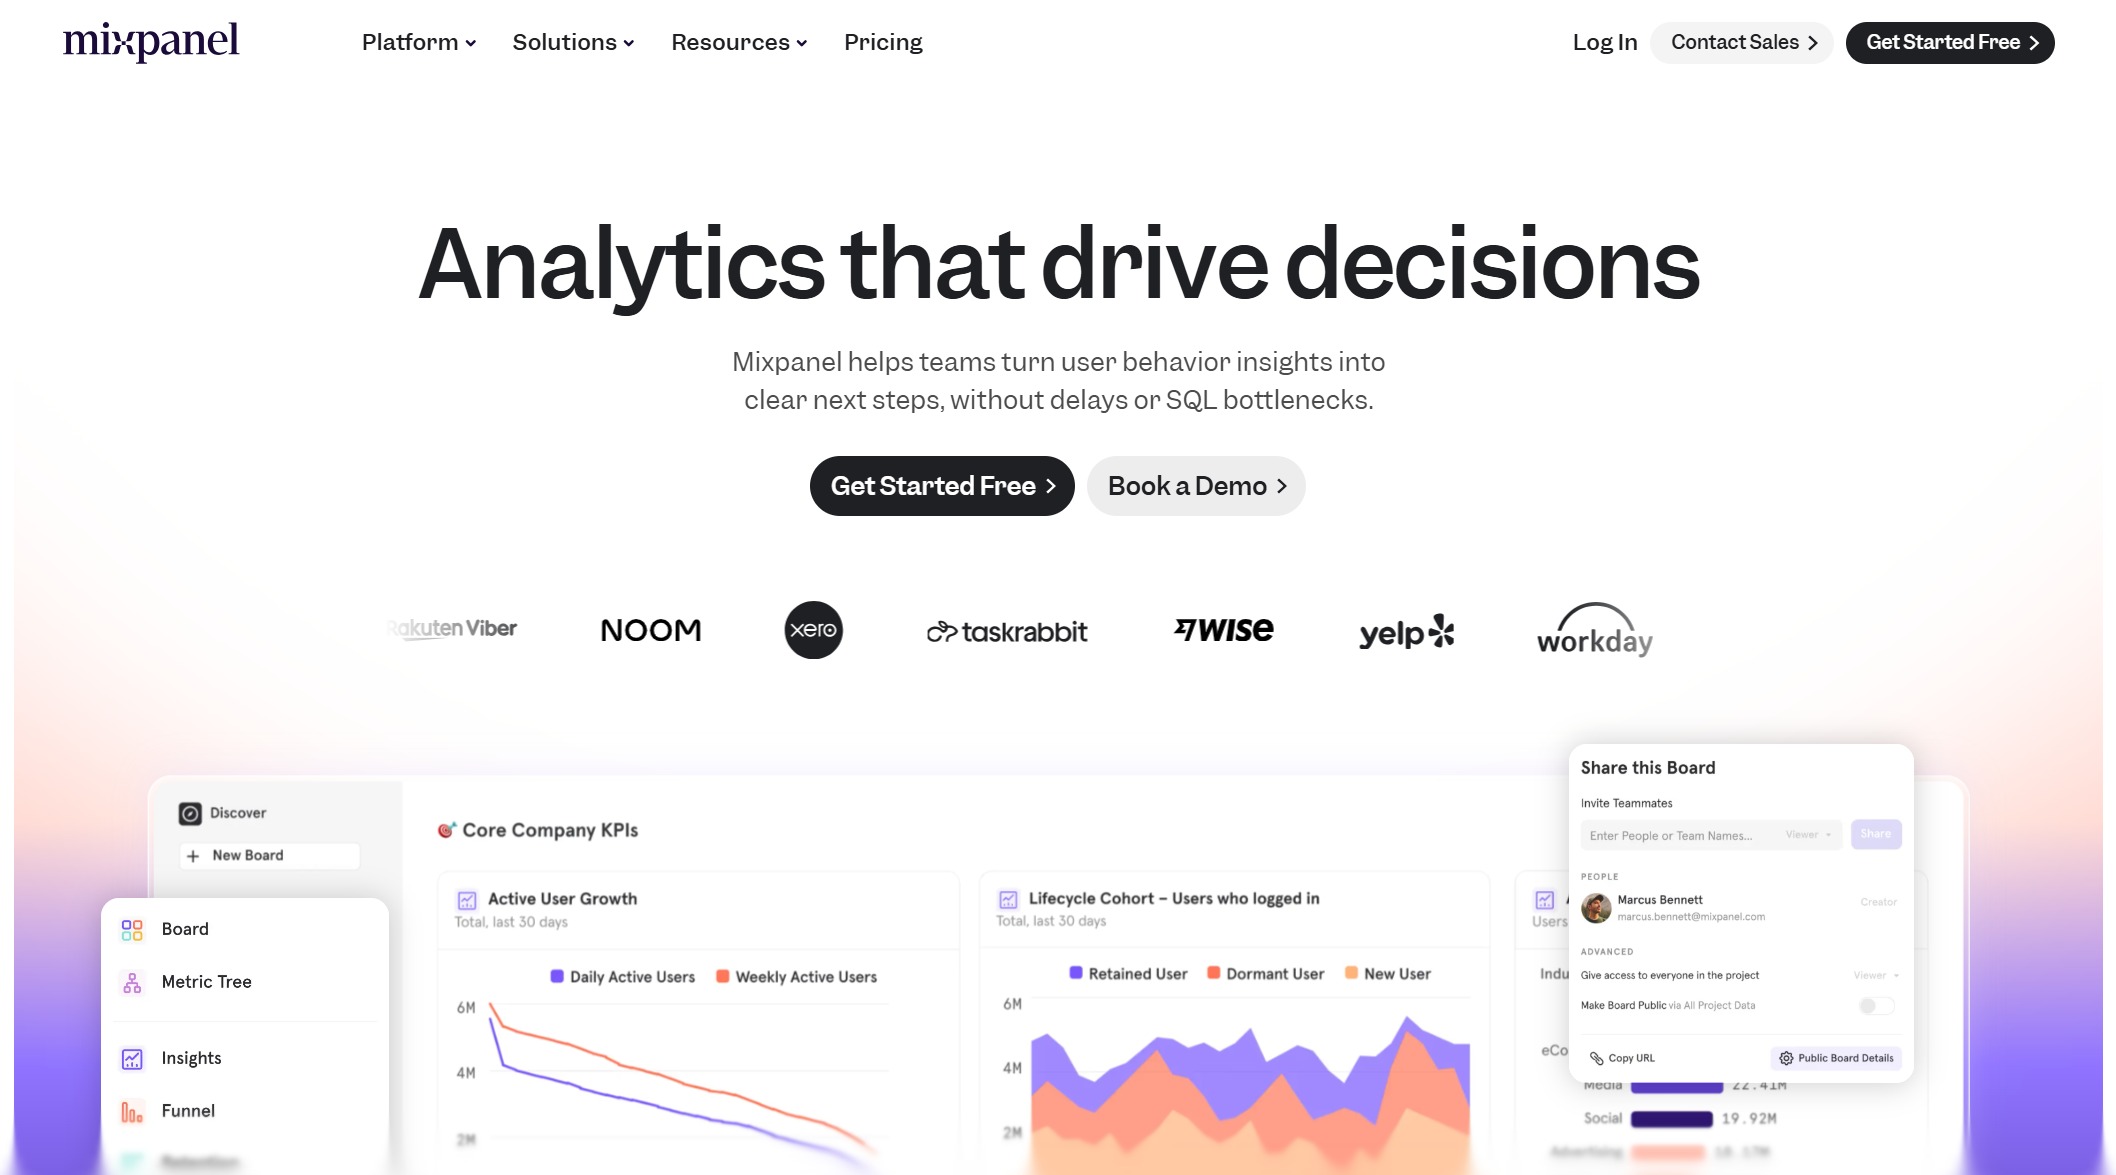 Key Features:
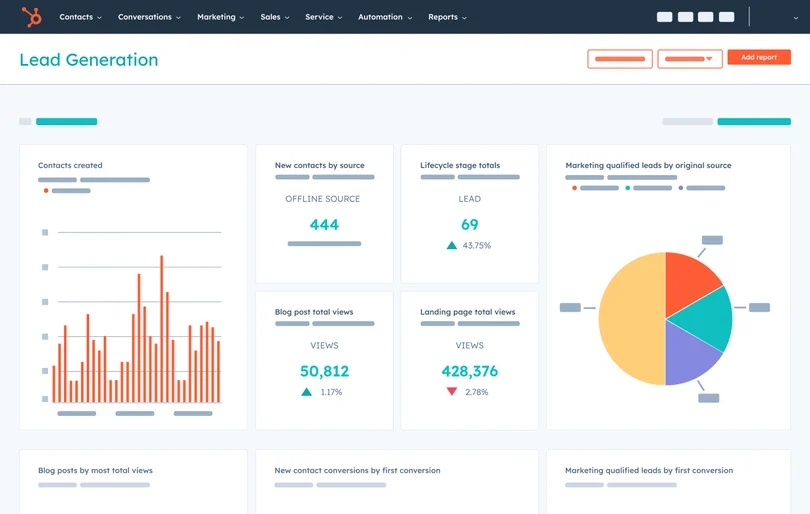 Key Features: