An ai dashboard generator is a modern tool that lets you build dashboards quickly and easily. You do not need to write code or have technical skills. These tools use ai to automate data visualization and analysis. You can connect your data, state your goals, and receive interactive dashboards almost instantly. This approach transforms data visualization into a more conversational and outcome-focused process.
You can create an ai dashboard instantly without writing code. Modern tools like FineChatBI let you connect your data, analyze it, and build dashboards in minutes. The process is simple and accessible. You do not need a technical background. AI-powered solutions guide you every step of the way. You gain insights quickly and easily. Start exploring your data today and see how effortless building dashboards can be.
How AI Dashboard Tools Work
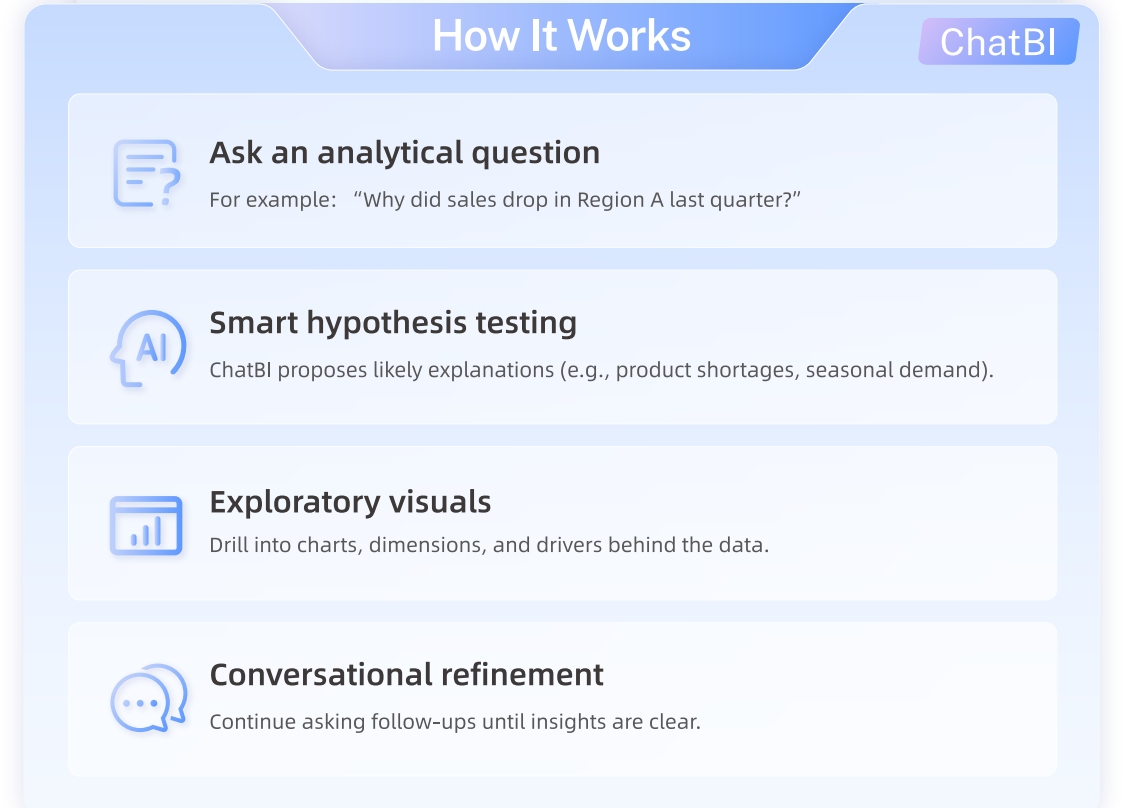
You interact with an ai dashboard generator using simple steps. First, you connect your data sources. Next, you describe what you want to see or analyze. The tool uses natural language processing, so you can ask questions in plain language. The system translates your requests into database queries. It then creates visualizations and reports that are easy to understand. Some tools even offer predictive analysis, helping you forecast trends by looking at past data.
Tip: You can use ai dashboard tools to turn complex datasets into clear, readable reports. This makes insights accessible to everyone, not just data experts.
Benefits of AI Dashboard Generators
When you use an ai dashboard generator, you gain several advantages:
Automated data collection gathers and interprets information from many sources, reducing manual work.
You spend less time on repetitive tasks and more time on strategic analysis.
AI identifies key trends and insights quickly, so you can make decisions faster.
Security features protect your data and reduce errors.
Enhanced data visualization helps you tell better data stories.
Customizable dashboards focus on the metrics that matter most to you.
As your business grows, these tools scale easily to handle more data and users.
Organizations report that ai dashboards improve decision speed and accuracy. Teams find information faster, resolve issues quickly, and feel more confident in their answers.
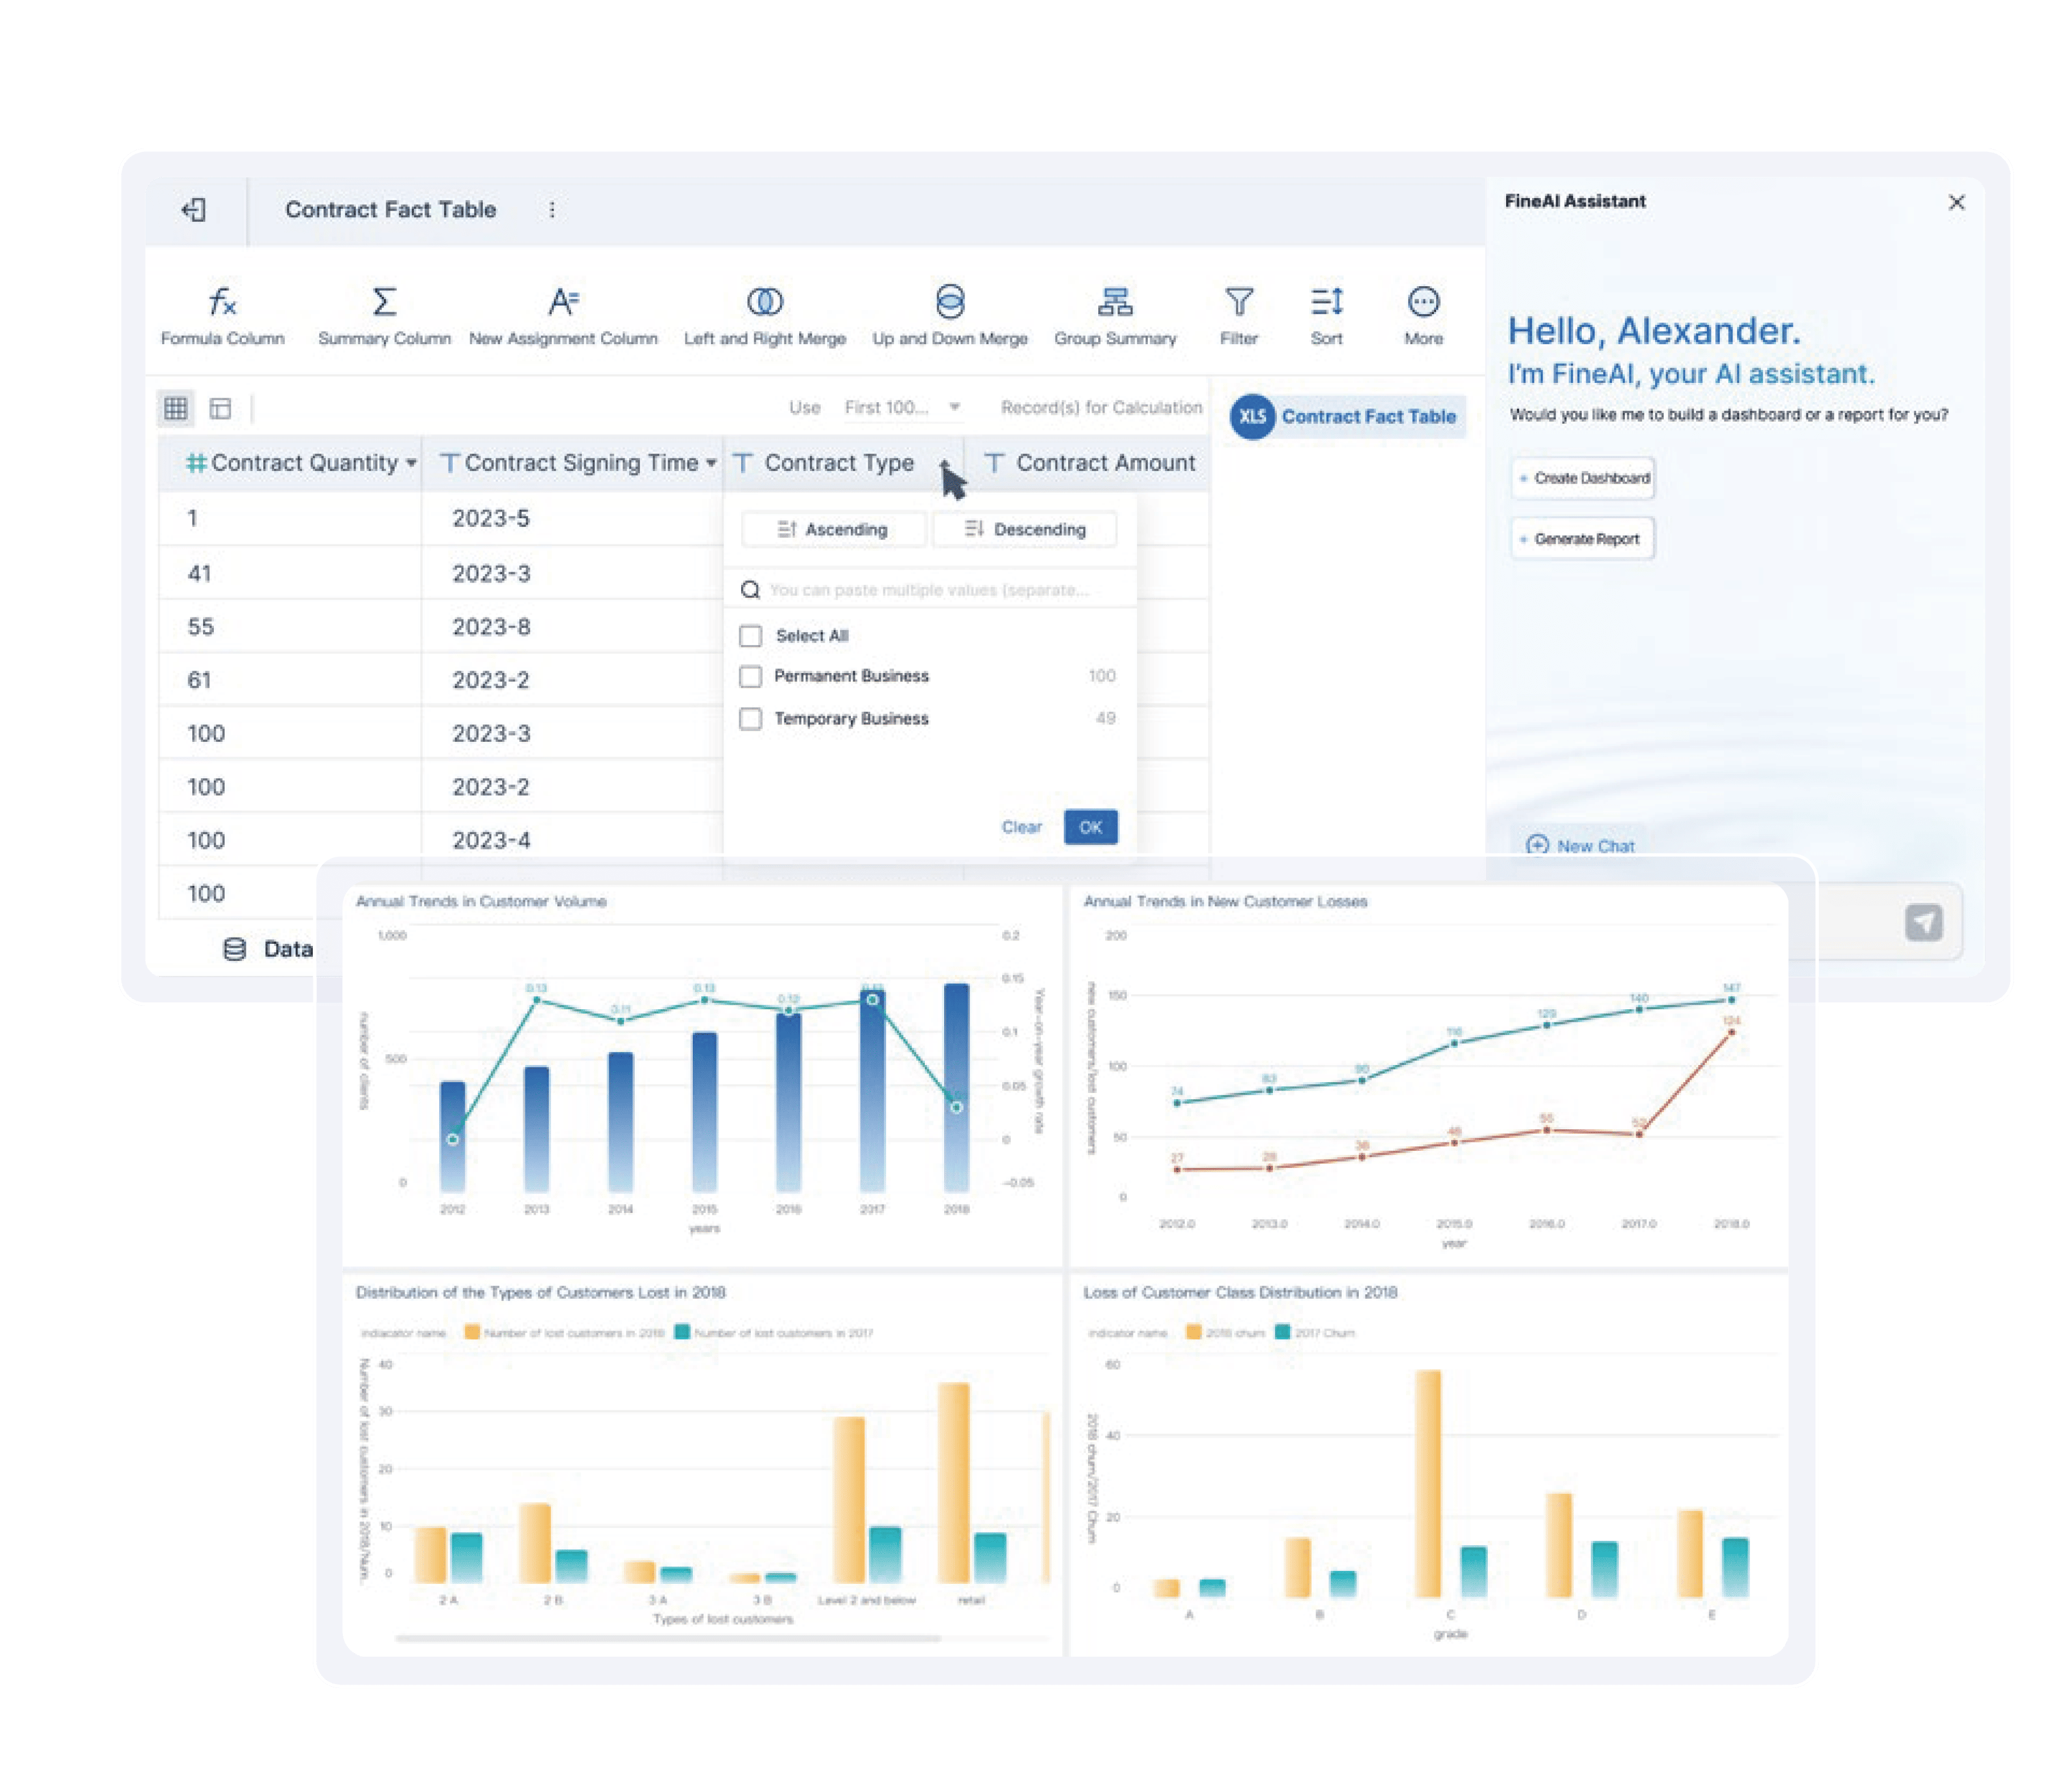
How to Build Dashboards with FineChatBI
FineChatBI gives you a simple way to build dashboards from start to finish. You do not need to write code or have technical skills. The platform guides you through every step, from connecting your data to sharing your finished dashboard. You can use FineChatBI as a free dashboard builder to unlock the power of your data and make better decisions with ai.
Connect Data Sources Easily
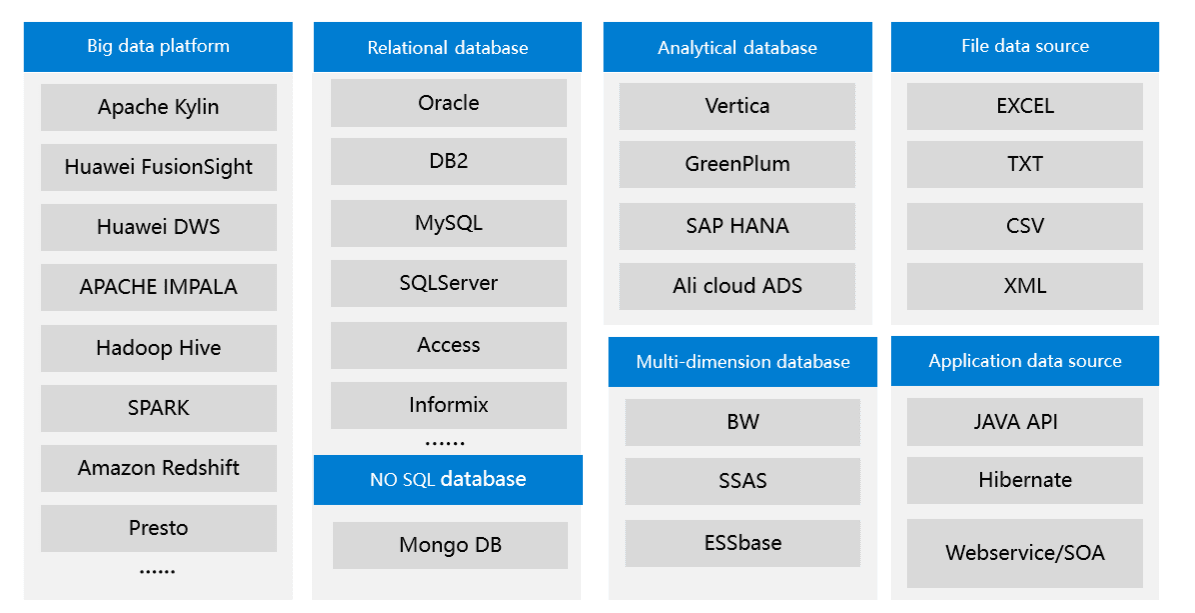
You can connect FineChatBI to many types of data sources without coding. The platform supports a wide range of formats, so you can bring all your information together for unified analysis. FineChatBI’s system architecture lets you integrate data from different places, making it easy to manage and analyze everything in one spot.
Data Source Type
Description
SQL Dataset
Use tables with user information in a non-hierarchical structure
File Dataset
Work with TXT or XML files in a non-hierarchical structure
Tree Dataset
Use hierarchical tables for more complex data relationships
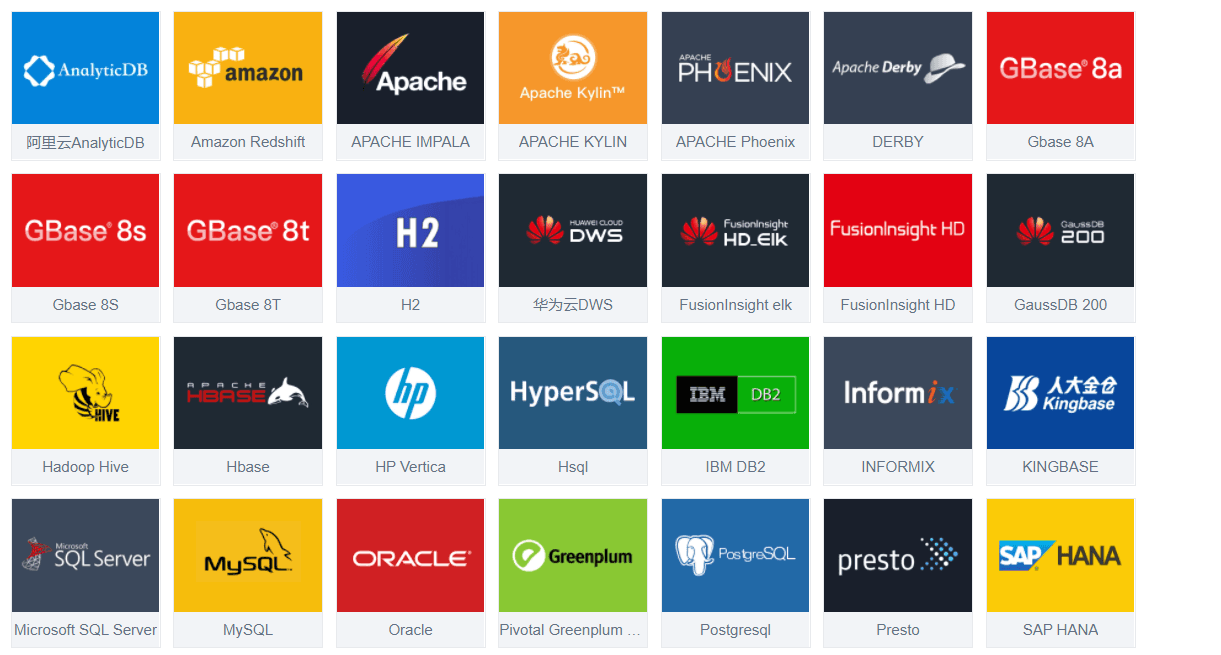
FineChatBI also connects to over 30 database types, Excel files, and multidimensional databases. You can upload files, connect to APIs, or use business packages to organize your data. This flexibility means you can always access the information you need for your dashboards.
Tip: FineChatBI’s advanced connection settings help you keep your data secure and up to date.
Prepare and Process Data Without Coding
After connecting your sources, you need to prepare your data for analysis. FineChatBI gives you tools to clean, organize, and process data without any programming. You can use the free dashboard builder features to get your data ready for visualization.
Method
Description
Data source support
Connect to databases, Excel files, and multidimensional sources through FineReport
Business package management
Group and classify data for easier understanding
Add data table
Add new tables visually, through SQL, or by uploading Excel datasets
Basic data table processing
Select fields, switch field types, and convert rows and columns as needed
You can select only the fields you need, join tables, and apply filters. FineChatBI lets you preview changes before you save them. This helps you avoid mistakes and ensures your data is clean and consistent. You do not need to write code or rely on IT teams. The tools are designed for business users and non-technical teams.
Create Dashboards with Drag-and-Drop
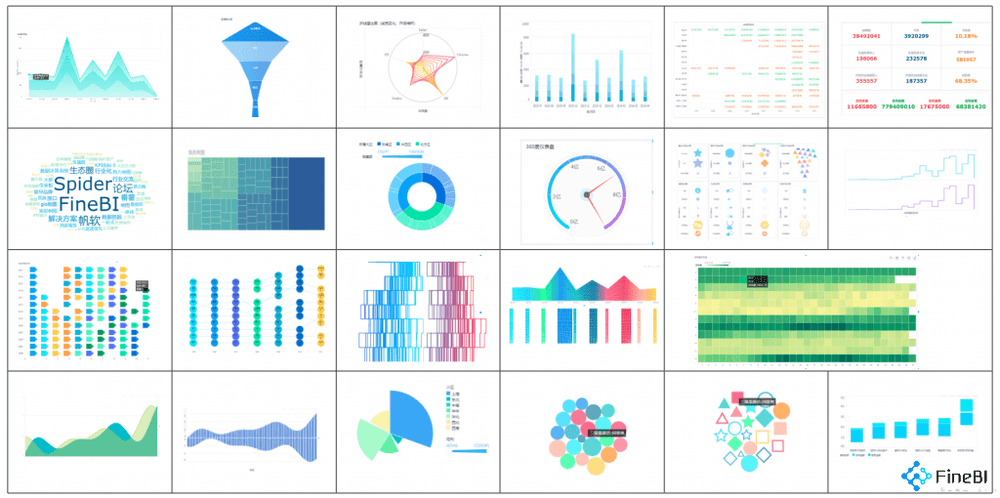
FineChatBI’s drag-and-drop interface makes it easy to create dashboards. You can add charts, tables, and other components by simply dragging them onto your dashboard. The platform supports over 60 chart types and 70 styles, so you can choose the best way to display your data.
Drag fields into the dashboard to create visualizations like bar charts, pie charts, or maps.
Customize the layout by moving and resizing components.
Apply filters and slicers to explore different views of your data in real time.
Use conditional formatting and drill-down features to make your dashboards interactive.
FineChatBI stands out from other tools because you do not need to write code or learn complex software. The free dashboard builder lets you focus on your analysis, not on technical details. You can build dashboards that help you find trends, track KPIs, and make data-driven decisions.
Share and Collaborate in Real Time
Once you finish your dashboard, you can share it with your team instantly. FineChatBI supports real-time collaboration, so multiple users can work on the same dashboard at the same time. This feature helps teams stay aligned and make faster decisions.
Feature
Description
Multi-User Editing
Several users can edit different resources in the same analysis subject
Real-Time Collaboration
Teams can edit and update dashboards together, seeing changes instantly
Resource Visibility
You can see who is editing which part of the dashboard for better teamwork
FineChatBI displays who is working on each resource, making coordination easy. You can publish dashboards securely and control who can view or edit them. This level of collaboration is not always available in other tools, especially those that require coding or manual updates.
You can use FineChatBI as a free dashboard builder to streamline every step. The platform’s ai features help you find insights faster and make better decisions. You do not need to rely on IT or write code. FineChatBI empowers you to build dashboards, create dashboards, and share your findings with ease.
Key Features of FineChatBI AI Dashboards
Self-Service Analytics and Visualization
You can create data visualizations with FineChatBI even if you do not have technical skills. The drag-and-drop interface lets you build dashboards quickly. You can choose from over 50 chart types to make your data visualizations clear and engaging. FineChatBI supports multiple data sources, so you can combine information from databases, files, and APIs. You can use filters and drill-down features to explore your data visualizations in detail. The platform emphasizes accessibility, so you can make dashboards with minimal training. You do not need to rely on IT teams. This approach speeds up your time-to-insight and helps you move away from spreadsheets.
Feature
Description
User-Friendly Interface
FineChatBI offers a drag-and-drop interface that simplifies data analysis for non-technical users.
Data Integration
Supports multiple data sources, allowing users to aggregate data from various platforms.
Visualization Options
Provides over 50 chart types and supports functions like filtering and data drilling for insights.
Collaboration
Enables joint participation in data analysis across departments, enhancing decision-making efficiency.
Real-Time Analysis
Equipped with a powerful computing engine for efficient real-time query and analysis.
Tip: You can create data visualizations that help your team understand trends and make better decisions.
Real-Time Insights and Alerts
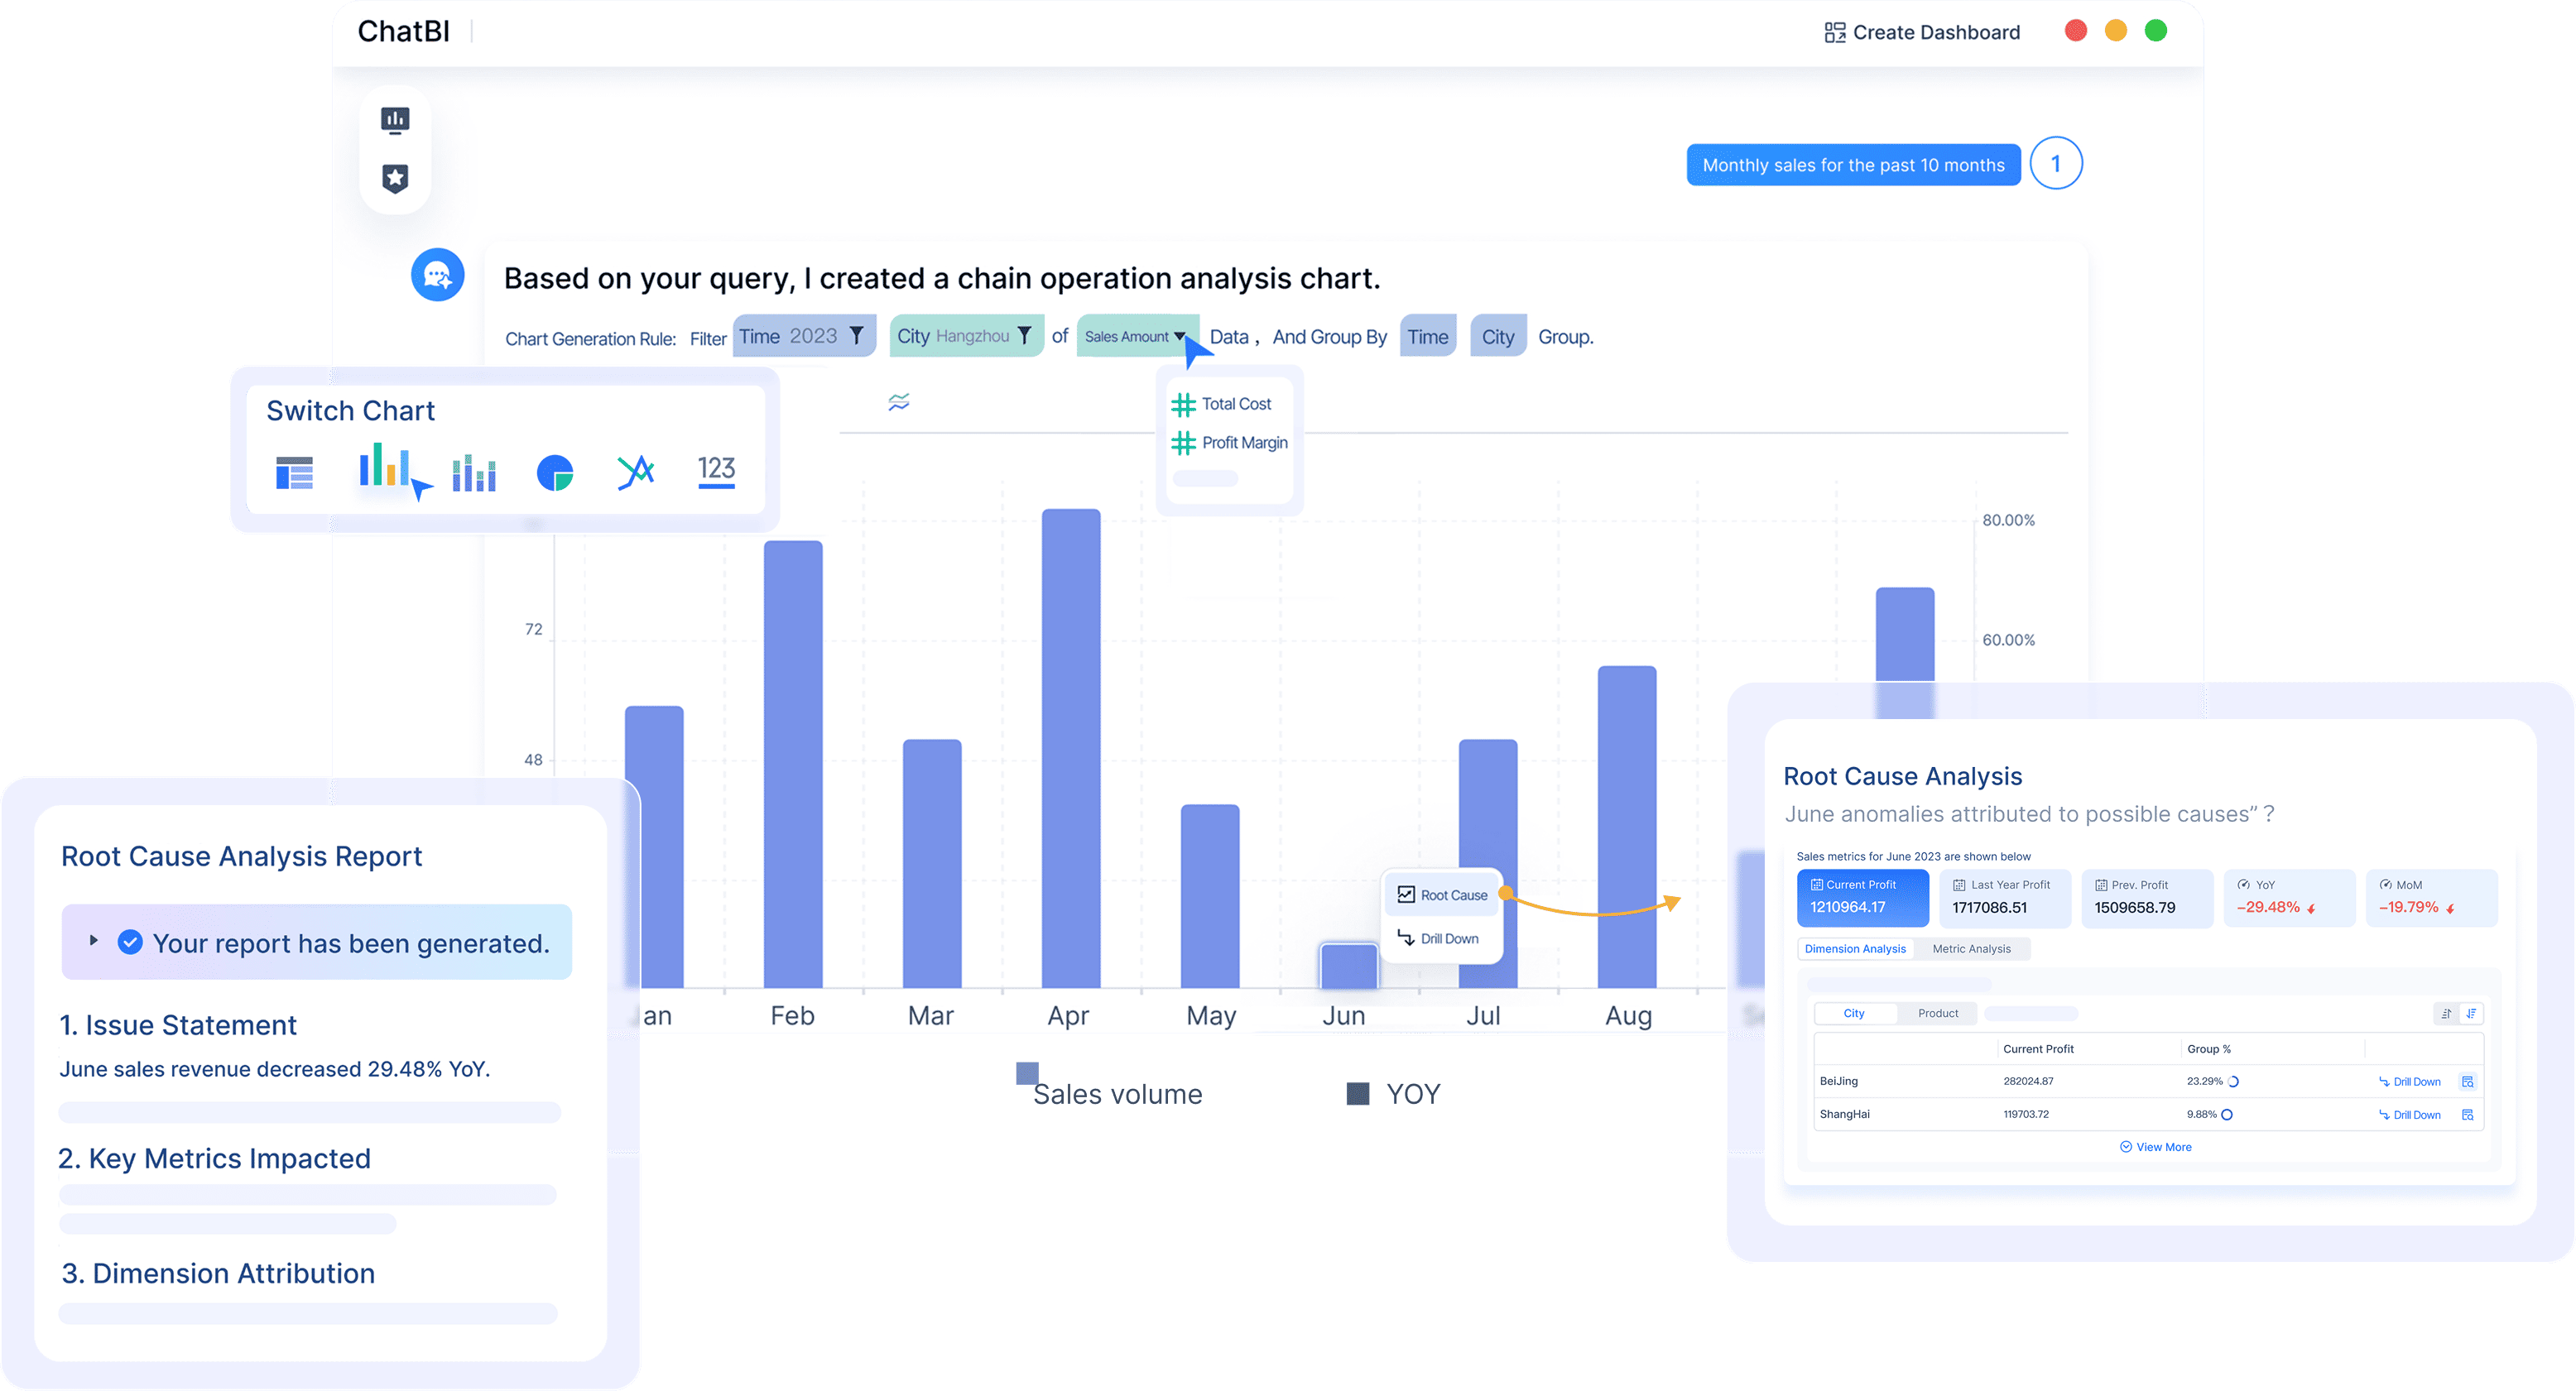
FineChatBI gives you real-time insights through instant data visualizations. You can see changes as soon as your data updates. The platform uses a high-performance engine to process large datasets quickly. You can set up alerts for important metrics. When something changes, you get notified right away. This helps you respond to business needs without delay. You can use real-time data visualizations to track KPIs, spot problems, and act fast.
You get instant feedback from your data visualizations.
You can monitor business performance with live dashboards.
You can set alerts for critical values and receive notifications.
Secure Data Access and Governance
You can trust FineChatBI to keep your data safe. The platform uses row and column level controls to manage who can see each part of your data visualizations. You see only the information that matches your role. This protects sensitive data and prevents leaks. FineChatBI also keeps your analysis assets secure when users change roles. You can share dashboards with confidence, knowing your data visualizations stay protected.
Feature
Description
Row and Column Level Control
Allows for detailed permission control to prevent unauthorized data access and leakage.
Personalized Data Display
Users see data relevant to their roles, enhancing security and relevance of information.
Resource Handover
Ensures continuity in data governance by retaining analysis assets when users change roles.
Note: Secure data visualizations help you meet compliance standards and build trust across your organization.
Use Cases and Success Stories
Business Applications for AI Dashboards
You can use AI-powered tools in many areas of business. These tools help you turn raw data into clear insights. Different teams rely on dashboards to track performance, spot trends, and make better decisions. The table below shows common types of dashboards, their features, and who uses them:
Dashboard Type
Complexity Level
Key Features
Benefits
Common Users
HR Analytics Dashboard
Moderate
Workforce performance and recruitment trend analysis
Supports retention planning and compliance monitoring
HR departments tracking talent
Supply Chain Dashboard
High
End-to-end supply chain visibility with risk indicators
Enhances risk management and cost optimization
Supply chain and logistics management
Project Management Dashboard
Moderate
Clear project progress and milestone tracking
Optimizes timelines and resource utilization
Project managers overseeing projects
E-commerce Analytics Dashboard
Moderate
Real-time sales tracking and customer behavior insights
Improves conversion optimization and inventory management
Online retailers and e-commerce teams
IT Operations Dashboard
High
Proactive system performance and security monitoring
Enables real-time monitoring and effective issue prevention
IT and network operations teams
You can also use these tools for campaign ROI analysis, customer engagement tracking, sales forecasting, and real-time inventory management with automated alerts. AI dashboards help you identify patterns and predict customer behavior. For example, a retailer used these tools to match inventory with weather trends, which increased revenue and improved customer satisfaction.
FineChatBI Customer Success: BOE and TXC Corporation
FineChatBI empowers teams across many industries. At BOE Technology Group, you can see how dashboards unify data from different sources. BOE used FineChatBI to build a data warehouse and standardize metrics. This change reduced inventory costs by 5% and increased operational efficiency by 50%. You can monitor KPIs and compare performance across factories, which supports better decision-making.
TXC Corporation also transformed its business with FineChatBI. Employees gained access to real-time data and easy-to-use dashboards. The company improved reporting speed and data accuracy. Staff members now use AI-driven insights to guide daily work. You can see how these tools help teams become more data-driven and responsive.
Note: FineChatBI gives you the power to analyze, share, and act on data without needing technical skills. These success stories show how the right tools can drive real results in any industry.
Considerations When Using AI Dashboard Tools
Data Quality and Preparation
You need to start with high-quality data when using AI dashboard tools. Clean and reliable data helps you get accurate insights. If your data has errors or missing values, your dashboards may show misleading results. You should check your data for consistency and make sure it matches your business goals.
Key Point
Explanation
Data Quality Impact
Ensures data inputs are consistent, reliable, and actionable.
Monitoring Trust
Allows you to measure trust in your data across different systems.
AI Readiness
Gives you confidence that your AI tools use reliable inputs.
Governance ROI
Helps you show the value of good data management.
Risk Management
Identifies which areas of your business may carry more risk.
Tip: Always review your data before building dashboards. Good preparation leads to better results.
You should also think about how your data connects to your dashboard tool. Choose a platform that supports many data sources and live queries. This helps you avoid using old or incomplete data.
Limitations and Best Practices
AI dashboard tools offer many benefits, but you should know their limits. Sometimes, employees may resist new technology. You may also face hidden costs when you try to scale your solution. Rapid changes in AI can make it hard for your team to keep up.
Here are some best practices to help you succeed:
Start with well-structured data. Include totals, currency codes, and comparison metrics.
Give clear instructions to the AI about what you want to see.
Add business context that may not appear in your data, such as market changes.
Organize your dashboard with logical sections.
Refine your instructions if the first results are not what you need.
Mix templates to create custom views.
Choose the format that works best for your team, like bullet points or charts.
Factor
Description
User-friendliness
Easy for everyone to use, even non-technical staff.
Integration
Works well with your current systems and data sources.
Training and Support
Offers help and resources for learning and troubleshooting.
Security Features
Protects your sensitive data with built-in security.
Note: Following these best practices helps you get the most value from your AI dashboard tool.
AI dashboard generators like FineChatBI help you build dashboards and gain insights instantly. You do not need technical skills. You can describe your needs, and the AI creates professional dashboards for you. You interact with your data using simple tools, which makes analysis easy for everyone.
Benefit
Description
Real-time analytics
Gives you the latest information to spot problems early and react quickly.
Centralized data access
Lets you find all your data in one place for faster decisions.
Interactive visualizations
Helps you see trends and insights without needing technical knowledge.
You can work with your team in real time and make decisions faster. No-code analytics and AI dashboards are changing how you use data. They make data-driven decision-making possible for everyone. In the future, these tools will help more people work with data confidently and keep your business competitive.
See how Dora turns trusted BI data into chat-based answers, scheduled briefings, and automated follow-up — built for real enterprise workflows, not just chat.
FAQ
How do you connect FineChatBI to your data sources?
You select your data source from the list. FineChatBI supports databases, Excel files, APIs, and more. You follow the prompts to complete the connection. You do not need coding skills.
Can you build dashboards without any technical background?
Yes, you can. FineChatBI uses a drag-and-drop interface. You choose charts and tables, arrange them, and apply filters. The platform guides you through each step.
What types of data can you analyze with FineChatBI?
You can analyze sales, finance, HR, supply chain, and more. FineChatBI supports structured and unstructured data. You combine data from multiple sources for deeper insights.
Is your data secure when using FineChatBI?
FineChatBI uses role-based access control. You set permissions for each user. Sensitive data stays protected. You can share dashboards safely across your organization.
How do you share dashboards with your team?
You publish your dashboard in FineChatBI. You invite team members to view or edit. Real-time collaboration lets everyone see updates instantly. You control who can access each dashboard.