Explore the hidden costs of React dashboards versus FineBI.
| Features | React Dashboard | FineBI |
|---|---|---|
| Development Costs | High initial development expenses. | Low upfront cost for ready-to-use. |
| Maintenance Costs | Ongoing, 15-25% yearly. | Included in platform pricing. |
| User Interface | Customizable but complex for non-tech users. | No-code, drag-and-drop interface. |
| Performance with Large Data | Requires optimization for large datasets. | Handles large data smoothly. |
| Permission Management | Custom, complex logic needed. | Built-in, simple permission controls. |
| Real-Time Analytics | Requires additional setup. | Real-time updates included. |
| Collaboration Features | Limited collaboration capabilities. | Supports real-time collaboration. |
| Technical Support | Dependent on in-house team. | Dedicated support available. |
When you compare building a react dashboard to adopting a BI platform, you face more than just upfront costs. Self-developed dashboards often require ongoing investment in development, maintenance, permission control, and performance improvements. For example, monthly expenses can range from $500 for basic dashboards to over $20,000 for enterprise-grade solutions. Cloud hosting adds another layer, with costs rising as your data grows. In contrast, a finished product like FineBI offers no-code tools, robust permission systems, and a mature data engine—helping you avoid many hidden costs right from the start.
| Expense Category | Cost Range (Monthly) |
|---|---|
| Basic Dashboards | $500 – $2,000 |
| Medium Complexity Dashboards | $2,000 – $7,000 |
| Enterprise Dashboards | $7,000 – $20,000+ |
| Cloud Costs (Small Dashboards) | $50 – $300 |
| Cloud Costs (Enterprise Dashboards) | $1,500 – $10,000+ |
Making the right choice now helps you save money, scale easily, and avoid common pitfalls as your business grows.


Building your own react dashboard may seem cost-effective at first. However, you face many hidden costs throughout the dashboard’s lifecycle. These costs can impact your budget, team productivity, and long-term business growth.
You must invest significant time and money to develop a react dashboard from scratch. The process includes planning, designing, coding, and testing. You also need to connect data sources and customize the user interface. The table below shows typical development costs and timelines for different dashboard tiers:
| Tier | Estimated Cost (One-time) | Monthly Infra | Timeline |
|---|---|---|---|
| Tier 1: Basic Dashboard | $5,000 – $10,000 | $50 – $150 | 4–6 weeks |
| Tier 2: Mid-Level Dashboard | $15,000 – $30,000 | $200 – $800 | 8–12 weeks |
| Tier 3: High-End Dashboard | $40,000 – $100,000+ | $1,000 – $5,000 | 3–6 months |
You need to budget for both the initial build and ongoing infrastructure costs. As your data grows, cloud expenses can increase quickly.
After launch, your react dashboard requires regular maintenance. You must fix bugs, update libraries, and add new features. Maintenance costs typically range from 15% to 25% of the initial development cost each year. Here are some key points to consider:
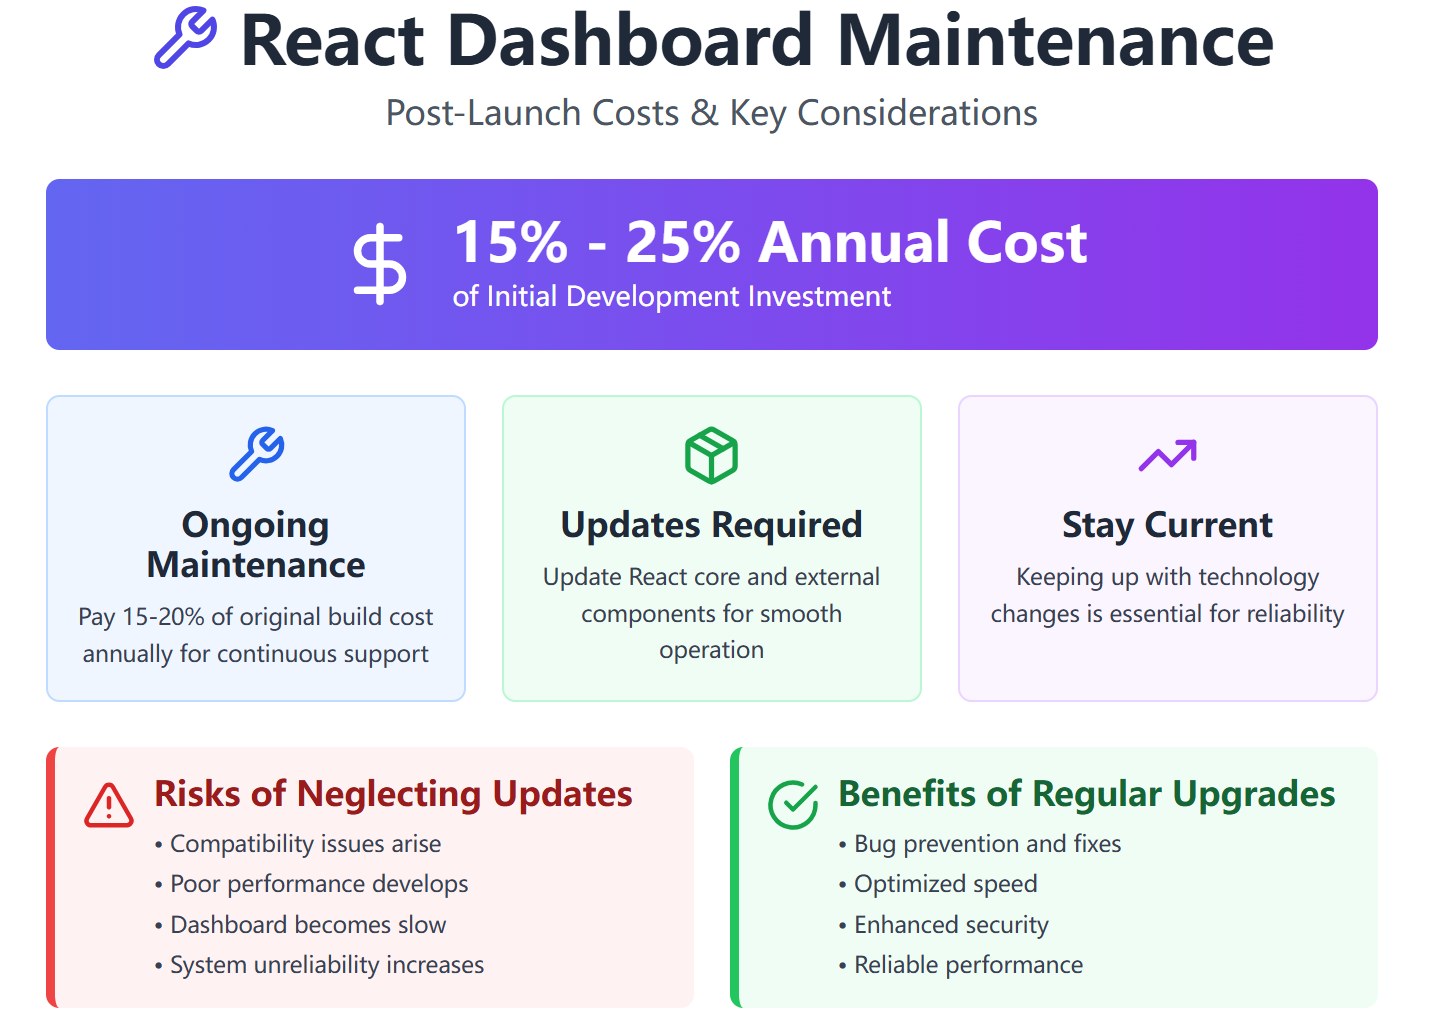
Staying current with technology changes is essential. If you skip updates, your dashboard may become slow or unreliable.
Managing user permissions in a react dashboard can be complex and expensive. You need to build custom logic for each role and data source. The table below highlights common challenges and their impact:
| Challenge Description | Impact on Implementation |
|---|---|
| Significant code duplication due to repeated permission checks across components | Increases maintenance effort and risk of errors when updating permission logic |
| Tight coupling of rendering logic with authorization rules | Makes the codebase harder to maintain and test |
| Inflexibility in permission management due to reliance on roles | Complicates changes and hinders complex permission scenarios |
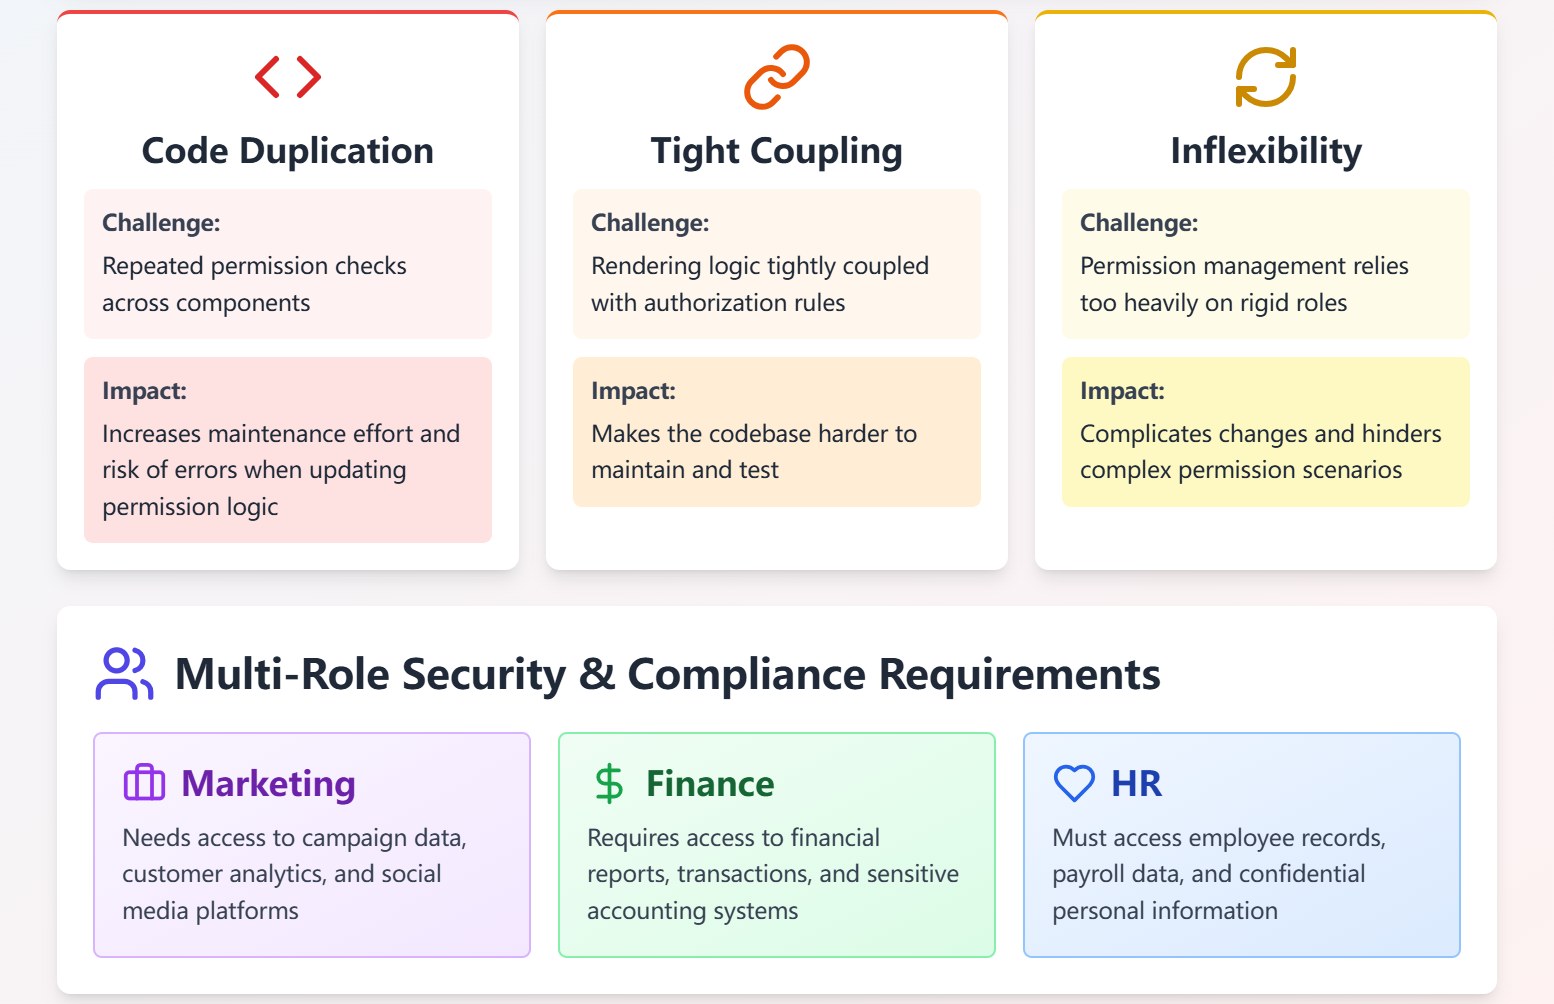
You must also ensure security and compliance for different roles, such as marketing, finance, and HR. Each role needs access to specific systems and data. If you do not centralize permission management, you risk errors and security gaps.
Handling large datasets in a react dashboard presents major challenges. When you work with more than one million records, memory usage increases and performance drops. You may see slow page loads, stuttering, or even crashes. The main issue comes from manipulating a large DOM tree, which can make it hard to maintain smooth scrolling and fast response times.
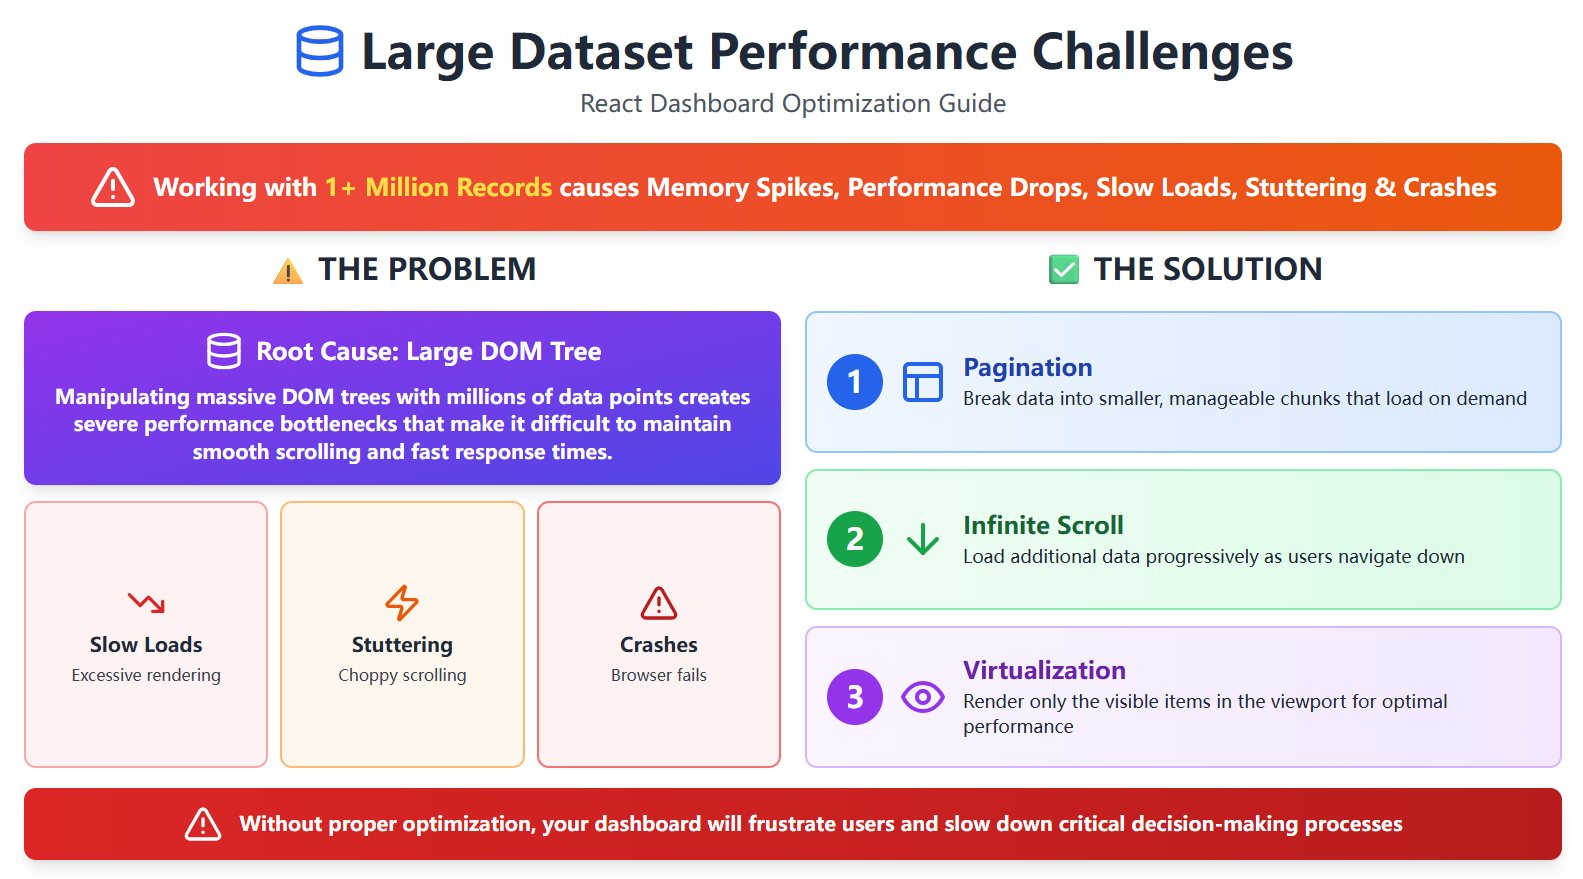
"A large DOM tree, especially with millions of data points, can significantly affect performance, making it difficult to maintain 60 frames per second (FPS) and potentially leading to page crashes."
To improve performance, you need to use strategies like:
If you do not optimize for large data, your dashboard may frustrate users and slow down decision-making.
Integrating a react dashboard with legacy systems often creates technical debt. You may face complex data management issues and performance bottlenecks. Inefficient communication between old and new systems can slow down your dashboard and increase security risks. You must plan carefully to maintain data integrity and avoid future problems.
Building your own react dashboard means you must handle development, maintenance, permission control, performance optimization, and integration challenges. These hidden costs can add up quickly and impact your business in ways you may not expect.
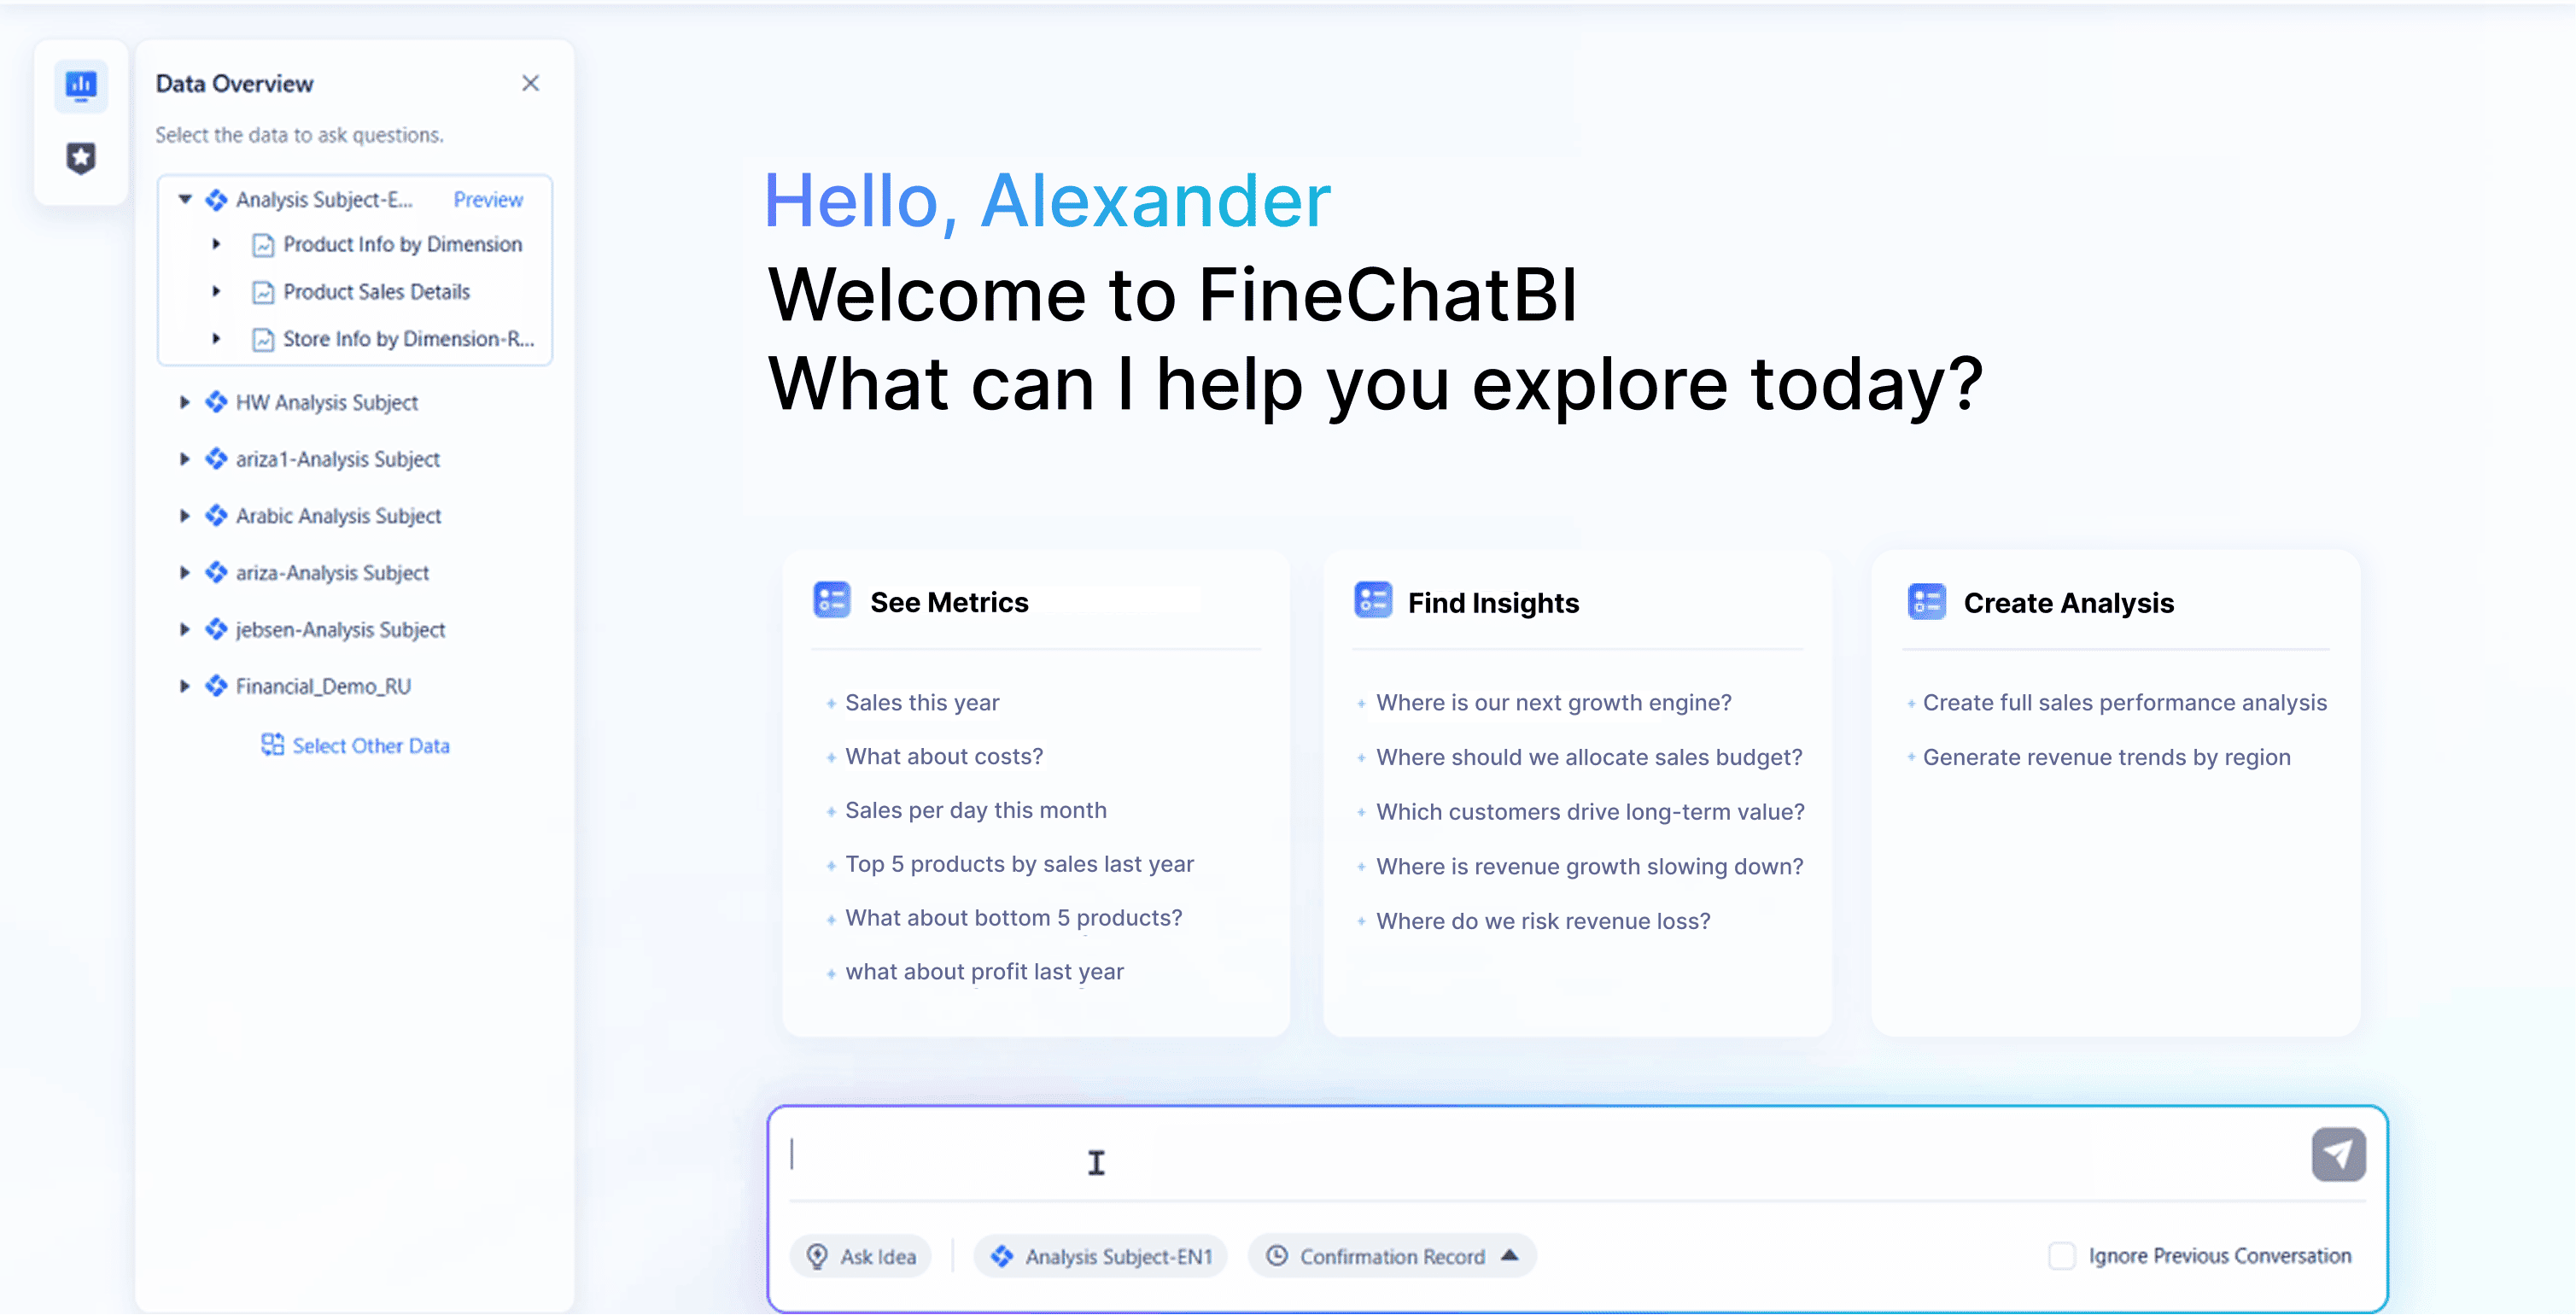
FineBI gives you a true no-code experience. You can build dashboards and reports using simple drag-and-drop tools. You do not need to write code or have deep technical skills. This approach lets anyone in your company work with data, not just IT specialists.
FineBI helps you streamline operations and empowers every department to make data-driven decisions.
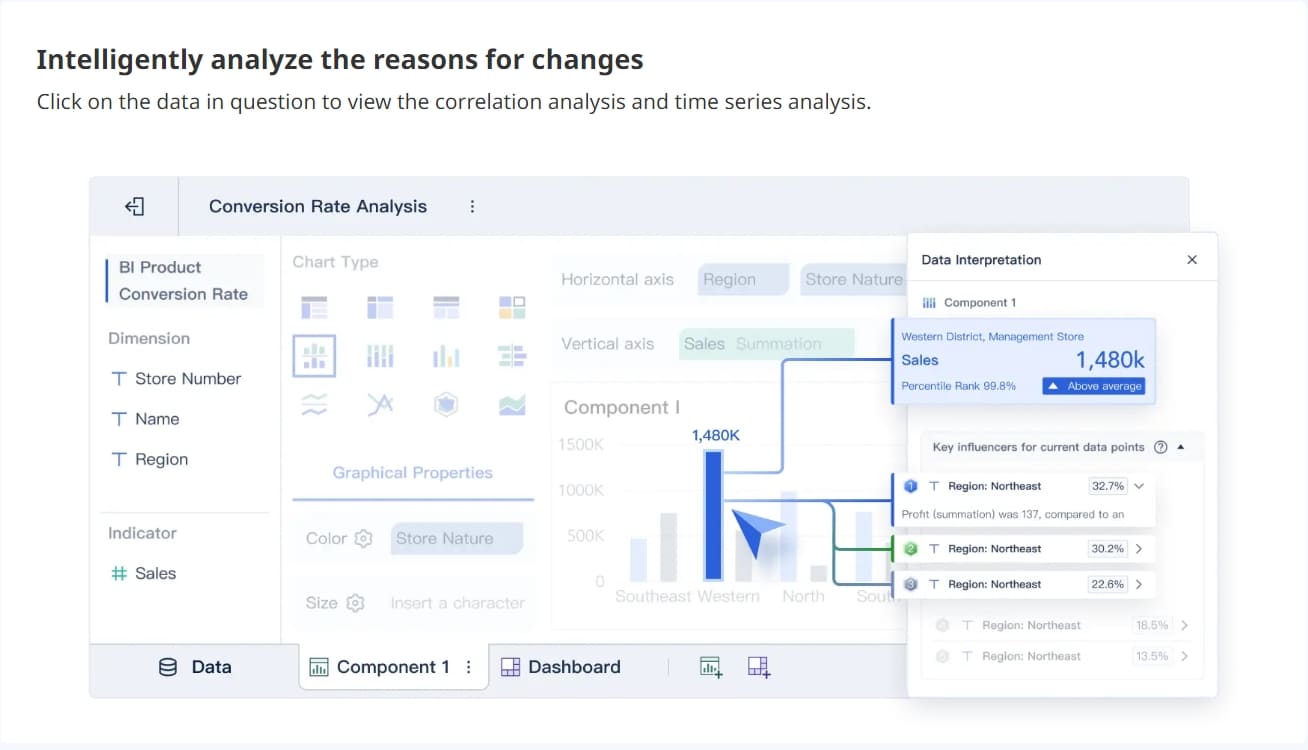
With FineBI, you can ask questions in plain language and get instant answers. The platform uses AI to turn your questions into visual insights. You do not need to know SQL or advanced analytics. FineBI also gives you smart recommendations, helping you spot trends and find opportunities you might miss on your own.
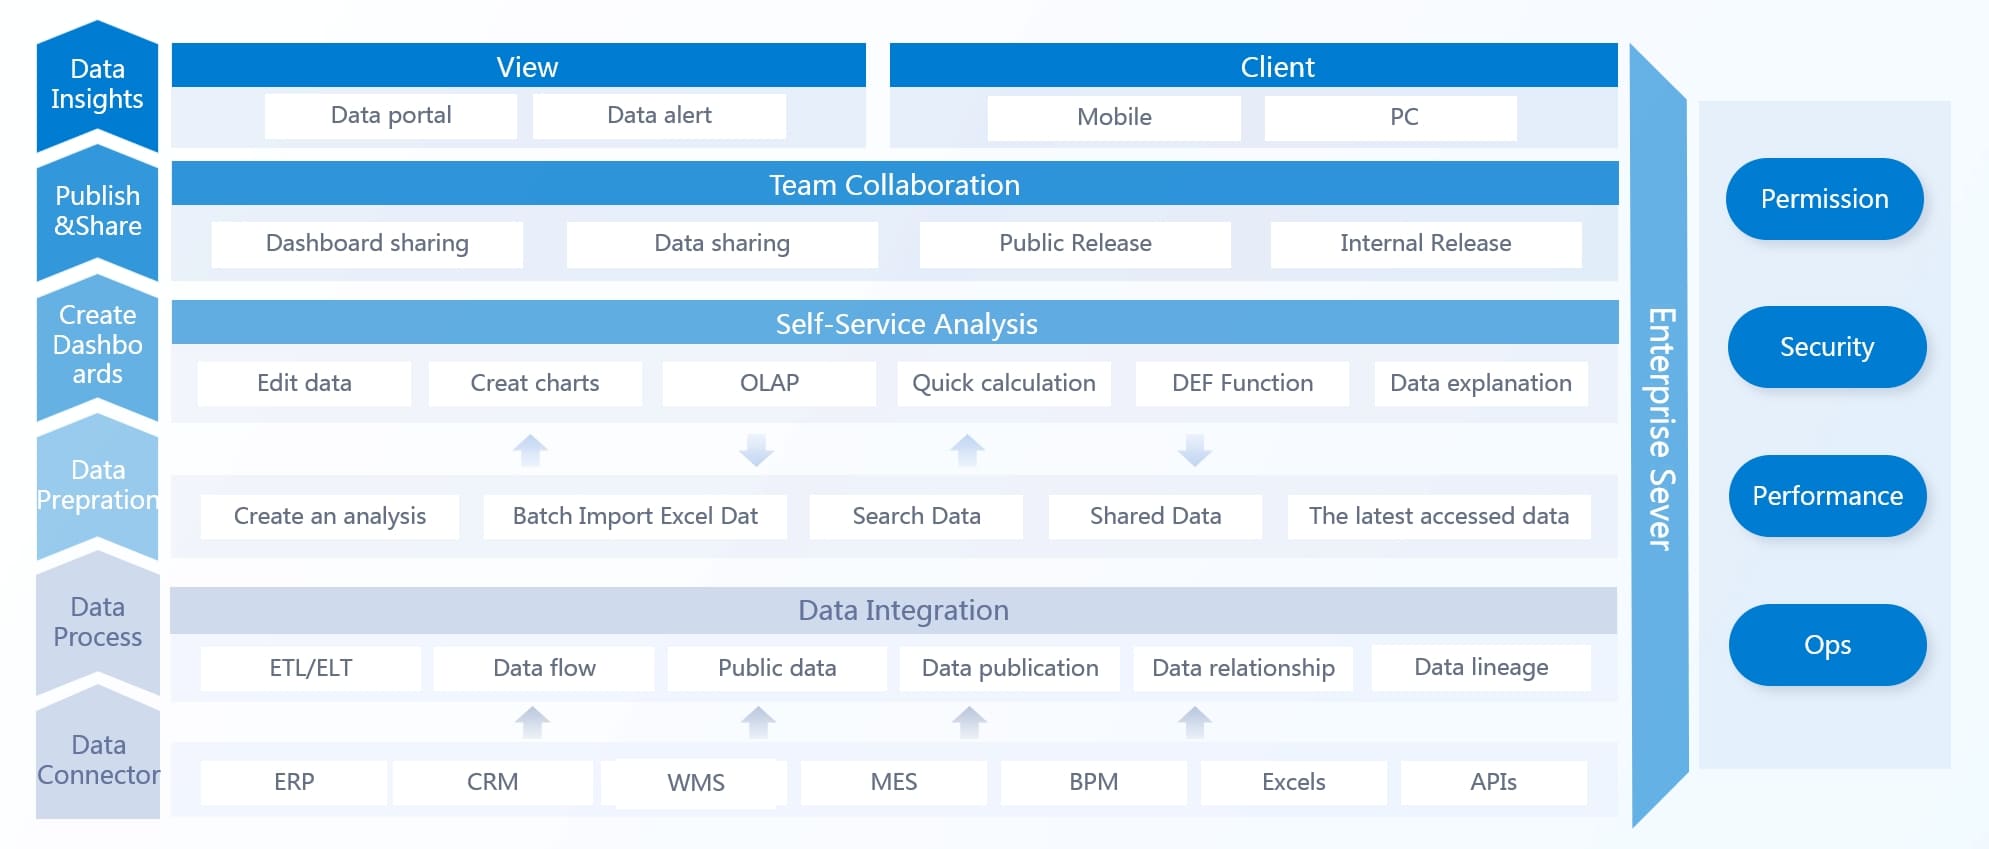
FineBI offers a complete permission system. You can control who sees what data by department, role, or even individual user. The platform lets you set row and column permissions, so sensitive information stays protected. You can build business package hierarchies to organize data access and keep things simple.

You keep your data secure and ensure only the right people have access.
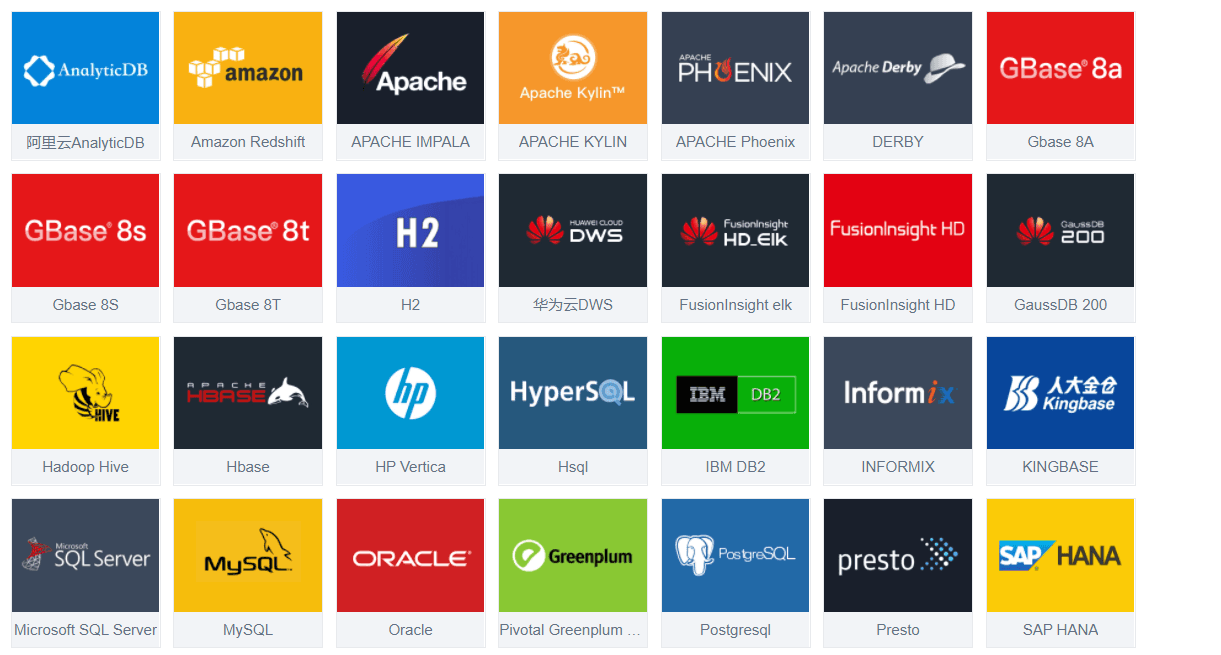
FineBI connects to your data sources and updates dashboards in real time. You always see the latest numbers and trends. This helps you react quickly to changes and make better decisions. The mature data engine behind FineBI ensures smooth performance, even with large datasets.
FineBI makes teamwork easy. Multiple users can work on dashboards at the same time. You can share insights across teams and embed analytics into other tools. FineBI also supports enterprise data governance, so you stay compliant and maintain data quality.
| Feature | FineBI | Typical React Dashboards |
|---|---|---|
| Real-time collaboration | Yes | No |
| Embedded analytics | Yes | No |
| Enterprise data governance | Yes | Limited or none |

FineBI gives you a cost-effective, scalable solution that grows with your business and keeps your data safe.

When you build a react dashboard, you face both upfront and ongoing expenses. The initial cost covers planning, development, and integration. After launch, you must pay for maintenance, updates, and infrastructure. These costs can rise quickly as your business grows or your data needs increase.
FineBI offers a different approach. You pay for a finished product that includes a mature data engine, a no-code interface, and a complete permission system. You do not need to hire a large development team or worry about hidden technical debt. FineBI’s pricing structure is predictable, which helps you plan your budget with confidence.
| Cost Factor | React Dashboard | FineBI |
|---|---|---|
| Initial Development | High (custom build) | Low (ready to use) |
| Maintenance | Ongoing, 15-25% yearly | Included in platform |
| Infrastructure | Scales with usage | Optimized, included |
| Permission Control | Custom, complex | Built-in, simple |
| Upgrade Costs | Frequent, manual | Automatic, managed |
If you want to control costs and avoid surprises, FineBI gives you a clear advantage.
A react dashboard gives you full control over design and features. You can customize every detail, but this flexibility comes with a price. You need skilled developers to build and maintain the dashboard. Non-technical users may struggle to create or update reports without help from IT.
FineBI focuses on usability for everyone. You get a no-code, drag-and-drop interface that lets any team member build dashboards and explore data. The platform uses AI to turn plain language questions into insights. This makes data analysis fast and easy, even for people without technical backgrounds.
FineBI empowers your whole organization to make data-driven decisions, not just your IT department.
As your business grows, your data needs will change. A react dashboard can scale, but you must plan for performance optimization, especially with large datasets. You may need to add features like pagination, virtualization, or infinite scroll to keep things running smoothly. This adds to your development and maintenance workload.
FineBI is built to handle growth. The platform efficiently manages large data volumes and supports real-time analytics. You do not need to worry about performance tuning or technical bottlenecks. FineBI’s support team helps you resolve issues quickly, so you can focus on your business.
Over 40% of developers choose React for enterprise applications because of its component-based architecture and flexibility. However, FineBI’s ready-made features and enterprise support make it a strong choice for organizations that want to grow without technical headaches.
Unless your needs are extremely niche, choosing a mature BI platform like FineBI is usually the smarter business decision. You save time, reduce risk, and empower your team to focus on what matters most.
You might choose to build a react dashboard if you have highly specific requirements that no platform can meet. This approach works best when you need full control over every detail, from design to data integration. You should also have a skilled development team ready to handle ongoing updates, permission logic, and performance tuning for large datasets. If your organization values customization above all else and can manage higher costs and technical debt, a custom solution may fit your needs.
Tip: Always consider the long-term costs of development, maintenance, and scaling before starting a custom project.
FineBI is the right choice for most businesses that want to move fast and keep costs predictable. You can use no-code, drag-and-drop tools to build dashboards without hiring a large IT team. FineBI’s mature data engine and complete permission system help you manage data securely and efficiently. The platform supports real-time collaboration and governance, making it easy for teams to share insights and stay aligned.

Here is a quick comparison of key decision factors:
| Factor | Description |
|---|---|
| Cost | FineBI offers clear pricing and avoids hidden fees. |
| Usability | The interface is simple and intuitive for all users. |
| Collaboration | Teams can share dashboards and work together in real time. |
| Scalability | The platform grows with your business and handles more users and data smoothly. |
| Support | You get reliable help to resolve issues quickly. |
Ask yourself:
If you answer yes to these questions, FineBI is likely your best option.
Your choice affects your business for years. FineBI supports real-time analytics, so you can react quickly to new challenges. The platform helps you spot problems early and stay competitive. Fast dashboard loading and support for many databases keep your team productive.
| Benefit | Description |
|---|---|
| Real-time analytics | See up-to-date data and respond fast. |
| Competitive agility | Stay ahead by identifying issues early. |
| Fast loading | Access dashboards quickly, even with large data sets. |
Unless your needs are extremely niche, choosing a mature BI platform like FineBI leads to greater business efficiency and long-term success.
You face many hidden costs when you build a React dashboard. These include ongoing maintenance, permission control, and performance issues. FineBI gives you strong advantages with easy setup, real-time analytics, and reliable support. You save time and money while your team works faster.
Unless your needs are extremely niche, you should choose a mature BI platform like FineBI for better business efficiency and practical results. Use the decision guide to find the best fit and avoid common mistakes.

The Author
Lewis
Senior Data Analyst at FanRuan
Related Articles

How to Design an Effective Delivery Dashboard Interface
Design a delivery dashboard interface that highlights key metrics, streamlines decision-making, and ensures clarity for all logistics stakeholders.
Lewis Chou
Apr 02, 2026

How to Build a Courier Dashboard for Logistics Management
Build a dashboard courier to monitor shipments, inventory, and logistics KPIs in real time, improving decision-making and operational efficiency.
Lewis Chou
Apr 02, 2026

Ceph Dashboard Explained in Simple Terms for Everyone
Ceph Dashboard offers a simple web interface for managing Ceph clusters, featuring real-time monitoring, alerts, user roles, and easy customization.
Lewis Chou
Apr 02, 2026


