Construction project reporting is the operating system behind on-time, on-budget, and low-risk delivery. For owners, project managers, superintendents, and contractors, the issue is not whether data exists—it is whether the right people can see the right signals fast enough to act. When reporting is inconsistent, teams lose visibility into budget drift, schedule slippage, safety exposure, unresolved RFIs, quality rework, and field productivity. A strong construction project reporting system turns scattered site updates into decision-ready insight, so leaders can correct problems early, document accountability, and build trust with clients and stakeholders.
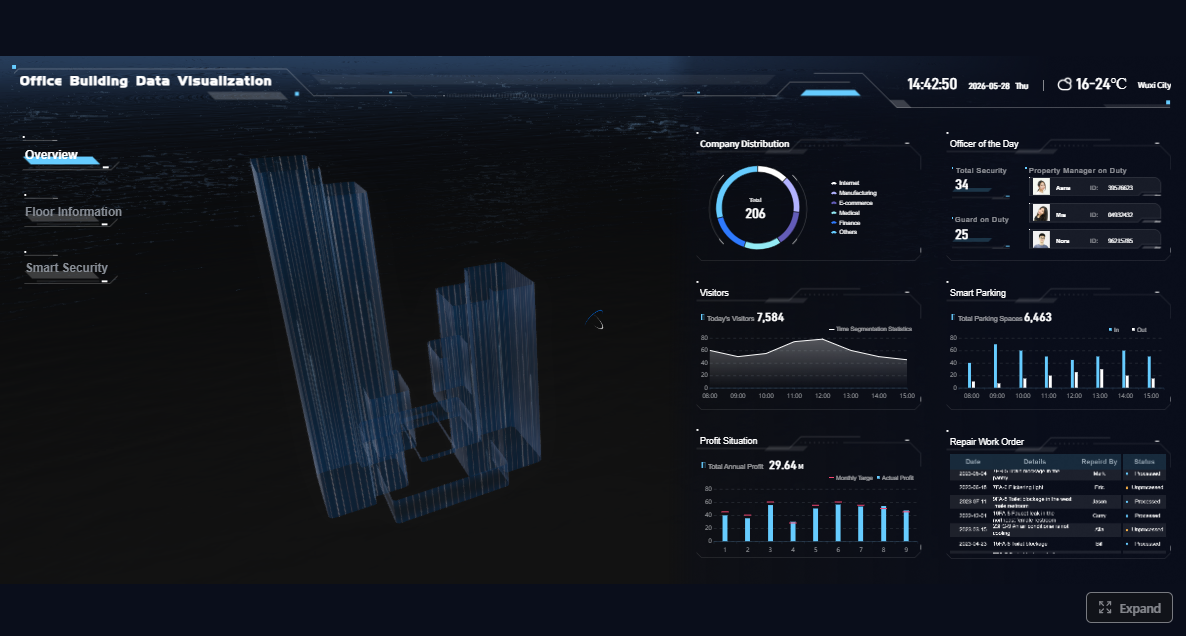
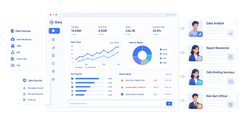
Click To Try The Dashboard
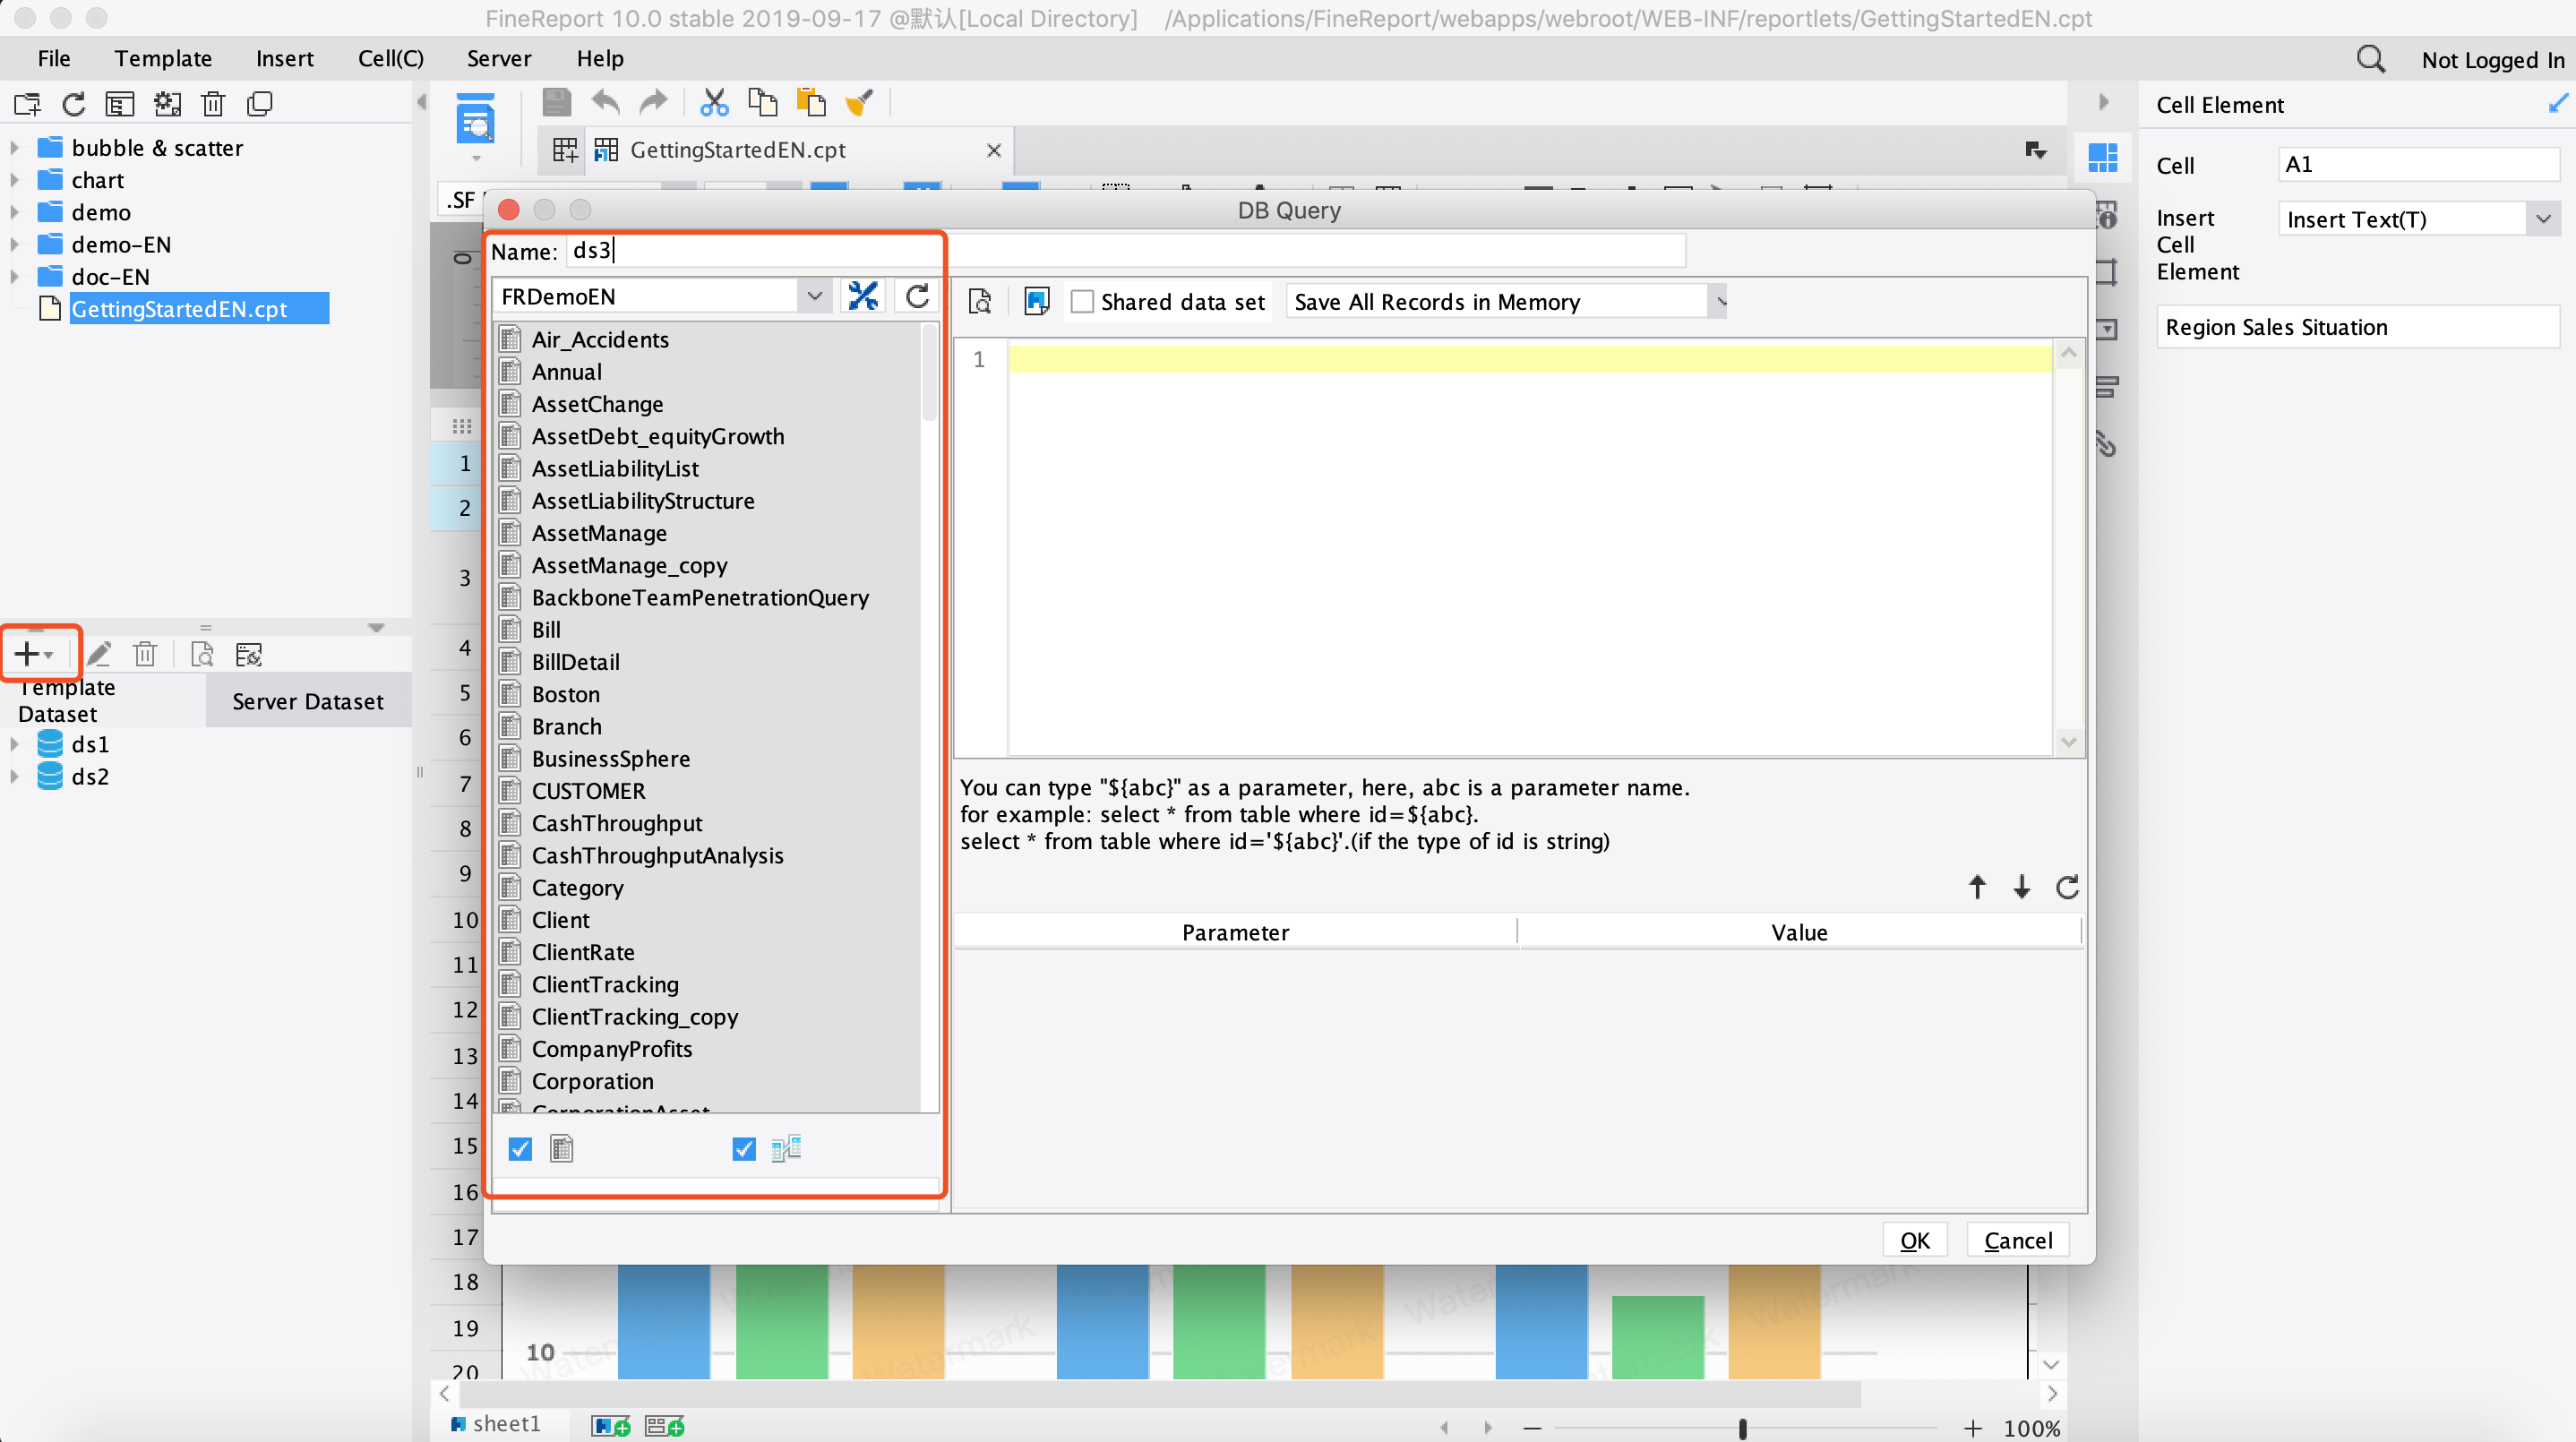
All reports in this article are built with FineReport
What construction project reporting is and why it matters
Construction project reporting is the structured process of collecting, validating, and communicating project information so teams can manage delivery in real time. In practice, that means translating jobsite activity, cost data, schedule updates, safety observations, and quality records into reports that different audiences can actually use.
For owners, reporting provides confidence that the project is progressing as contracted. For project managers, it supports coordination, forecasting, and issue escalation. For superintendents, it creates a factual daily record of field conditions, labor, materials, and disruptions. For contractors and trade partners, it aligns work status, open issues, and commitments across the project team.
Consistent construction project reporting improves visibility across the six areas that most often determine project success:
Cost: Are actuals, commitments, and change orders still aligned with the budget?
Schedule: Is the work progressing according to milestones and look-ahead plans?
Safety: Are hazards, incidents, and corrective actions being tracked and closed?
Quality: Are inspections passing, punch items resolving, and rework being contained?
Labor: Are crews productive relative to planned output?
Risk: Are emerging constraints and pending decisions visible before they cause delay?
When reporting is done well, decisions get faster. Teams stop debating whose spreadsheet is correct and start acting on a shared version of the truth. It also sharpens accountability: each issue has an owner, each variance has context, and each commitment can be traced. That transparency is what strengthens stakeholder trust—especially when the project hits turbulence.
What to track in a construction project reporting system
A reporting system only works if it captures the metrics that drive operational decisions. Too few metrics and leadership flies blind. Too many and reports become cluttered, late, and ignored. The goal is a focused framework that connects field reality to management action.
Core project metrics every team should monitor
Below are the Key Metrics (KPIs) every construction project reporting system should track:
Budget Variance: The gap between budgeted cost and actual or forecasted cost.
Committed Costs: Costs already contractually committed through subcontracts, POs, and agreements.
Cash Flow: Planned versus actual cash movement over time.
Change Order Value: Approved, pending, and disputed scope changes and their financial impact.
Schedule Percent Complete: Actual progress against planned schedule completion.
Milestone Status: On-time, at-risk, or delayed status for major delivery checkpoints.
Delay Days: Number of days lost due to weather, procurement, coordination, or field conditions.
Look-Ahead Readiness: Whether upcoming work is free of constraints and ready to execute.
Labor Productivity: Output achieved per labor hour compared to plan or estimate.
Recordable Safety Incidents: OSHA-recordable or internally defined safety events.
Safety Observations: Proactive field observations that identify unsafe acts or conditions.
Corrective Action Closure Rate: Speed and percentage of resolving safety or quality actions.
Inspection Pass Rate: Share of inspections passing the first time.
Open Punch Items: Outstanding closeout or quality items not yet completed.
RFI Aging: How long RFIs remain unresolved before they affect execution.
Submittal Status: Pending, approved, rejected, or overdue submittals.
Equipment Utilization: Planned versus actual equipment use and downtime.
Material Delivery Reliability: Whether critical materials arrive complete and on time.
Open Risks and Constraints: Known blockers, dependencies, and unresolved decisions.
Forecast at Completion: Expected final project cost or duration based on current trends.
These metrics matter because they connect directly to intervention points. For example, a rising RFI aging trend is not just a documentation issue—it is often an early warning for schedule disruption. A growing gap between committed cost and budget can signal procurement pressure before invoices hit the ledger.
Cost control metrics
Cost reporting should go beyond a simple budget-versus-actual comparison. Mature teams track:
Original budget
Approved budget revisions
Actual cost to date
Committed cost to date
Cost to complete
Forecast at completion
Pending and approved change orders
This helps leaders distinguish between what has already been spent, what has already been promised, and what is still likely to hit the project later.
Schedule and production metrics
Schedule reporting should show more than a gantt chart snapshot. Decision-makers need context around:
Planned versus actual progress
Milestone achievement
Near-term look-ahead tasks
Causes of delay
Trade-by-trade productivity
Constraint logs for upcoming work
A practical construction project reporting system ties schedule status to field production. If framing progress is behind, the report should also show labor hours, crew size, material status, and predecessor constraints.
Safety and quality metrics
Safety and quality reporting are often managed separately, but they should be visible together in leadership reporting because both affect risk, productivity, and client perception. Core items include:
Safety incidents and near misses
Hazard observations
Toolbox talk completion
Inspection outcomes
Nonconformance reports
Rework volume
Open punch items
Corrective action status
Field and stakeholder updates that keep reports useful
Metrics alone do not tell the full story. Reports stay useful when they include concise field and stakeholder updates that explain what changed, why it matters, and what needs a decision.
The best construction project reporting combines structured numbers with brief narrative context. Executives need the trend line. Project teams need the reason behind the trend line.
Types of construction reports teams use most often
Not every report serves the same audience or purpose. High-performing teams define report types clearly so the project does not drown in duplicate updates.
Operational reports used during active project delivery
Operational reports support day-to-day execution on the jobsite and in the project office. These are the reports that help teams coordinate work, document events, and respond quickly.
Common operational reports include:
Daily reports: Labor, weather, visitors, work performed, deliveries, and incidents.
Production reports: Quantities installed, crew performance, and productivity trends.
Site logs: Running record of notable events, constraints, or coordination issues.
Safety reports: Observations, incidents, toolbox talks, and compliance findings.
Incident reports: Documented safety or operational events requiring investigation.
Inspection reports: Results of quality, safety, or regulatory inspections.
Quality reports: Defects, rework, punch items, and corrective actions.
These reports are most effective when they are short, standardized, and time-bound. A daily report should not read like a novel. It should capture facts accurately enough to support operations and protect the project record.
Management and client-facing reports
Management reports are broader, more visual, and more decision-oriented. Their purpose is to tell leadership and clients what is happening, where the risks are, and what action is recommended.
Typical management and client-facing reports include:
Cost reports: Budget status, commitments, actuals, forecasts, and change order exposure.
Executive summaries: One-page health view across cost, schedule, safety, quality, and risk.
Forecasting reports: Expected cost at completion, schedule finish date, and trend analysis.
Change order logs: Status of proposed, pending, approved, and disputed changes.
Closeout reports: Final work status, punch completion, documentation, and turnover readiness.
Handover reports: Final asset, document, and open-item status for transition to operations.
A common mistake is sending the same report to every audience. Owners want clarity on outcomes, risk, and decisions. Field teams need task-level detail. Executives need trend summaries and exceptions. Tailor the format without creating separate manual reporting processes.
Best practices for writing construction reports that build trust
Trust is built when reports are timely, factual, easy to read, and clearly tied to decisions. The best reports reduce friction. The worst ones create confusion, rework, and defensive conversations.
Make every report clear, consistent, and decision-oriented
Use these best practices to improve the quality of every construction project reporting output:
Standardize the template.
Create one approved format for each report type so teams always know what to fill in and where to find information.
Write in plain operational language.
Avoid jargon-heavy commentary. State what happened, what it impacts, and what action is needed.
Separate facts from assumptions.
Facts belong in the body of the report. Forecasts, risks, and assumptions should be clearly labeled.
Show variance to plan.
Reports become more useful when they compare actuals to baseline, budget, target, or prior period.
Assign ownership for next steps.
Every issue should have an owner and a due date. Otherwise, reporting becomes passive documentation.
Use visuals strategically.
Dashboards, trend lines, heatmaps, and status indicators help stakeholders scan quickly and act faster.
A strong report should answer three questions in under a minute:
What changed?
Why does it matter?
What needs to happen next?
Avoid the reporting mistakes that reduce credibility
Even experienced teams weaken reporting quality when process discipline slips. The most common credibility killers are:
Incomplete field inputs
Late report submission
Conflicting numbers across systems
Missing narrative context for variances
Reports that are too long and bury critical issues
Visuals with no explanation
No clear recommendation or next action
Reuse of outdated data from previous periods
From a consultant’s perspective, inconsistent definitions are especially dangerous. If one team defines “percent complete” by billing status and another defines it by installed quantities, leadership will make bad decisions with false confidence.
4 actionable implementation best practices
If you are building or repairing your reporting process, start with these four steps:
Define one source of truth for each data domain.
Cost should come from the cost system, schedule from the scheduling platform, safety from the EHS workflow, and field progress from structured daily updates.
Create a reporting calendar.
Lock daily, weekly, and monthly cutoffs so teams know when data is due and when stakeholders can expect updates.
Automate exception reporting.
Flag threshold breaches automatically—for example, cost variance above 5%, RFIs older than 10 days, or milestones trending late.
Review report quality monthly.
Audit reports for completeness, timeliness, definition consistency, and decision usefulness. Fix the process, not just the document.
A 7-step process to build a construction project reporting system that works
A reliable construction project reporting system does not emerge from templates alone. It comes from governance, ownership, cadence, and continuous refinement. Here is the seven-step process I recommend to enterprise project teams.
Step 1 to Step 3: Start with purpose, audience, and report design
Step 1: Identify the decisions each report needs to support
Start with the decision, not the format. Ask:
What decision will this report help someone make?
What risk should it surface early?
What action should it trigger?
A weekly operations report may support manpower adjustments. A monthly executive report may support funding, escalation, or change approval. If the decision is unclear, the report will become noise.
Step 2: Define who needs which report, how often, and at what level of detail
Map your reporting audience by role:
Owners and executives: summary, trends, risks, decisions
Project managers: cross-functional detail and forecast data
Superintendents: operational status, constraints, and field readiness
Trade partners: scope-specific tasks, issues, and commitments
Safety and quality leads: exceptions, compliance, and closure status
Do not force one universal report on every audience. Instead, create a shared data layer that can feed tailored views.
Step 3: Standardize report templates, data fields, and approval workflows
This is where reporting becomes scalable. Standardize:
Field names
Calculation logic
Status definitions
Submission deadlines
Review and approval steps
Distribution lists
For example, “delay reason,” “change order status,” and “inspection result” should mean the same thing on every project. Standardization is what makes portfolio-level reporting possible.
Step 4 to Step 7: Create reliable reporting habits and improve over time
Step 4: Assign data owners for field, cost, schedule, safety, and quality inputs
Every reporting category needs a named owner. Without ownership, reports become a last-minute scramble.
Typical assignments may include:
Superintendent: daily field activity, labor, weather, site conditions
Project engineer or coordinator: RFIs, submittals, document status
Monthly: Cost, schedule, executive summary, forecast at completion, major risks
Consistency matters more than complexity. A simple report delivered on time every time beats an elaborate report that arrives late.
Step 6: Use dashboards, project management tools, and shared data sources to reduce manual work
Manual reporting introduces lag, duplication, and version-control issues. The better approach is to connect your reporting layer to shared data sources so dashboards update automatically and teams spend time interpreting the data rather than retyping it.
Use technology to:
Pull data from multiple systems into one reporting view
Refresh dashboards on schedule
Trigger alerts for exceptions
Distribute role-based reports automatically
Preserve historical snapshots for audit and lessons learned
Step 7: Review report quality regularly and refine the system based on project feedback
No reporting system is perfect on day one. Review whether reports are:
Arriving on time
Complete and accurate
Easy for stakeholders to interpret
Actually supporting decisions
Aligned to the project phase and risk profile
Then refine. Remove unused sections. Add missing KPIs. Simplify narrative fields. Update workflows where bottlenecks exist. A reporting system should evolve with project complexity.
How to keep construction project reporting actionable over the full project lifecycle
The signals that matter in preconstruction are not the same ones that matter in structural execution or closeout. To keep construction project reporting actionable, adapt the depth and emphasis of reporting as the project moves through each phase.
In preconstruction, reporting should focus on estimates, procurement timelines, design status, bid packages, and risk assumptions. During active construction, it should emphasize field production, cost control, schedule adherence, safety performance, and coordination issues. In closeout, the focus shifts to punch completion, documentation, commissioning status, and turnover readiness.
The most efficient teams also tailor outputs without duplicating effort. Instead of building separate reports from scratch, they maintain a common data foundation and publish different views for:
Executives: Portfolio health, forecast, top risks
Clients and owners: Milestones, budget position, decisions required
Field teams: Daily progress, constraints, manpower, deliveries
Trade partners: Scope status, dependencies, open issues, due dates
When reporting becomes lifecycle-aware, it does more than document status. It improves forecasting, sharpens communication, and creates a feedback loop that strengthens future projects. Teams can compare estimate assumptions to actual productivity, analyze recurring delay causes, and identify where safety or quality breakdowns repeatedly occur.
Build the system faster with FineReport
Building this manually is complex; use FineReport to utilize ready-made templates and automate this entire workflow. For enterprise construction teams, the value is not just dashboard design—it is the ability to centralize cost, schedule, safety, quality, and field data into one reporting layer that supports both project-level control and portfolio-level visibility.
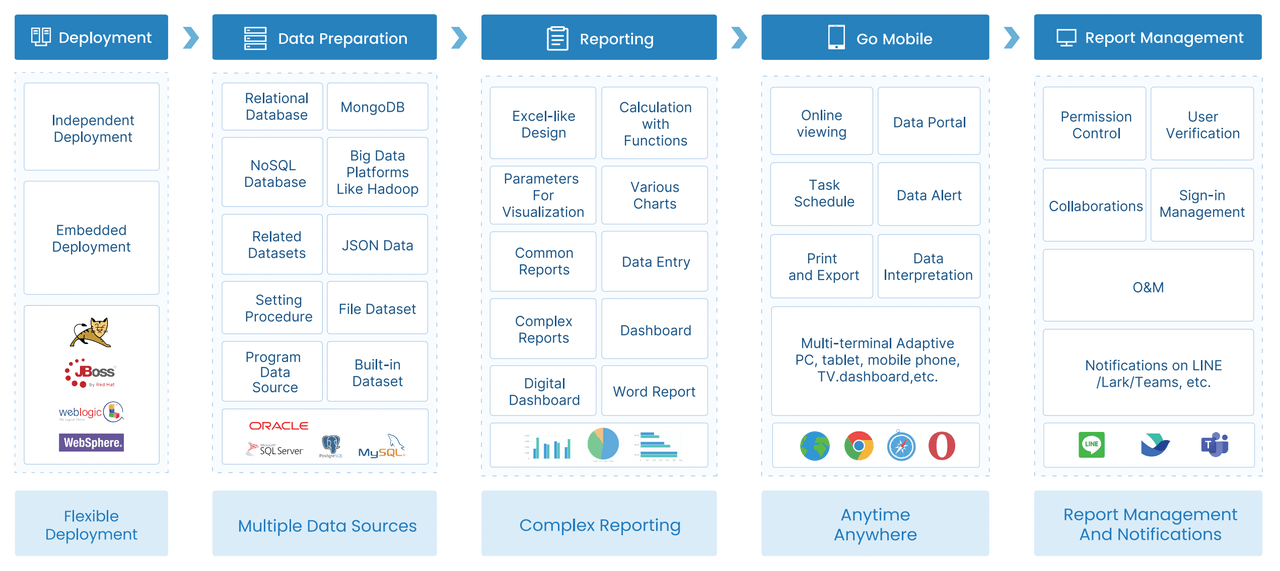
FineReport helps teams:
Build standardized construction project reporting templates
Connect multiple business systems and data sources
Automate recurring daily, weekly, and monthly reports
Create role-based dashboards for executives, PMs, and field leaders
Visualize KPIs with charts, scorecards, and drill-down views
Reduce manual spreadsheet work and version confusion
Get Ready-to-Use Dashboard Templates in Fine Gallery
If your current construction project reporting process depends on email attachments, disconnected spreadsheets, and last-minute data cleanup, that is a process risk—not just an admin inconvenience. FineReport gives you a faster path to standardization, automation, and trustworthy visibility across the full construction lifecycle.
Construction project reporting is the process of collecting, validating, and sharing project data so teams can monitor progress, costs, safety, quality, and risks. It turns field activity and back-office data into updates people can use to make faster decisions.
A strong report usually includes budget status, schedule progress, labor productivity, safety incidents, quality issues, RFIs, submittals, and major risks or constraints. The exact content should match the audience, whether that is owners, project managers, or field supervisors.
Daily reporting is best for field activity, safety events, labor, and disruptions, while weekly or monthly reporting works well for executive summaries and trend analysis. The right cadence depends on project complexity and how quickly issues need action.
Daily reports create a factual record of what happened on site, including weather, crews, deliveries, delays, and incidents. They improve accountability, support claims documentation, and help weekly and monthly reports stay accurate.
Reporting software reduces manual spreadsheets, standardizes templates, and pulls data into dashboards faster. Tools like FineReport can help teams spot budget drift, schedule slippage, and unresolved issues early enough to act.
Product Trial
FineReport
Pixel-perfect reports · Interactive dashboards · Easy data entry · Digital twins