Demand analysis is the process of understanding and forecasting the level of demand for a product or service. It involves analyzing various factors that influence customer behavior and preferences to predict future sales, optimize inventory, and improve business strategies.Companies must use accurate data to measure demand and improve their strategy. Demand changes quickly, so real-time analytics and self-service BI tools like FineBI help teams track data and adjust their approach. With digital transformation, a business can use demand analysis to make better decisions.
Understanding Demand Analysis
What Is Demand Analysis?
Demand analysis is a process that helps companies understand how much of a product or service customers want. This process uses data from market research, sales records, and customer feedback. Businesses use demand analysis to study patterns in buying behavior and to predict future needs. Market demand analysis looks at the whole market, not just one company. It helps identify which products are popular and which ones are not. Companies often conduct a market analysis to see how their products compare to others. They also use market research to find out what customers expect in the future.
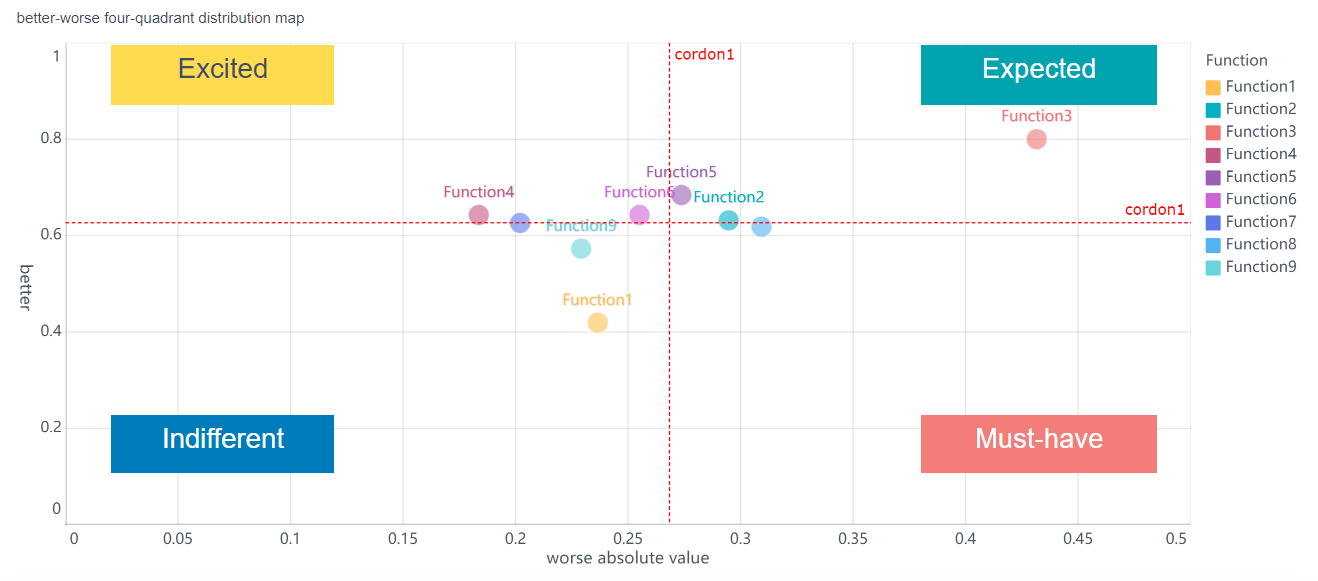
KANO model is a useful tool for classifying and prioritizing user demands, based on analyzing the impact of demands on user satisfaction, which shows the non-linear relationship between product performance and user satisfaction.
The four quadrants correspond to four types of demands, and their priority order is: must-be demands > one-dimensional demands > attractive demands > indifferent demands.
Must-be demands (must have): Pain points. For users, these demands must be met and are taken for granted. If must-be demands are not met, user satisfaction will decrease significantly. These are the core demands that must be considered when designing a product.
One-dimensional demands (should have): If these demands are met, user satisfaction will increase; otherwise, user satisfaction will decrease. One-dimensional demands are significant in comparing competitive products.
Attractive demands (may have): Functions that delight users, which are beyond users' expectations and increase users' loyalty. If attractive demands are not met, user satisfaction will not decrease.
Indifferent demands (optional): Demands that users do not care about and do not affect user experience. Avoid designing functions of this type.
Why Demand Analysis Matters
Market demand analysis helps businesses stay ahead of competitors. It allows them to adjust their strategy quickly when customer needs change. With better data, companies can predict demand and avoid overstocking or running out of products. Market research and market analysis work together to give a full picture of what customers want now and in the future. Businesses that conduct a market analysis regularly can make better decisions and succeed in a fast-changing world.
Demand Analysis Components
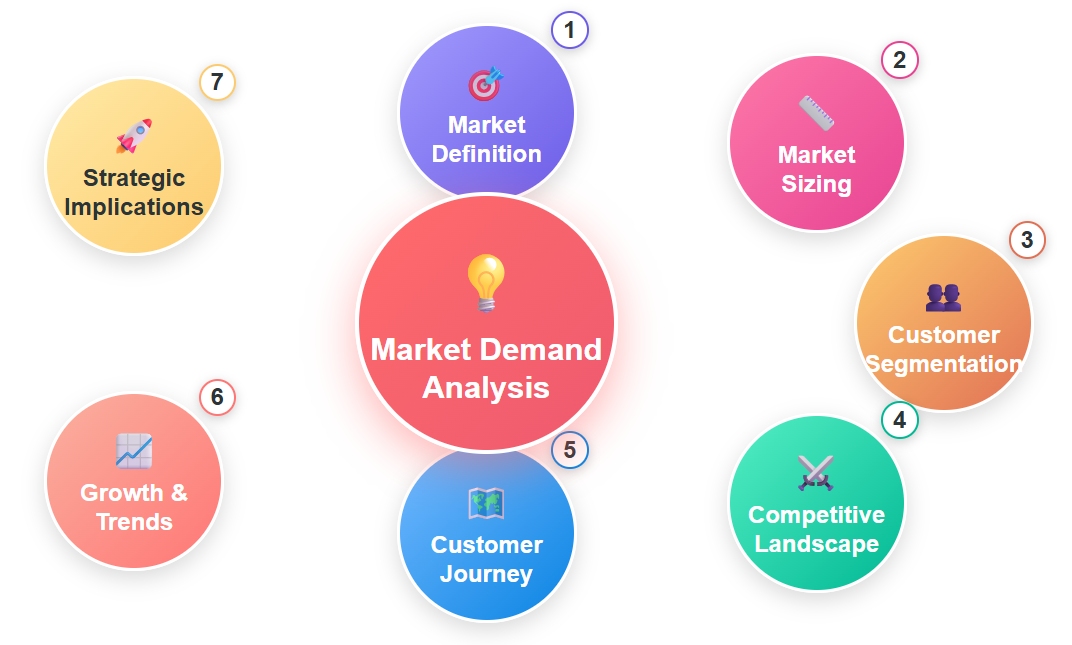
A strong market analysis depends on understanding the main components of market demand analysis. Each part helps a business see the full picture of demand for a product. Companies use these components to guide product demand analysis and improve their strategy.
Market Definition Businesses start by defining the market. They set clear boundaries for the product, customer segments, and regions. This step ensures that market demand analysis focuses on the right area.
Market Sizing Teams measure the size of the opportunity. They look at the total addressable market, serviceable available market, and serviceable obtainable market. Accurate market sizing helps companies estimate demand for each product.
Customer Segmentation Companies break down the market into groups. Each segment has unique needs and preferences. This step allows for targeted product demand analysis and better market analysis.
Competitive Landscape Businesses map out competitors. They study how others capture value in the market. Understanding the competition shapes market demand analysis and product strategy.
Customer Decision Journey Teams analyze how customers learn about, evaluate, and choose a product. They look for pain points and loyalty drivers. This journey is key for market analysis and predicting demand.
Growth Drivers, Trends & Risks Companies identify what drives growth or decline. They watch for changes in technology, society, the economy, and regulations. These trends affect market demand analysis and future product demand.
Strategic Implications Insights from all components lead to action. Businesses use these findings to adjust their product, pricing, and marketing plans. This step connects market analysis to real business results.
Tip: Modern market demand analysis uses many data sources. Businesses connect to databases, applications, APIs, and unstructured data. They store this information in data lakes or warehouses. Data integration platforms help combine these sources for real-time or batch processing. This approach supports every layer of market analysis and product demand analysis.
A complete market demand analysis framework gives companies a clear view of demand. Each component works together to support better decisions about every product.
Steps of Demand Analysis
Demand analysis follows a series of clear steps. Each step helps a business understand demand and make better decisions. Companies that follow these steps can improve their ability to predict demand and respond to changes in the market.
Define the Objective The first step sets the purpose of the demand analysis. Teams decide what product or service they want to study. They also choose the time frame and the market segment.
Collect Data Businesses gather data from many sources. They use sales records, customer surveys, and market research. Some companies also collect data from external sources, such as economic reports or weather patterns.
Analyze Data Teams look for patterns in the data. They study past sales, customer preferences, and market shifts. This step helps them see what drives demand and spot changes early.
Segment the Market Companies divide the market into groups. Each group has different needs and buying habits. This step allows for a more detailed demand analysis.
Build Forecasting Models Teams use the data to create models that predict future demand. They combine quantitative and qualitative methods to improve accuracy. Many companies now use AI and machine learning to refine their forecasting.
Review and Adjust Businesses check their models often. They update them with new data and adjust for changes in the market. This step keeps the demand analysis relevant.
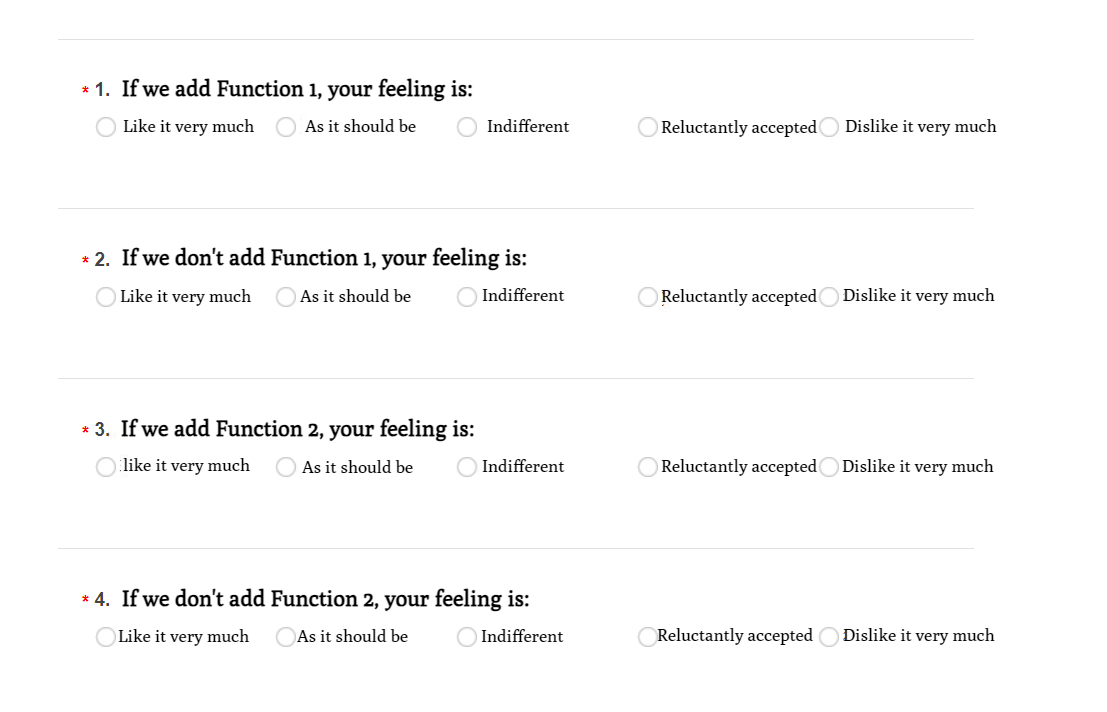
Designing a Questionnaire
Best Practices:
Combine different methods for better forecasting.
Update models regularly with new data.
Include outside factors like economic trends and weather.
Encourage teamwork between sales, marketing, and supply teams.
Use simple models to avoid errors.
Train staff to use demand analysis tools.
Stay flexible to adapt to new forecasting trends.
A strong demand analysis process helps companies stay ahead. They can spot shifts in demand, respond quickly, and plan for the future with confidence.
Many companies use demand analysis to improve business outcomes. Real-world examples show how organizations apply demand analysis to optimize product planning, inventory, and customer satisfaction. These cases highlight the value of using data to understand demand for every product.
Walmart uses predictive demand signals and real-time point-of-sale data. This approach helps the company manage inventory and keep the right product available for customers.
Amazon applies AI-driven demand forecasting in supply chain planning. The company reduces stockouts and logistics costs by predicting demand for each product.
Domino’s Pizza integrates digital and store data. The company enables targeted promotions and better inventory planning, which leads to higher orders and better product margins.
Patagonia, Toyota, and Google use analytics to support demand-driven decisions. These companies focus on sustainability, manufacturing precision, and user behavior insights to improve product performance.
Company
Measurable Results
Description
Finsbury Food Group
- Reduced net working capital by £1.6 million - Doubled planning team productivity - Improved service levels by 5% YoY
Implemented AI-driven demand forecasting and production scheduling, enabling proactive planning and better resource allocation.
Upgraded supply chain planning infrastructure with advanced demand planning capabilities for better forecast accuracy and collaboration.
Blendwell Food Group
- Improved forecast accuracy and customer service by 5-10% - Waste reduction within 3 months
Modernized planning processes with real-time forecast adjustments and integrated supply planning, reducing overproduction risks.
Various companies
- Forecast accuracy up to 99% - Stockout reductions up to 85% - Inventory reductions up to 30%
Demonstrates broad impact of modern demand planning across industries.
Note: Companies that use demand analysis for every product can achieve higher forecast accuracy, reduce waste, and improve service levels. These examples show how demand analysis supports better business decisions and product success.
Using FineBI for Demand Analysis in Your Business
FineBI gives organizations a powerful way to understand and manage demand. The platform uses predictive analytics and real-time dashboards to help teams make better decisions. Companies can see trends, spot risks, and respond quickly to changes in the market.
FineBI leverages AI and machine learning to improve forecasting. These tools help businesses predict customer behavior and optimize inventory. For example, a logistics company reduced stockouts by 18% after using machine learning models for demand forecasting. FineBI connects with enterprise systems and supports real-time analysis, which means teams always have the latest information. Industry experts note that organizations using integrated BI tools like FineBI achieve higher decision accuracy.
FineBI integrates with many external data sources, making demand analysis more comprehensive. The table below shows how FineBI connects to external databases in different deployment methods:
Deployment Method
Integration with External Data Sources
Key Points
Containerized Deployment
Connects to external databases automatically during deployment.
No manual setup needed; database installed and connected.
Package Deployment
Requires manual configuration of external databases after deployment.
Database must be prepared and configured manually.
Standalone Deployment
Needs manual configuration of external databases, similar to package deployment.
Database setup and configuration is necessary.
Cluster Deployment
Supports deployment of external databases for backup and high availability.
External databases are key for backup and high availability.
Businesses can measure the return on investment from demand analysis using FineBI’s KPI dashboards. These dashboards track financial, asset, and operational metrics in real time. Custom dashboards compare campaign effectiveness, helping companies reallocate resources for better results. By tracking ROI and ROAS, businesses can see which strategies work best and improve their demand planning.
A data-driven approach to demand analysis transforms how a business predicts product needs and responds to market shifts. FanRuan solutions help organizations integrate external data sources and real-time analytics. Companies that use these tools can optimize demand planning and achieve stronger product performance.
Start Free Trial of FineBI to unlock your business potential. For more infomation about its functions, refer to the product guide.
Smarter product, pricing, and inventory management across retail sectors.
FAQ
What is the main benefit of using FineBI for demand analysis?
FineBI helps teams analyze demand data quickly. Users can create dashboards without coding. The platform supports real-time updates, so businesses always see the latest trends.
How does FineBI connect to different data sources?
FineBI connects to over 60 data sources, including databases, cloud platforms, and APIs. Users can upload files or link to external systems. This flexibility supports comprehensive demand analysis.
Can non-technical users perform demand analysis with FineBI?
Yes. FineBI uses a drag-and-drop interface. Business users can build reports and dashboards without technical skills. The platform guides users through each step.
How does FineBI support secure data sharing?
FineBI allows users to share dashboards with password protection and time limits. Administrators control permissions. This keeps sensitive demand data safe.
Why is real-time analytics important for demand analysis
Real-time analytics helps businesses respond to market changes faster. Teams can adjust plans based on current data. This leads to better decisions and improved performance.