Break-even analysis, also known as break-even point analysis or cost-volume-profit (CVP) analysis, is a mathematical analysis method used to forecast profits, control costs, and evaluate operational performance based on a comprehensive analysis of the interdependence among product business volume, costs, and profits.
Break even analysis helps you understand when your sales will start covering your costs. This method gives you clear insight into pricing, budgeting, and risk. Many businesses use break-even analysis to set sales goals, refine pricing, and measure performance. For example, a fitness tracker launch used break even analysis to estimate reaching profitability in ten months. Tools like FineBI from FanRuan make break even analysis faster and easier by visualizing your cost and sales data.
Break-even analysis is a financial tool that helps you figure out when your business will start making a profit. You use break-even analysis to find the point where your total sales cover all your costs. At this stage, your revenue equals your total costs, so you do not make a profit or a loss. This point is called the break-even point.
You need to look at three main parts in break-even analysis:
Fixed costs: These are expenses that stay the same, like rent or salaries.
Variable costs: These change with how much you produce, such as materials or hourly wages.
Selling price: This is what you charge for each product or service.
To find your break-even point, you divide your fixed costs by the difference between your selling price and your variable cost per unit. For example, if your fixed costs are $10,000, your selling price is $50, and your variable cost per unit is $30, your break-even point is 500 units. This means you must sell 500 units to cover all your costs.
Break-even analysis gives you a clear view of how your costs and sales work together. You can use tools like FineBI to organize your cost data and visualize your break-even point. FineBI helps you see your numbers in real time, making your analysis faster and more accurate.
Why It Matters for Businesses
Break-even analysis is important for every business. You use it to make smart decisions based on facts, not guesses. This analysis helps you set the right price for your products, plan your sales goals, and avoid financial losses. You can spot missing or underestimated costs before they become a problem.
With break-even analysis, you can:
Set realistic sales and revenue targets.
Manage your costs and control spending.
Plan for profit and avoid risky investments.
Show investors your business is viable.
Break-even analysis also helps you prepare for changes, like new products or market shifts. You can use it to test different scenarios and see how changes in costs or prices affect your break-even point.
Step-by-Step Guide to Break Even Analysis
If you want to master break even analysis, follow this step-by-step guide. You will learn how to identify your costs, set your sales price, and calculate your break-even point. This process helps you understand when your business will start making a profit and how changes in costs or sales affect your results.
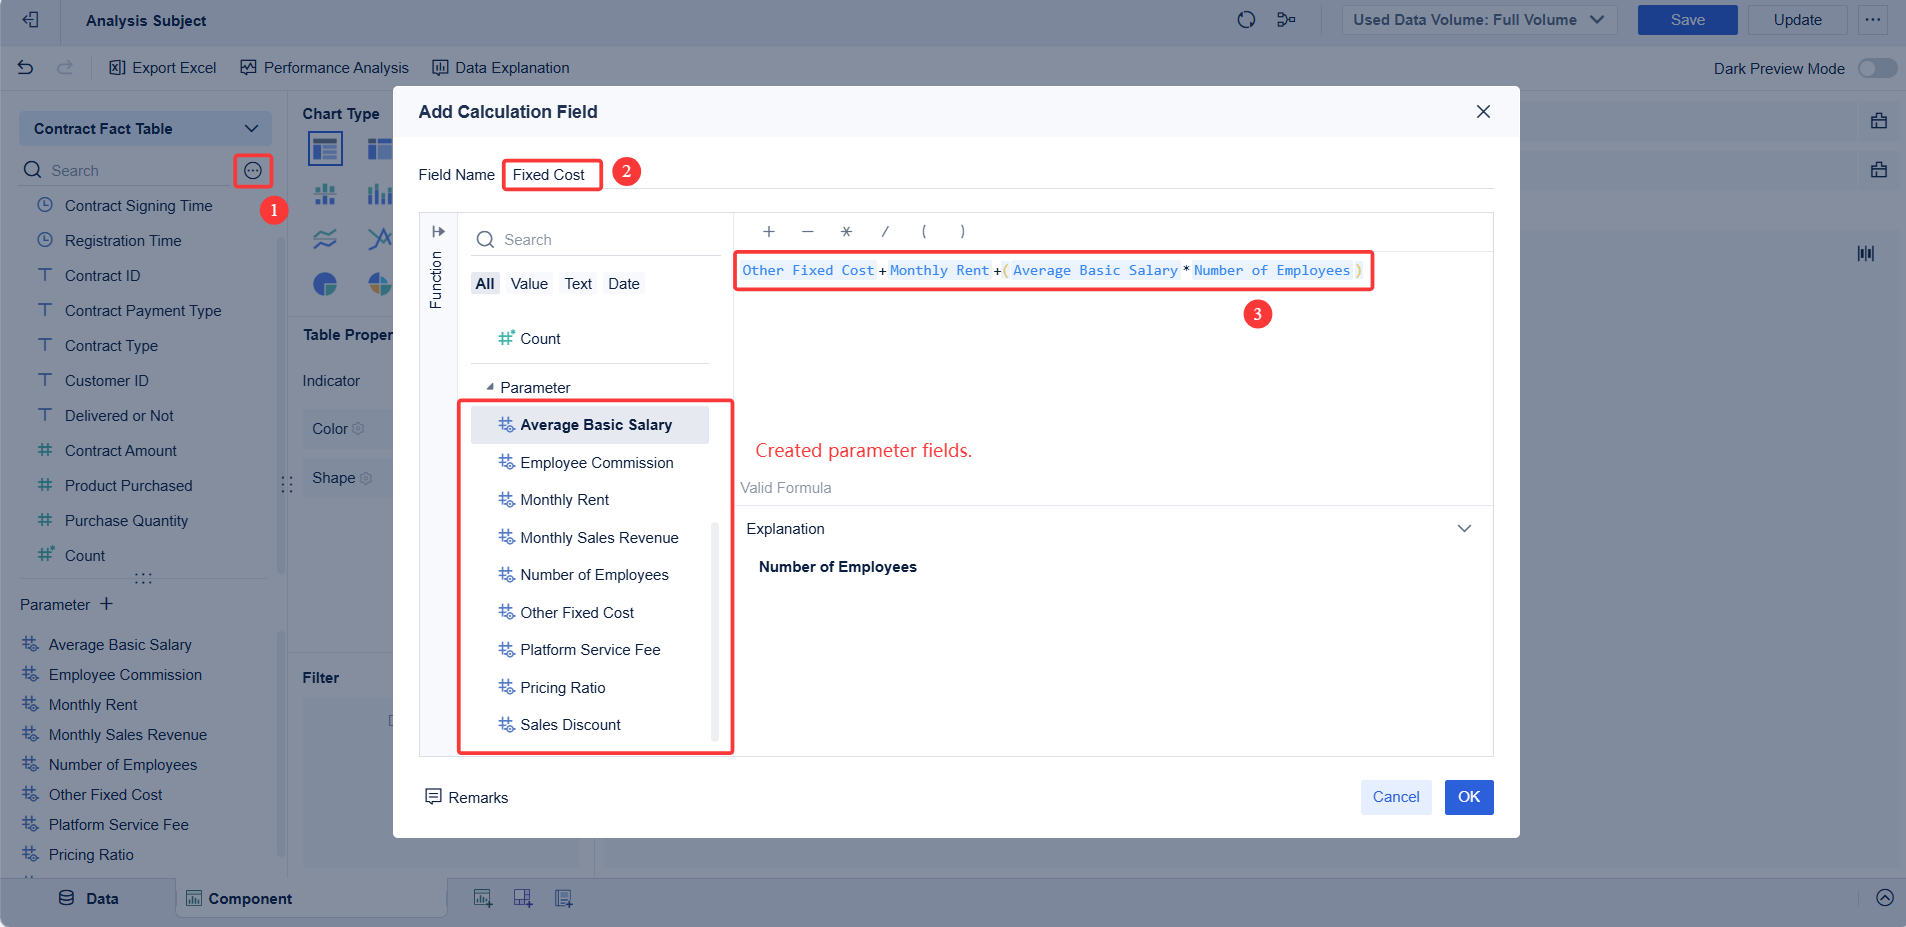
Identify Fixed Costs
Start by listing all your fixed costs. These are expenses that do not change, no matter how much you produce or sell. Fixed costs stay the same each month or year. In a manufacturing business, common fixed costs include:
Rent or lease payments for your factory or office
Salaries for permanent staff
Insurance premiums (liability, property, health)
Depreciation on equipment and vehicles
Loan repayments with fixed monthly installments
Utilities such as water, electricity, and internet (if billed at a flat rate)
Property taxes
Software licenses for business applications
Tip: Use accounting software or business intelligence tools like FineBI to track and categorize your fixed costs. FineBI lets you create reports and dashboards that show all your fixed expenses in one place. This makes your break-even analysis more accurate and saves time.
You can also use a table to organize your fixed costs:
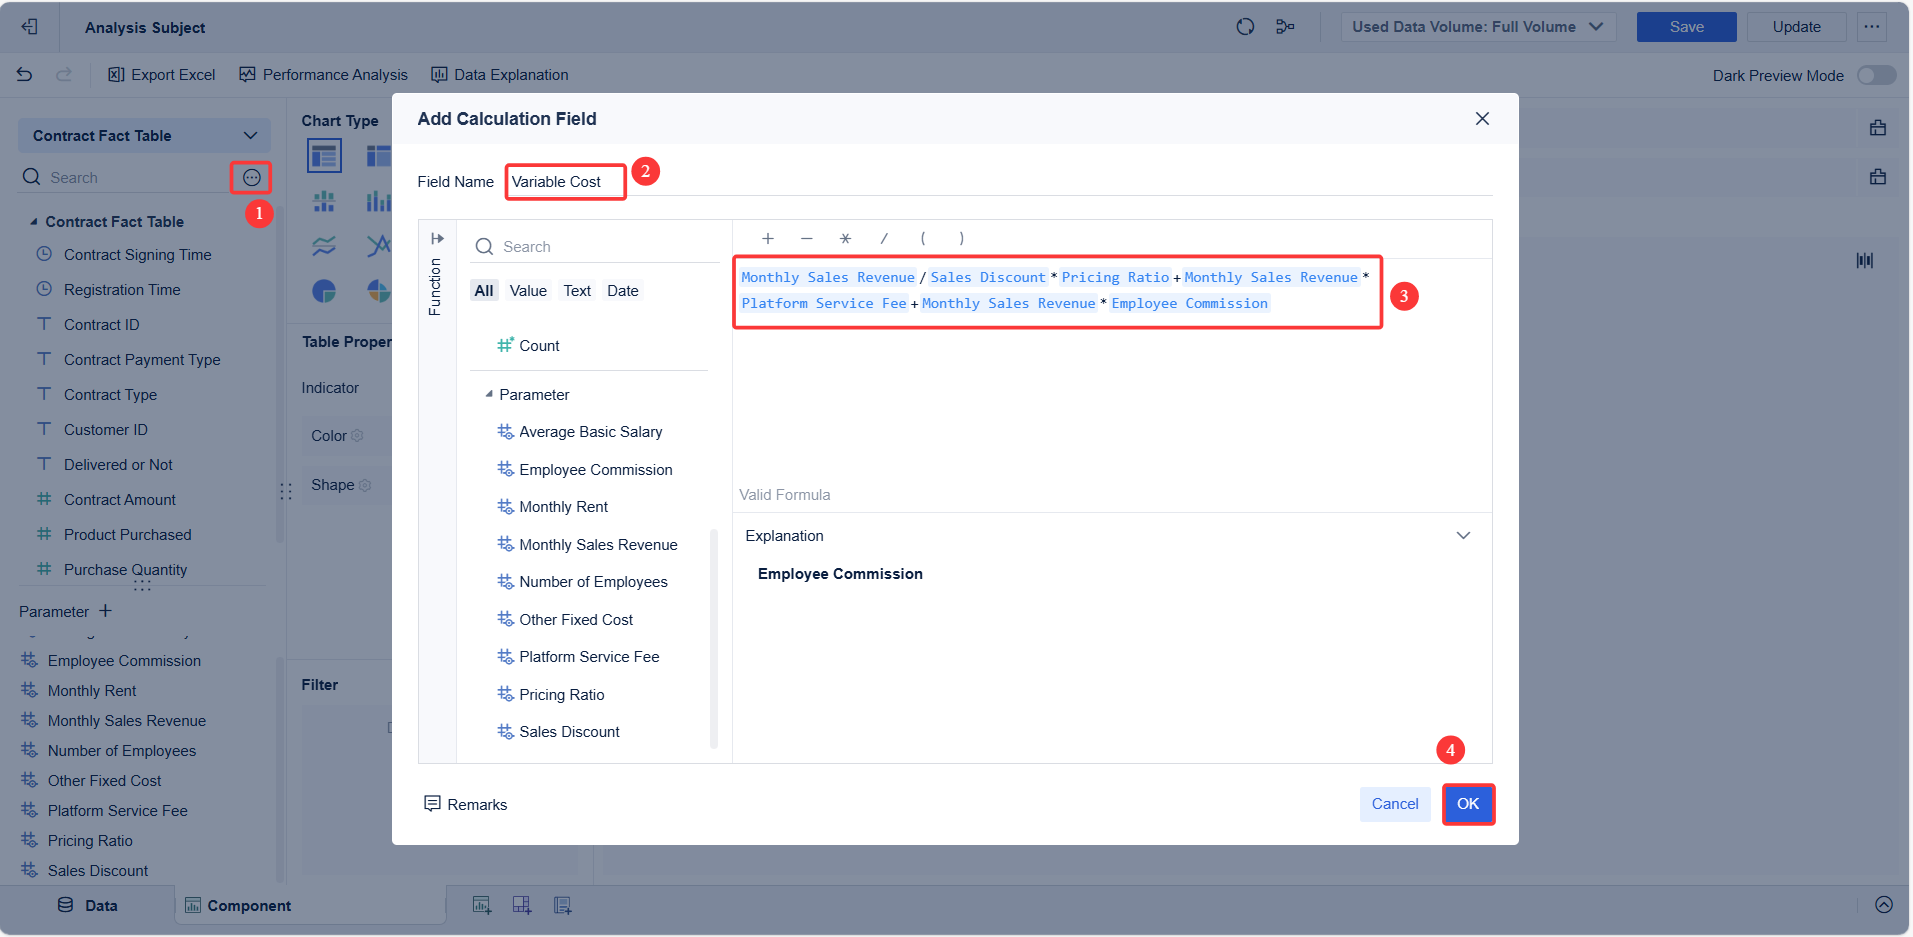
Next, list your variable costs. These costs change with your production or sales volume. The more you produce, the higher your variable costs. In manufacturing, typical variable costs include:
Raw materials (e.g., steel, plastic, fabric)
Direct labor (wages paid per unit produced)
Packaging materials
Shipping and distribution
Utilities that increase with production (like electricity for machines)
Sales commissions
Credit card fees (if you accept card payments)
For example, if you make basketballs, your variable costs might look like this:
Raw materials: $2 per ball
Direct labor: $1 per ball
Packaging: $0.50 per ball
Shipping: $0.75 per ball
Sales commission: $0.25 per ball
Note: FineBI can help you track variable costs by connecting to your production and sales data. You can see how costs change as you produce more units. This helps you spot trends and control spending.
Variable Cost Field Creation of Break Even Analysis
Now, decide on your sales price per unit. This is the amount you charge customers for each product. When setting your sales price, consider these factors:
Cost of goods sold (COGS): Add up raw materials, labor, overhead, shipping, and packaging.
Market demand: Research what customers are willing to pay.
Competition: Check prices of similar products in your industry.
Distribution channels: Factor in costs for selling online, in stores, or through distributors.
Taxes and regulations: Include sales tax, VAT, or tariffs.
Pricing strategy: Choose between premium pricing, competitive pricing, or discount pricing.
Tip: Analyze market trends and competitor pricing to find the best price point. FineBI can visualize sales revenue and compare it to your costs, helping you test different pricing scenarios.
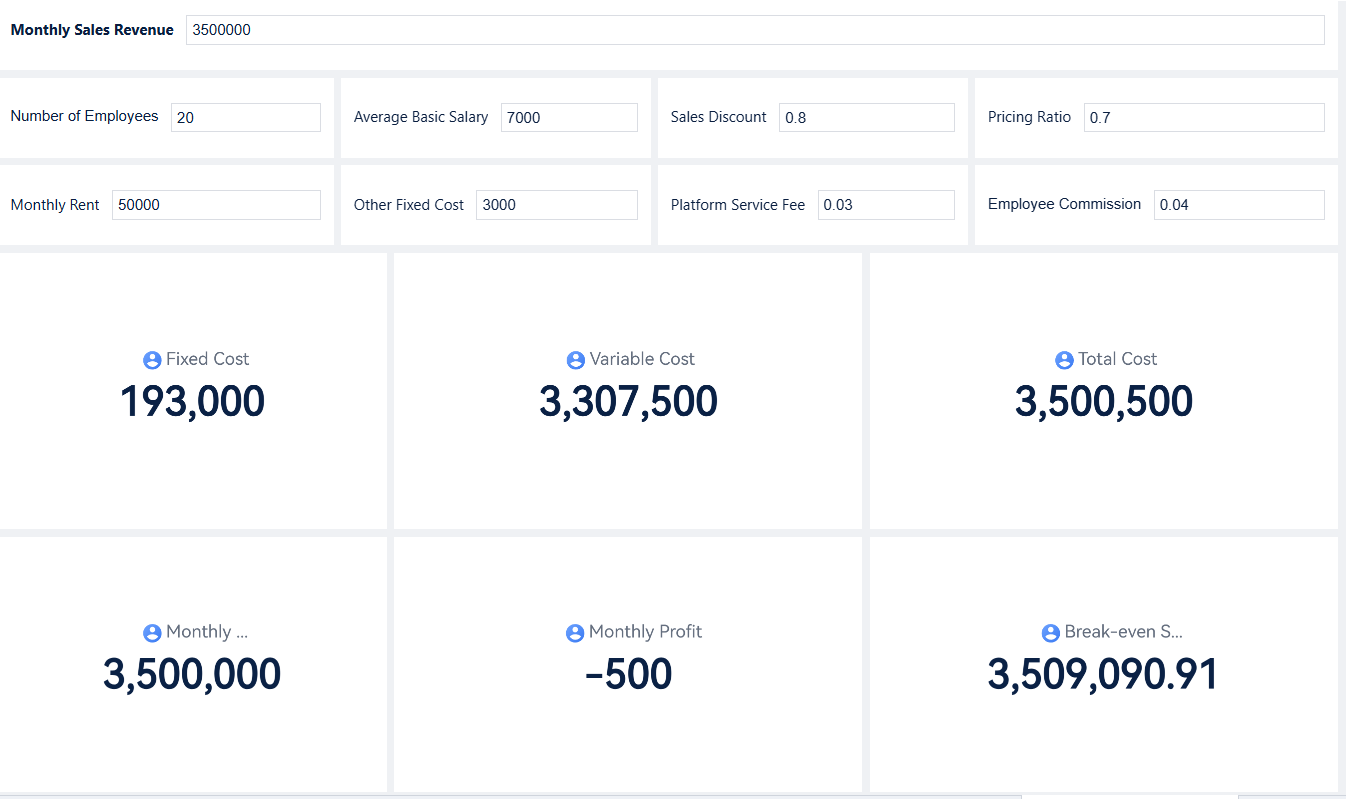
Calculate Break-Even Point
You are now ready to calculate your break-even point. Use the break-even formula:
Break-even point (units) = Fixed Costs / (Sales Price per Unit – Variable Cost per Unit)
For example, if your fixed costs are $8,500, your sales price per unit is $10, and your variable cost per unit is $4.50, your break-even calculation looks like this:
Break-even point = $8,500 / ($10 - $4.50) = $8,500 / $5.50 ≈ 1,545 units
This means you must sell about 1,545 units to cover all your costs. Every unit sold after this point adds to your profit.
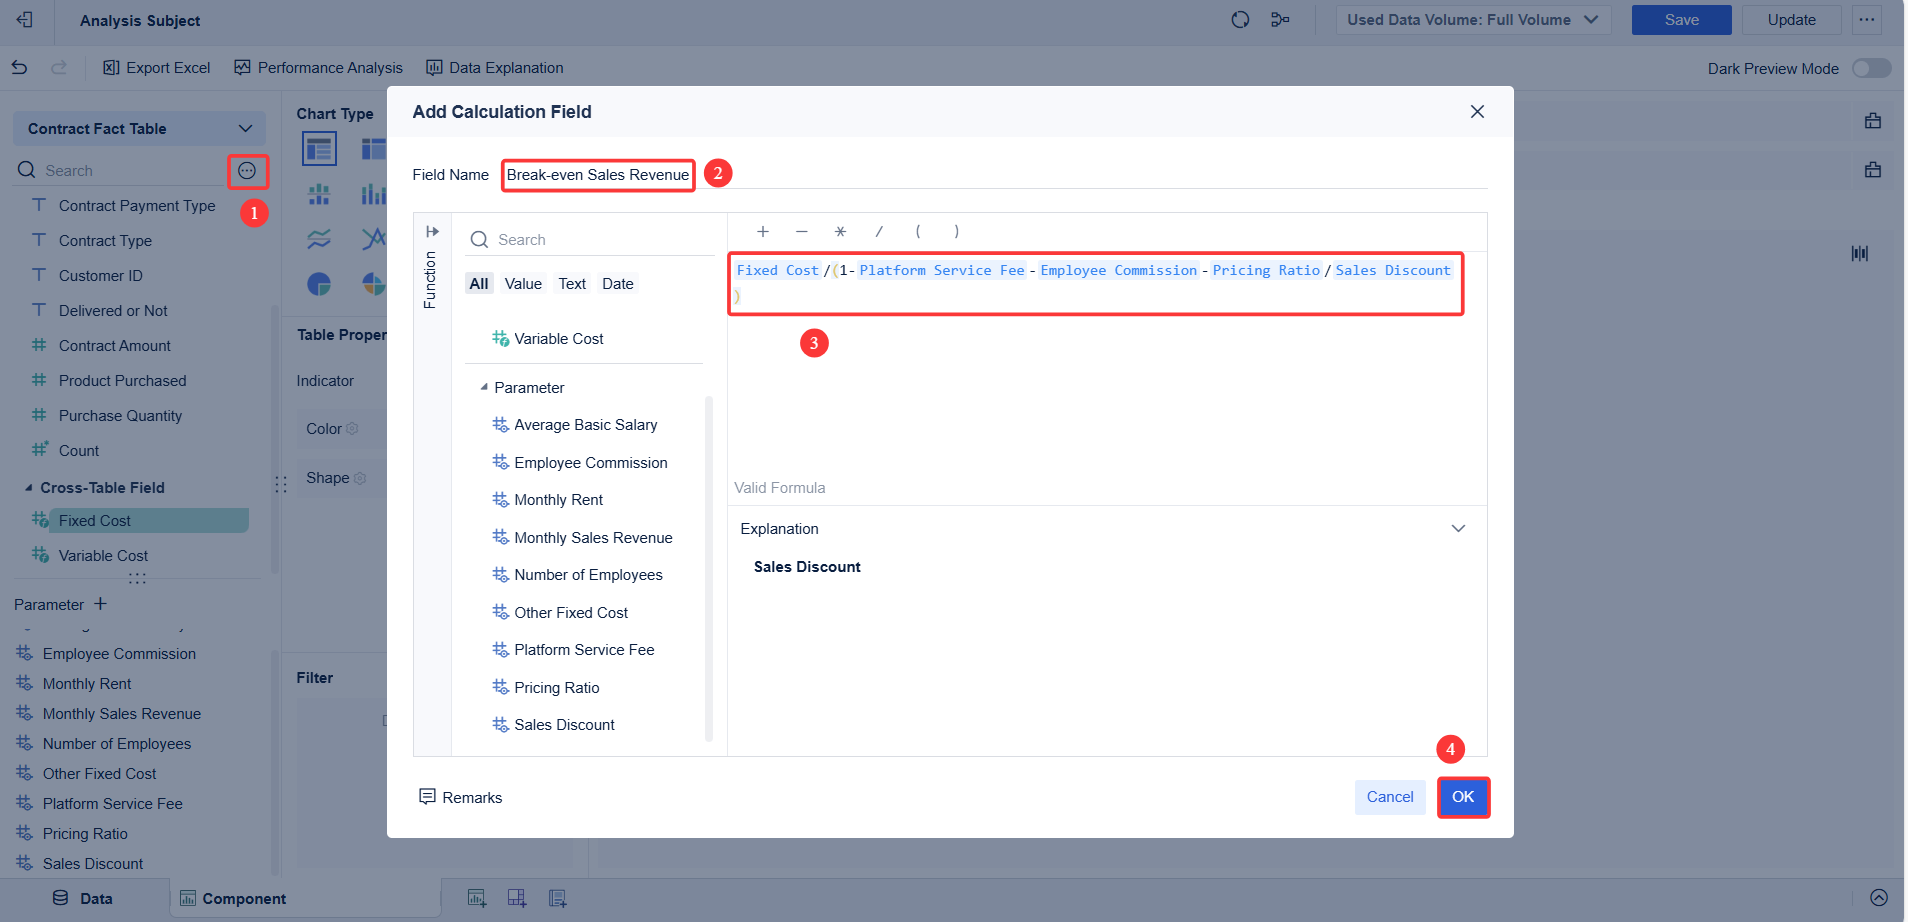
FineBI can automate these calculations. You can build dashboards that update your break-even point in real time as your costs or sales price change. This makes it easy to run what-if scenarios and see how changes affect your break-even sales.
Break-even Sales Revenue Field CreationBreak Even Analysis Demo
For more information about how to do break even analysis, refer to the Help Document.
Interpret the Results
After you calculate your break-even point, use the results to guide your business decisions. Here is what you can learn:
The minimum sales volume you need to avoid losses
How changes in costs or sales price affect your break-even point
Whether your current sales targets are realistic
If your pricing strategy supports your profit goals
How sensitive your business is to cost or price changes
Break-even analysis helps you set clear sales targets and manage risk. If your break-even point is too high, look for ways to lower costs or raise your sales price. FineBI lets you visualize your break-even analysis with charts and graphs, making it easier to share insights with your team.
You can also use break-even analysis to:
Test new product ideas before launch
Plan for market changes or cost increases
Compare your performance to industry benchmarks
Align your break-even metrics with long-term financial goals
Break-even analysis is a key part of cost-volume-profit planning. It gives you the confidence to make informed decisions and grow your business.
Break Even Analysis Examples
Product Launch Scenario
You can use break-even analysis to plan a successful product launch. Imagine you work at AppVoyage, a tech start-up launching a travel assistance app. You want to know how many users you need to cover your costs and reach your break-even point. The table below shows how you can organize your break-even analysis:
Aspect
Details
Initial Investment
$500,000
MVP Development Cost
$150,000
Marketing Budget
$100,000
Operational Expenses
$30,000/month
Monetization Model
Freemium (premium subscriptions)
Average Revenue
$30,000/month
ARPU
$2 per user
Variable Cost per User
$0.50
Break-Even Point
20,000 users/month
User Base at 1 Year
200,000 users (10% paid conversion)
Outcome
Break-even achieved within first year
You can use break-even analysis to set your sales targets and pricing.FineBI helps you visualize your break-even point by tracking user growth, costs, and revenue in real time. You can adjust your strategy if your break-even point is too high or if your costs increase.
Manufacturing Budget Planning
Break-even analysis is also important in manufacturing. Suppose you manage Company A, which produces water bottles. You want to know how many bottles you must sell to cover your costs. Follow these steps:
List your fixed costs, such as property taxes, lease, and executive salaries. Total: $100,000.
Calculate your variable cost per bottle: $2.
Set your selling price per bottle: $12.
Use the break-even formula: $100,000 / ($12 - $2) = 10,000 bottles.
You must sell 10,000 bottles to reach your break-even point.
FineBI lets you track your production, costs, and sales volume. You can see how changes in costs or price affect your break-even point. This helps you plan your budget and avoid losses.
Using FineBI for Break Even Analysis
Data Integration and Preparation
FineBI makes break-even analysis simple by helping you bring all your data together. You can connect FineBI to many sources, such as spreadsheets, databases, or cloud platforms. This means you can gather your costs, sales, and total revenue data in one place. FineBI lets you clean and organize your data before you start your break-even calculations. You can select only the fields you need, join tables, and create new metrics. This helps you see your fixed costs, variable costs, and sales numbers clearly.
Tip: Use FineBI’s self-service tools to prepare your data. You do not need to write code. You can drag and drop fields to build your own break-even reports.
When you prepare your data well, you avoid mistakes in your break-even point calculation. You can also update your data easily, so your analysis always uses the latest numbers.
Visualizing Break-Even Points
You can use FineBI’s dashboards to visualize your break-even analysis. The drag-and-drop dashboard builder lets you create charts, tables, and graphs that show your costs, sales, and break-even point. Real-time dashboards in FineBI update as soon as your data changes. This helps you monitor your break-even status for ongoing projects.
You can filter and drill down into your data to see which costs have the biggest impact on your break-even point.
Project management dashboards show progress bars and charts, making it easy to track how close you are to reaching your break-even point.
Financial dashboards display your income, costs, and total revenue, so you can see if you are on track to cover all your costs.
FineBI’s interactive features help you explore your data and make better decisions. You can test different scenarios, such as changing your sales price or reducing a cost, and see how these changes affect your break-even point. This empowers you to make data-driven decisions and keep your business on the path to profit.
Tips to Improve Break Even Analysis Results
Improving your break-even analysis results can help you reach profitability faster and make your business more resilient. You can take action in three main areas: reducing fixed costs, lowering variable costs, and adjusting pricing. Each step brings you closer to a lower break-even point and stronger financial health.
Reduce Fixed Costs
You can lower your break-even point by cutting fixed costs. Start by reviewing your expenses and separating fixed from variable costs. Here are some effective strategies:
Automate repetitive tasks with technology or AI to save on labor costs.
Negotiate with suppliers for better rates or longer contract terms.
Build small, skilled teams and consider remote work to reduce office expenses.
Move to a smaller or more affordable space, or sublease unused areas.
Regularly review insurance, fees, and vendor contracts for savings.
Monitor energy use and invest in efficient equipment to cut utility costs.
Tip: Track your fixed costs over time and set clear goals for cost reduction. Involve your team in finding new ways to save.
Lower Variable Costs
Lowering variable costs directly improves your break-even analysis. You can:
Invest in energy-efficient machinery and reduce production waste.
Use just-in-time inventory systems to avoid excess stock.
Buy in bulk to get lower prices per unit and negotiate better supplier terms.
Focus on your most profitable products and cut less effective ones.
Monitor variable costs regularly and look for new savings.
A lower variable cost means you need to sell fewer units to cover your fixed costs, which boosts your profitability.
Adjust Pricing
Adjusting your pricing strategy can have a big impact on your break-even point. Use break-even analysis to test different price points and see how they affect your sales targets. Consider these approaches:
Raise prices when your analysis shows you can do so without losing customers.
Use value-based pricing to match your price to the value you deliver.
Try dynamic pricing to respond to market demand and competitor changes in real time.
Note: Dynamic pricing models powered by AI can increase revenue and lower the sales volume needed to reach profitability.
By combining these strategies, you can lower your break-even threshold, improve profitability, and make smarter business decisions.
You now know how to perform break even analysis step by step. This process helps you see when your sales will cover your costs and how to reach profitability. Break-even analysis gives you a clear view of your business health and supports better planning. Try FineBI to organize your data and visualize your break-even analysis. Download a free template or start a FineBI trial today. Apply break even analysis to your business and make smarter decisions.
Start Free Trial of FineBI to unlock your business potential. For more infomation about its functions, refer to the product guide.
Smarter product, pricing, and inventory management across retail sectors.
FAQ
What is the main benefit of break-even analysis?
You gain a clear understanding of when your business will start making a profit. This helps you set realistic sales goals and make smarter financial decisions.
How often should I update my break-even analysis?
You should update your break-even analysis whenever your costs or prices change. Regular updates keep your analysis accurate and help you respond quickly to new business challenges.
Can I use break-even analysis for services, not just products?
Yes! You can apply break-even analysis to both products and services. Just identify your fixed and variable costs, then use the same formula to find your break-even point.
How does FineBI make break-even analysis easier?
FineBI lets you connect your data, automate calculations, and visualize results. You can track your break-even point in real time and test different scenarios with just a few clicks.