Dashboard
How to Choose the Right Asset Management Dashboard for Your Business in 2026
Lewis Chou
Mar 23, 2026
Finding the right asset management dashboard in 2026 is not just about cool features. First, think about what your business wants to do. Think about the assets you use each day. Ask if the dashboard can grow with your business. See if it works well with your team’s way of working. You need something you can change, that can get bigger, and does not cost too much. DAS Corporation had trouble with manual data and slow choices. They fixed this by picking a dashboard that matched their business. Remember to check security, rules, and if the dashboard works with your other systems.

Define Your Needs for Asset Management Dashboard
Identify Business Goals and Asset Types
Think about what you want your dashboard to do. Do you want to save time or money? Maybe you want to track assets better. Write down your main goals. Look at the assets you use. These can be equipment, vehicles, buildings, or digital assets. Each asset needs a different way to track it. For example, factories care about machines. Finance teams care about files and contracts. When you know your goals and assets, you can pick a dashboard that fits.
Gather Stakeholder Requirements
Talk to everyone who will use the dashboard. This helps you learn what they need. Try these ways to get their ideas: One-on-one interviews, surveys, focus groups, workshops, Field observations, use case scenarios, brainstorming sessions. Ask questions like, “What do you need to see?” or “How do you want to track assets?” If you include your team early, the dashboard will work for everyone.
Map Current Challenges and Desired Outcomes
Look at the problems you have now before picking a dashboard. Many businesses face issues like:
| Operational Challenge | Description |
|---|---|
| Fragmented operational data | Data is spread out and hard to look at. |
| Limited visibility into performance | It is hard to see how assets are doing. |
| Delayed responses to maintenance | Problems take too long to fix. |
| Inconsistent reporting | Reports are not always the same. |
Think about what you want to change. Maybe you want updates right away. Maybe you want better tracking or reports you can trust. DAS Corporation fixed slow data by choosing a dashboard that fit their needs. When you know your problems and goals, you can find the best dashboard.
Essential Features for Asset Management Dashboard
Picking the right asset management dashboard means you need to find features that help your business most. You want a tool that helps you keep track of assets, make reports, and do tasks automatically. You also need to think about safety, following rules, how well it works with other systems, and if it can grow with your company. Let’s see what you should look for.
Tracking, Reporting, and Automation
You need to know where your assets are and how they work. The best asset management dashboard gives you updates right away and makes tracking simple. You can see everything in one spot, so you can make good choices fast. Here is a quick look at the main things you should get:
| Feature | Description |
|---|---|
| Real-Time Asset Visibility | See your assets everywhere with live updates. |
| Smart Inventory Management | Automate inventory so you always know what you have and avoid mistakes. |
| Centralized Asset Management | Keep all your asset data together for one true source. |
| Automation & Reporting | Do less work by hand and make fewer mistakes with automatic reports and workflows. |
FineReport is great here. You get dashboards that update right away, so you always know what is happening. You can change your dashboard to show the KPIs you care about most. This helps you track how things are going, find problems, and act fast. Automation in asset tracking software saves you time and keeps your data right.
Security and Compliance Considerations
Security and compliance are very important. You want your asset management dashboard to keep your data safe and help you follow the rules. Many jobs, like finance and healthcare, have strict rules. Here are some of the main frameworks you might see:
| Standard/Framework | Description |
|---|---|
| NIST Cybersecurity Framework | Helps you handle cybersecurity risks. |
| ISO 27001 | Sets rules for keeping information safe. |
| PCI DSS | Protects credit card data. |
| HIPAA | Keeps health information private. |
| SOC 2 Type II | Checks if your systems and controls work well over time. |
A good dashboard lets you see if you are following the rules in real time. You can spot risks and problems as they happen. Automatic evidence collection makes audits easier. You can control who sees what with special access. FineReport’s platform helps you manage safety and rules with strong user controls and data permissions. You can also check compliance numbers and make reports that fit the law.
Integration with Business Dashboards and Systems
You probably use other tools like ERP or CRM systems. Your asset management dashboard should connect with these easily. This way, you do not have to type data twice or switch between apps. Integration is a main feature that saves time and stops mistakes. FineReport makes this easy with built-in connectors for over 500 data sources. You can bring in data from different places and see everything in one business dashboard. This all-in-one view helps you make better choices and keeps your team working together.
Scalability and Customization
Your business will grow and change. You need an asset management dashboard that can grow with you. Scalability means the dashboard can handle more assets and users without slowing down. Customization lets you set up the dashboard the way you want. You can add widgets, change layouts, and focus on the data that matters most to you.
- Customization helps you see the information you need, your way.
- Scalability means you won’t outgrow your dashboard, even as your asset list gets bigger.
FineReport gives you both. You can build dashboards with drag-and-drop tools and change them as your needs change. The system can handle lots of data, so you do not have to worry about it slowing down.
Usability and Mobile Access
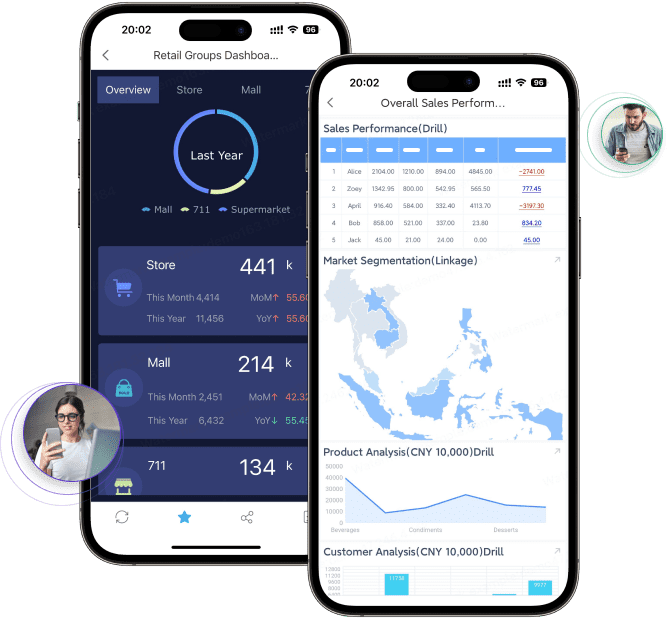
You want a dashboard that is easy to use. A simple interface means you spend less time learning and more time working. Mobile access is also important. You might need to check asset data on your phone or tablet, especially if you are not at your desk.
| Feature | Description |
|---|---|
| User-friendly interface | Easy to use and manage assets. |
| Mobile applications | Use the dashboard on Android or iOS, with features like barcode scanning for quick updates. |
| Comprehensive support | Get help anytime with 24/7 support. |
| Mobile auditing | Check assets on the go with your mobile device. |
FineReport’s mobile dashboards let you track assets, make reports, and even enter data from anywhere. You can change the mobile view, so you always see what matters most. This makes asset tracking software more flexible and useful.
When you focus on these features, your business will do better. The right asset management dashboard helps you track assets, stay safe, connect your systems, and grow with confidence.
Checklist for Selecting Asset Management Dashboard Software
Picking asset management software can seem hard at first. But using a checklist makes it much easier to handle. You want software that fits your business and helps your team. It should also be able to grow as your business gets bigger. Let’s look at what you should check when picking asset management software.
Vendor Reputation and Support (FanRuan)
First, check if the vendor is trusted. You want a company that helps you when you need it. Look for companies with good reviews and a strong history. FanRuan and FineReport are good examples. They have helped many businesses, like DAS Corporation, fix data problems. They give fast support, regular updates, and work in many countries. If you pick a vendor with a good name, you will feel safe and get help if something breaks.
Here’s a table to help you compare vendors:
| Criteria | Description |
|---|---|
| Vendor Reputation and Support | Check customer reviews and make sure you can get help fast. |
| Features | Look for ways to change the dashboard, connect data, and see information easily. |
| Security Measures | Make sure your data is safe with encryption and access controls. |
| Implementation Process | Plan for training and moving your data so things go smoothly. |
Tip: Pick software from vendors who help you and have done well in your field.
Transparent Pricing and Cost-Effectiveness
You need to know what you are paying for. Clear pricing helps you plan and stops surprises. Some tools, like ServiceNow, give custom prices for your needs. Others, like ManageEngine AssetExplorer, show prices based on how many assets you have. Always ask for a full price list.
| Software Solution | Pricing Model Description |
|---|---|
| ServiceNow | Custom prices based on your business size and what you need. You talk to them to get a quote. |
| ManageEngine AssetExplorer | Free for up to 25 assets, trial for 30 days with up to 250 assets, and paid plans for more. The total cost depends on how you use it. |
When thinking about cost, look at more than just the price. Think about these things:
- Does the software help you save money by tracking assets?
- Can you make reports to find ways to save?
- Is it easy to use so your team learns fast?
- Will it work as your business grows, so you do not need to buy new software soon?
Here’s a table to help you check cost-effectiveness:
| Feature | Benefit |
|---|---|
| Reporting | Makes reports to track how you use assets and licenses, helping you manage costs. |
| Cost Optimization | Finds ways to save money and makes work faster. |
| Ease of Use | Easy dashboards help your team start quickly and work better. |
| Scalability | Flexible prices and can handle more users as you grow. |
| Security | Keeps your data safe and follows rules for asset management. |
User Roles and Accessibility
A good dashboard lets everyone do their job safely and easily. You need to control who can see and change things. This keeps your data safe and helps you follow the rules. Look for things like role-based access, audit trails, and quick onboarding.
| Feature | Description |
|---|---|
| Continuous Monitoring | Checks who can do what and finds mistakes in permissions. |
| Audit-Ready Compliance | Makes audit trails that show if you follow the rules. |
| Just-in-Time Access | Gives short-term access to keep things safe but not slow down work. |
| Enhanced Visibility | Lets you see and control who can do what at all times. |
| Fast Onboarding and Discovery | Shows roles and permissions quickly for new users. |
| Automated JIT Access | Gives time-limited access and removes it right away when needed. |
| Auditor-Ready Evidence | Makes proof for audits and shows when access is removed. |
| Granular Usage Intelligence | Shows what features people use, not just when they log in. |
| No-Code Workflow Automation | Lets you set up workflows for giving and checking access without coding. |
FineReport makes it simple to set up who can do what. You can give each person the right access, watch what they do, and keep important data safe. This makes your software secure and ready for audits.
Testing with Real Workflows
Before using new software everywhere, test it with real tasks. This helps you see if it works for your needs and data. Here’s a checklist to help you test:
- Pick where to start, like a location or team.
- Make sure asset names and fields are the same.
- Clean up your old data before moving it.
- Set up asset states, like in use or retired.
- Add fields for who owns each asset.
- Set up ways to find assets automatically.
- Set roles and permissions for each team.
- Decide what reports and dashboards you need.
- Check if it works with your other tools.
- Try a small test before using it everywhere.
Pro Tip: Use this test phase to find problems early. Fixing them now is easier than fixing them later.
Your Complete Checklist
Here’s a checklist to help you pick asset management software. Use it to compare choices and make sure you do not miss anything:
| Checklist Item | Why It Matters |
|---|---|
| Vendor reputation and support | Good vendors like FineReport give strong help and proven tools. |
| Transparent pricing | Clear prices help you plan and avoid hidden costs. |
| Cost-effectiveness | The software should help you save money and use assets better. |
| Customization and scalability | You need software that grows and changes with your business. |
| Security and compliance | Keep your data safe and follow the rules. |
| Integration capabilities | Connect with your other systems for smooth work. |
| User roles and accessibility | Control who can see and change data, and make it easy to start. |
| Real workflow testing | Test the software with real tasks to make sure it fits. |
| Reporting and analytics | Get information about how you use assets and how they perform. |
| Ongoing support and updates | Pick a vendor who keeps making the product better and helps you when needed. |
If you follow this checklist, you can feel sure you are picking the best software. The right choice will help you manage assets, control spending, and use your assets better for a long time.
Implementation and Growth in Asset Management Dashboard
Matching Dashboard Capabilities to Business Needs
Your dashboard should help you reach your business goals. First, think about how you keep track of asset work. The dashboard should let you log asset use from any place. Mobile access lets your team stay in touch. Cloud-based systems are fast to set up and easy to change. Standard rules help keep everything neat and organized. Risk management helps you find problems before they get big. Preventative maintenance lets you watch for downtime and keep assets working. Real-time data helps you make quick and smart choices. You can follow assets from the start to the end of their life. Here is a table with some best ways to do this:
| Best Practice | Description |
|---|---|
| Mobile Access and Optimization | Team members log asset use and maintenance from anywhere. |
| Streamlined Implementation | Cloud-based systems deploy quickly and customize easily. |
| Standardization | Guidelines for maintenance and compliance keep things organized. |
| Risk Management | Spot hazards early and manage risks. |
| Preventative Maintenance | Monitor downtime and check critical assets often. |
| Expansive Data Capture and Integration | Real-time asset data improves decisions and efficiency. |
| Asset Lifecycle Tracking | Track assets from start to finish for better management. |
FineReport gives you tools to track asset work and change dashboards for your needs. DAS Corporation used FineReport to connect offices around the world and make asset tracking better. Their dashboard matched their business and helped them grow.
Ensuring Security and Compliance
Security is very important when using a dashboard. You should connect systems like vulnerability scanners to keep your data the same everywhere. Pick numbers that show how fast you fix problems and if you follow the rules. Use heat maps and trend lines to make data easy to see. Set alerts for risks and rule problems. Change dashboards for each team so everyone sees what they need. Here is a quick list:
- Connect systems for the same data.
- Pick numbers for security and rules.
- Use clear pictures for easy data.
- Set alerts for risks.
- Change dashboards for each group.
You can stop data problems by using tools that find assets automatically. SOAR platforms help make data from different places the same. Share dashboard results in simple business words to get leaders to help. FineReport helps you keep data safe and follow rules with strong controls and easy reports.
Planning for Future Scalability
Your dashboard should grow as your business gets bigger. Make sure it matches your goals. Use cloud tools and good data pipelines to handle more data. Focus on making dashboards easy and fun to use with clear pictures and things you can click. Automate checks to watch how things work. Treat your dashboard as something that can change over time. Modular ETL pipelines help you change workflows easily. Version control keeps updates in order. Make dashboards faster with query tuning and caching. Cloud data warehouses give you more space as you need it. Design dashboards to be clear and easy for everyone. Here is a table with some good ideas:
| Strategy | Description |
|---|---|
| Align with Business Goals | Dashboards support your strategic objectives. |
| Scalable Data Pipelines | Cloud tools and ETL best practices handle data efficiently. |
| User Experience Focus | Clear, interactive visuals engage users. |
| Automate Monitoring | Systems track performance and usage automatically. |
| Iterative Improvement | Dashboards adapt to changing needs. |
| Modular ETL Pipelines | Reusable components make workflows flexible. |
| Version Control | Tools manage updates and changes. |
| Performance Optimization | Query tuning and caching enhance dashboard speed. |
| Cloud-Native Data Warehouses | Platforms provide scalable storage solutions. |
| Design Principles | Clarity, consistency, and accessibility guide dashboard design. |
FineReport helps you grow with strong pipelines, good integration, and dashboards that are easy to use. You can track asset work, make dashboards better for users, and be sure your dashboard fits your business as it gets bigger.
You can make better choices if you follow these steps. When you pick dashboard features that fit your goals, you avoid big problems and track how things are going. Using an asset management platform like FineReport makes it easier to use and helps you watch important numbers and kpis. Real stories show how dashboards change data into useful ideas. Checklists help you keep asset lists the same and make reports you can trust. Watching your assets all the time helps your business grow and do well for a long time.


FAQ

The Author
Lewis Chou
Senior Data Analyst at FanRuan
Related Articles

Portfolio Reporting for PMOs: 9 Executive Metrics Every Weekly Portfolio Dashboard Should Include
Weekly portfolio reporting should help executives answer three questions fast: Are we delivering the right initiatives, are we putting outcomes at risk, and what decisions need leadership this week? For PMOs, that means
Yida Yin
Jul 01, 2026

How to Build an Investment Portfolio Reporting Dashboard for Executives: KPIs, Benchmarks, and Drill-Down Views
Investment portfolio reporting for executives is not about showing every holding, transaction, and chart your investment team can produce. It is about giving CEOs, CFOs, CIOs, boards, and investment committees a fast, re
Yida YIn
Jun 25, 2026

12 KPI Reporting Examples for Executive Dashboards: What to Show in Weekly, Monthly, and Quarterly Reviews
Executive leaders do not need more data. They need decision ready $1 examples that match how often they review the business and what actions they are expected to take. A weekly $1 should surface fast moving risks and per
Yida YIn
Jun 25, 2026