The repurchase rate shows how many customers return to buy again. Use this simple formula: number of customers who made more than one purchase divided by total customers in a set period. For instance, if 375 out of 1,000 customers made repeat purchases in a year, the repurchase rate is 37.5%. Tracking this number matters. Brands see higher repeat purchases and stronger loyalty when they focus on the repurchase rate.FineBI from FanRuan helps automate these insights, so businesses can see real growth. Now might be the time to look at your data and see what your customers reveal.
Repurchase Rate Basics
What Is Repurchase Rate
The repurchase rate tells a business how many customers come back to buy again after their first purchase. This metric focuses on a specific group, or cohort, of customers who made a purchase in a certain period. Over time, the business tracks how many of these customers return for repeat purchases.
To understand how the repurchase rate compares to other metrics, take a look at this table:
Metric
Definition & Focus
Measurement Approach
Key Characteristics & Use Cases
Customer Repurchase Rate
Measures how many customers from a specific cohort come back for subsequent purchases over time.
Tracks cumulative repurchases month over month by cohort.
Cumulative metric; percentage increases or plateaus over time; useful for replenishable products; focuses on cohorts.
Repeat Purchase Rate
Percentage of customers who make more than one purchase within a specific timeframe, including new customers.
Calculated over a set period; includes new customers.
Snapshot metric; indicates customer loyalty; used to tailor marketing and cross-sells.
Percentage of customers retained over time, defined as those continuing to make purchases in subsequent months.
Measured month over month; changes as customers churn or remain active.
Dynamic metric; decreases when customers churn; indicates overall retention health.
Customer Lifetime Value (LTV)
Total value a customer brings over their entire relationship with the business.
Calculated based on revenue, retention, and repurchase behavior.
Broader financial metric; influenced by retention and repurchase; used for profitability analysis.
The repurchase rate stands out becauseit focuses on how many customers from a starting group keep coming back, rather than just looking at all customers in a single period.
A high repurchase rate means customers like what they buy and trust the business. When customers return for repeat purchases, the business spends less on finding new buyers. In fact, keeping existing customers can cost five to seven times less than getting new ones.
Did you know? A 5% increase in customer retention can boost profits by up to 75%. Loyal customers often spend more over time, and 61% of small and medium businesses say most of their revenue comes from repeat customers.
Tracking the customer repurchase rate helps a business spot loyal customers and predict future sales. It also shows if products meet customer needs. When a business focuses on increasing its repurchase rate, it builds stronger relationships and creates steady, predictable revenue. Personalizing marketing based on repurchase behavior makes customers feel valued and encourages them to return.
For any business, the repurchase rate is a key sign of long-term growth and stability.
Calculate Customer Repurchase Rate
Repurchase Rate Formula
The repurchase rate measures how many customers come back to buy again. Businesses use a simple formula to find this number:
Repurchase Rate (%) = (Number of Repeat Customers / Total Number of Customers) × 100
This formula helps companies see what percentage of their customers return for another purchase. It works best when applied to a specific time frame, such as a month, quarter, or year. By using this formula, businesses can track loyalty and spot trends over time.
Step-by-Step Guide
To calculate customer repurchase rate with real business data, companies follow a few clear steps:
Choose a Time Frame Pick a period to analyze, like the last quarter or year. Consistency in time frames helps when comparing results.
Count Total Customers Find the total number of unique customers who made a purchase during that period. Make sure to count each customer only once.
Identify Repeat Customers Look for customers who made more than one purchase in the chosen time frame. These are your repeat customers.
Apply the Formula Divide the number of repeat customers by the total number of customers. Multiply the result by 100 to get the repurchase rate as a percentage.
For example, imagine a business had 2,000 customers in April. Out of those, 400 made a second purchase by June. The repurchase rate would be:
Repurchase Rate = (400 / 2,000) × 100 = 20%
This means 20% of customers returned for another purchase. Tracking this number helps companies understand loyalty and make better decisions.
Tip: Always use accurate and up-to-date data. Clean customer records help avoid mistakes. Define your time frame clearly and stick to it for each analysis.
Many businesses face challenges when they try to calculate customer repurchase rate. They might struggle with messy data, double-counting customers, or tracking purchases across different systems. Manual calculations can take a lot of time and may lead to errors.
FineBI from FanRuan solves these problems by automating the process. FineBIconnects to over 60 types of data sources, including databases, cloud warehouses, and even Excel files. It brings all customer data together in one place. With FineBI, users can:
Integrate Data Easily FineBI pulls customer and sales data from multiple sources. This ensures every purchase and customer is counted correctly.
Clean and Prepare Data The platform offers tools to clean up records, remove duplicates, and standardize customer information. This step is key for reliable repurchase rate calculations.
Automate Calculations Users can set up self-service dashboards that automatically calculate the repurchase rate for any time frame. FineBI updates these numbers in real time as new data comes in.
Visualize Results FineBI turns raw numbers into easy-to-read charts and graphs. Teams can spot trends, compare periods, and segment customers by product or region.
Ensure Accuracy and Consistency FineBI helps businesses define unique customers, avoid double-counting, and keep time frames consistent. This leads to more trustworthy results.
FineBI makes it simple for anyone—whether a business analyst or a manager—to track customer repurchase rate without needing advanced technical skills. By automating the process, companies save time and reduce errors, letting them focus on building loyalty and growing their business.
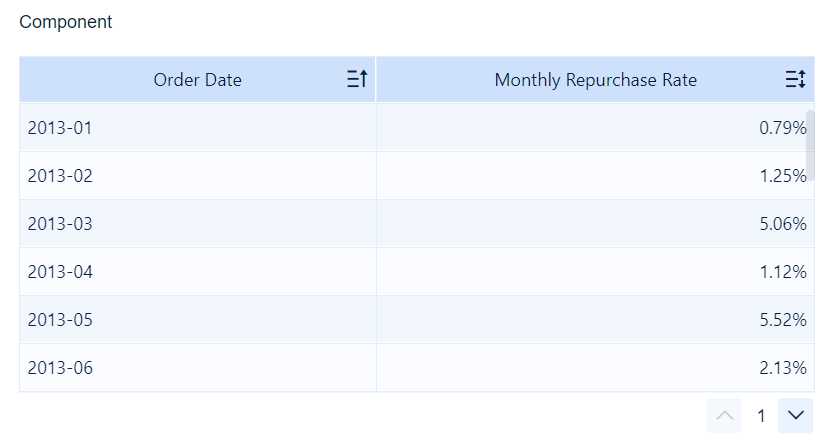
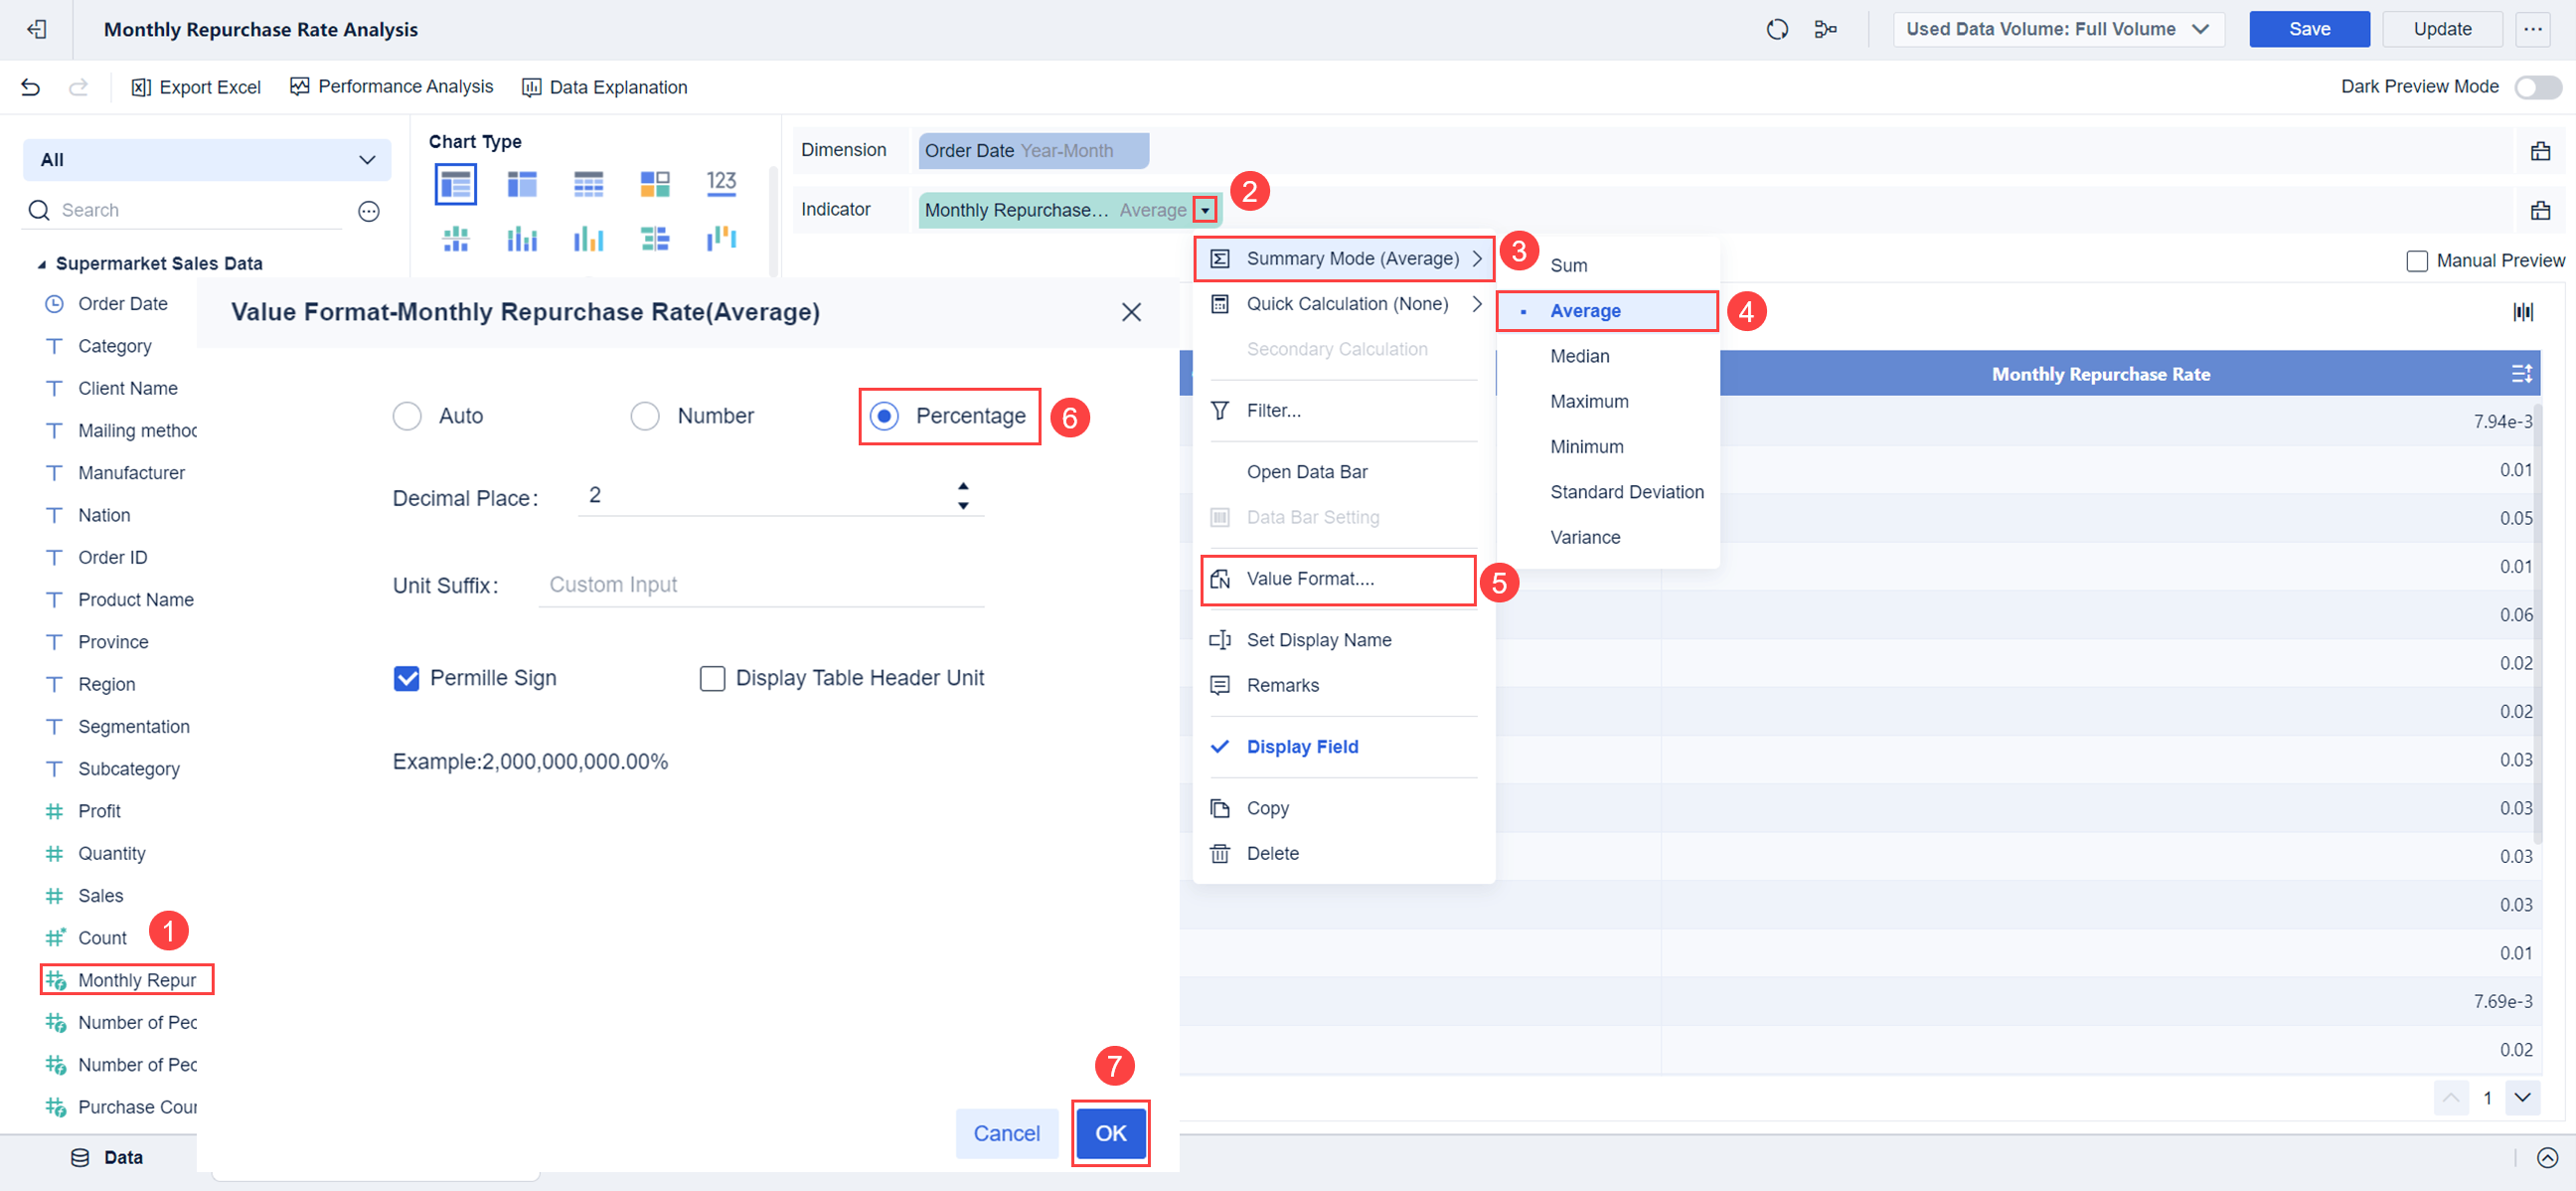
Calculate Monthly Repurchase Rate with FineBI
For more information about how to calculate repurchase rate, refer to the Help Document.
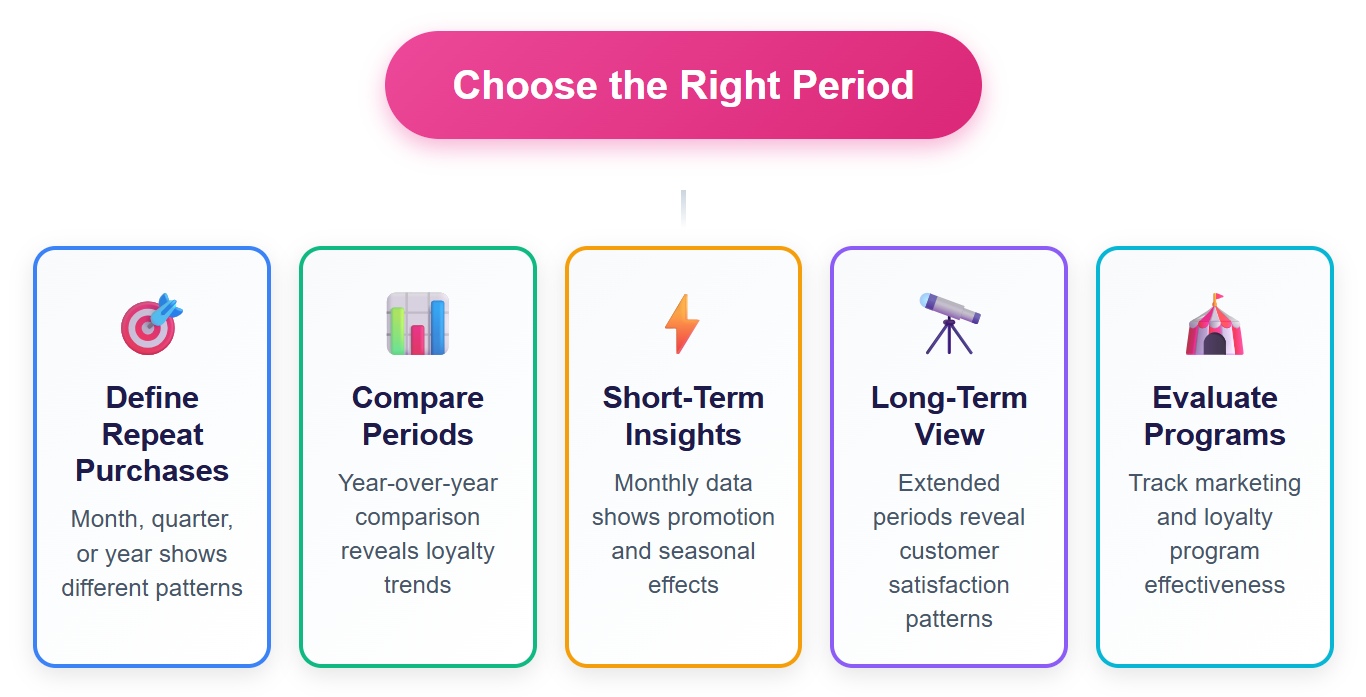
Selecting the right period is the first step when businesses want to analyze customer repurchase rate. The timeframe sets the stage for how companies count unique customers and their purchases. This choice can change the story the numbers tell. Here are some things to consider:
The timeframe determines which purchases count as repeats. A month, quarter, or year will each show different patterns.
Comparing repurchase rate across different periods, like this year versus last year, helps spot trends in customer loyalty.
Shorter timeframes, such as a single month, can reveal the effects of special promotions or seasonal changes.
Longer timeframes give a bigger picture of customer satisfaction and retention.
Picking the right period helps businesses see if their marketing or loyalty programs work over time.
A well-chosen timeframe lets companies track how often customers return and helps them make smart decisions about future campaigns.
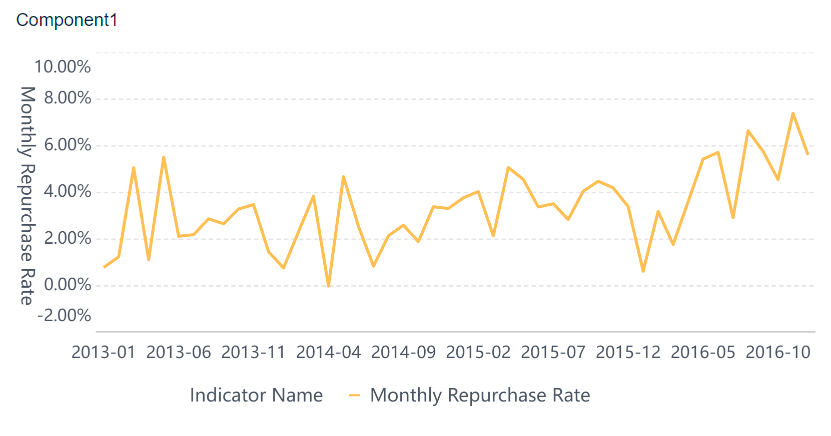
Interpret Results with FineBI
Once the timeframe is set, FineBI makes it easy to analyze customer repurchase rate. FineBI dashboards bring all the important data together. Teams can see how the repurchase rate changes over time and break down results by product, region, or customer segment.
Spot trends in customer behavior with clear charts and graphs.
Segment customers to see which groups have the highest repurchase rate.
Compare results from different timeframes to measure the impact of new strategies.
Drill down into the data to find out what drives repeat purchases.
FineBI’s visual tools help everyone on the team understand the numbers. This makes it simple to analyze customer repurchase rate and take action to improve loyalty. Companies can quickly see what works and adjust their approach to keep customers coming back.
What Is a Good Repurchase Rate
Industry Benchmarks
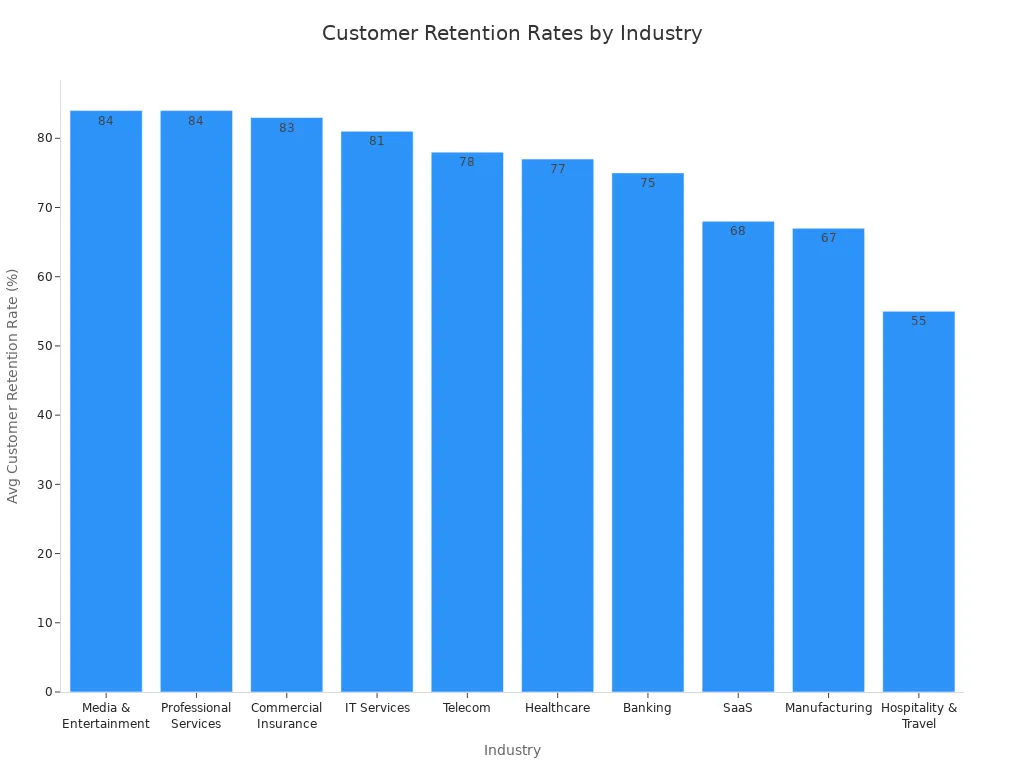
Many business owners wonder, “What is a good repurchase rate?” The answer depends on the industry. A good repurchase rate in one field might be average in another. For example, companies in media and professional services often see a good repurchase rate above 80%. In hospitality, a good repurchase rate is much lower, closer to 55%. The table below shows how the average customer retention rate, which closely matches the customer repurchase rate, varies by industry:
Industry
Average Customer Retention Rate (CRR)
Variation from Overall Average (75%)
Media & Entertainment
84%
+9%
Professional Services
84%
+9%
Commercial Insurance
83%
+8%
IT Services
81%
+6%
Telecom
78%
+3%
Healthcare
77%
+2%
Banking
75%
Even
SaaS
68%
-7%
Manufacturing
67%
-8%
Hospitality & Travel
55%
-20%
Reliable sources like AMP and Mobiloud collect and share these benchmarks. They use data from many businesses and break it down by product type and industry. This helps companies compare their own customer repurchase rate to others in the same field. When a business matches or beats the average, it can feel confident about its retention strategy.
Influencing Factors
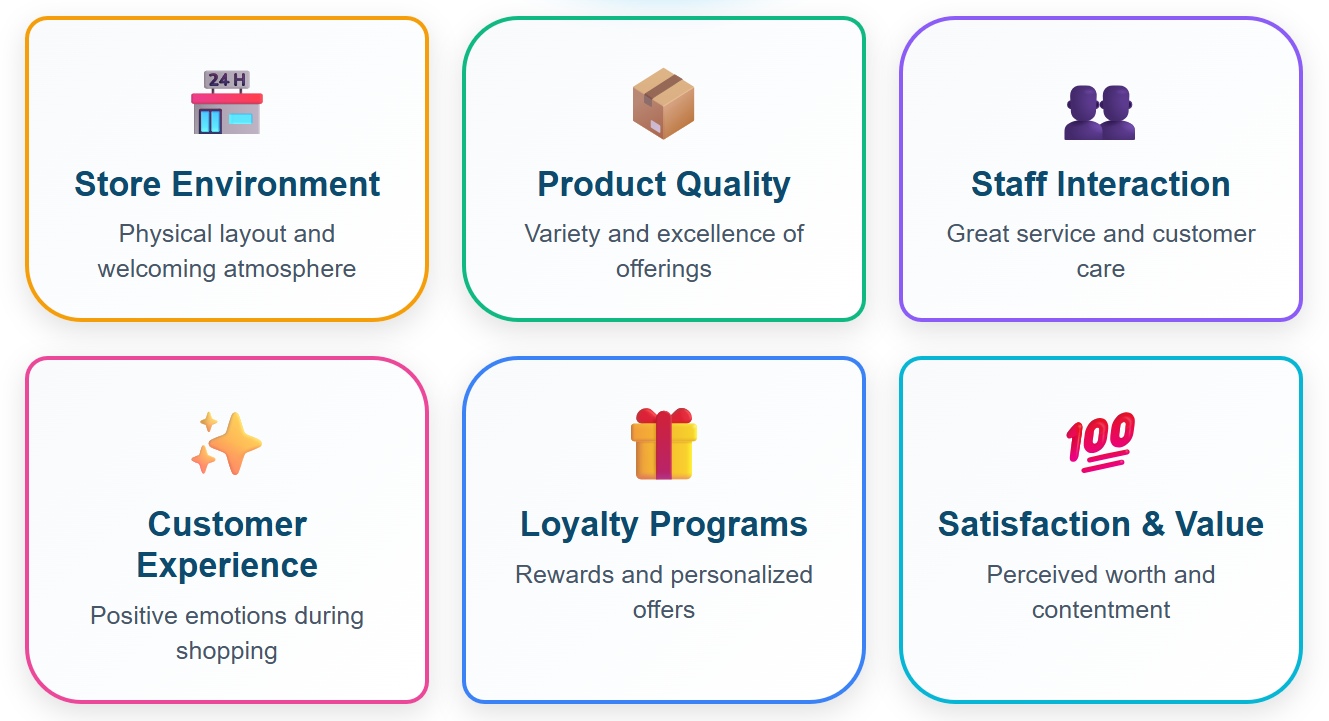
A good repurchase rate does not happen by accident. Many factors shape whether customers come back. Some of the most important include:
The shop’s physical environment and layout
The quality and variety of products
How staff interact with customers
The overall customer experience and emotions during shopping
Loyalty programs and personalized offers
Customer satisfaction and perceived value
These factors work together. For example, a high repurchase rate often comes from a store that feels welcoming and offers great service. Businesses that focus on customer experience and satisfaction usually see a higher customer repurchase rate. A strong retention strategy, like a rewards program, can also boost the retention rate and help keep customers coming back.
Tip: Companies should track their own good repurchase rate over time and look for ways to improve. Even small changes in service or product quality can make a big difference.
Increase Customer Repurchase Rate
Loyalty Programs
Loyalty programs give customers reasons to come back. These programs offer rewards like discounts, points, and exclusive deals. Many shoppers enjoy faster checkout and special offers, which makes them feel valued. Studies show that when customers use loyalty cards often, they are more likely to buy again. Satisfaction with benefits such as discounts and point accumulation leads to higher customer retention and positive word-of-mouth. Businesses that tailor loyalty rewards to customer preferences see even better results.
Here are some popular types of loyalty programs and why they work:
Loyalty Program Type
Key Features & Benefits
Examples
Why Effective for Boosting Repurchase Rate
Paid Membership Programs
Exclusive perks for a fee, strong relationships
Amazon Prime, Walmart+
Builds loyalty and encourages repeat purchases
Cashback Programs
Simple cash or credit back on purchases
N/A
Direct financial incentive for repeat buying
Gamified Loyalty Programs
Fun challenges, rewards for engagement
Starbucks Rewards, Nike Run Club
Increases engagement and shopping frequency
Omnichannel Loyalty Programs
Unified rewards across online and offline
Sephora Beauty Insider, Target
Seamless experience, higher lifetime value
Points-Based Programs
Earn and redeem points, tiered rewards
CVS ExtraCare, Walgreens
Easy to understand, motivates customers to return
Value-Based Programs
Supports causes, builds emotional connection
TOMS Shoes, Patagonia
Appeals to values, deepens loyalty
Loyalty programs that match customer needs help businesses improve repurchase rate and build a strong retention strategy.
Personalized Marketing
Personalized marketing uses customer data to create messages and offers that fit each shopper. Companies look at purchase history, online behavior, and even social media activity. This approach increases customer engagement and satisfaction. For example, Amazon’s product recommendations drive about 35% of their sales. Research shows that 91% of shoppers prefer brands that offer relevant deals, which leads to a higher repurchase rate.
To improve repurchase rate and customer retention, businesses can follow these best practices:
Use customer data to personalize content and offers.
Track success with metrics like repeat purchase rate and customer retention rate.
Personalized marketing helps companies connect with customers and increase customer engagement, making it easier to improve customer retention.
Enhance Experience with FineBI
FineBI gives businesses the tools to increase customer repurchase rate by making data easy to use. FineBI connects to many data sources and brings all customer information together. Teams can track repurchase rate and customer retention rate in real time. FineBI’s dashboards let users segment customers, spot trends, and measure the impact of loyalty programs or marketing campaigns.
Smarter product, pricing, and inventory management across retail sectors.
FAQ
What is the difference between repurchase rate and retention rate?
Repurchase rate tracks how many customers buy again. Retention rate measures how many customers stay active over time. Both show loyalty, but they focus on different customer actions.
How often should a business check its repurchase rate?
Most businesses review repurchase rate monthly or quarterly. Regular checks help spot trends and react quickly to changes in customer behavior.
Can FineBI handle data from multiple sales channels?
Yes! FineBI connects to online stores, physical shops, and third-party platforms. It brings all sales data together for a complete view of customer behavior.
What should a business do if its repurchase rate drops?
First, check for changes in product quality, service, or customer experience. Then, use FineBI to analyze customer feedback and spot issues. Quick action helps win back customers.