You use an apm dashboard to track the health and performance of your applications in real time. This tool helps you spot issues quickly and make smarter decisions. In 2026, the adoption of these dashboards continues to rise as shown below:
Year
Market Size (in billion USD)
CAGR (%)
2025
10.7
-
2026
12.06
12.6
2030
20.19
13.8
FineReport lets you visualize performance data and take action with ease.
What is an APM dashboard?
Definition and Purpose
An apm dashboard is a tool that shows how your apps are doing right now. You use it to watch important numbers, find problems, and make fast choices. This tool changes hard data into easy charts and graphs. You can set alerts to tell you if something is wrong. The apm dashboard helps you find out why there is a problem fast, so you can fix it before users see it.
You will see that an apm dashboard gives your group many good things:
It lets you watch how your app works and spot problems fast.
You can set limits and alerts to find trouble early.
The dashboard shows you details to help you know what caused slowdowns or mistakes.
It turns raw data into clear numbers and patterns, so you can fix things easier.
You can find and fix problems faster because you can see more.
With these tools, you can use data to make better choices and keep your users happy. FanRuan-en and its FineReport tool are leaders in showing data and watching how things work. FineReport lets you make your own dashboards that show just what you need. You can connect to lots of data and see it all in one spot.
Role in Application Performance Monitoring
The apm dashboard is very important for watching how your apps work. You use it to check your apps every second. It gives you real-time info, so you always know if things are okay. You can make your own numbers to watch what matters most to you.
You will see all your key numbers, like uptime and response times, in one place. The apm dashboard sends alerts if something is wrong. You can find errors or slowdowns before they hurt your users. This helps you fix things fast and keep your apps running well.
In 2026, watching how apps work is more important than ever. Apps are harder to manage now, and you need tools that show you everything clearly. The apm dashboard helps you find slow spots and fix problems in many systems. You can use it to find out what caused a problem and make sure every part of your app works together.
FineReport by FanRuan-en helps with these jobs. It lets you build dashboards that fit how you work. You can use it to watch performance, set alerts, and look at details. This makes it easier to manage your apps and give your users a great experience.
How APM dashboards work
Core Components and Data Flow
It is important to know what is inside a modern APM dashboard. In 2026, these dashboards use smart parts to help you see everything about your apps. Here is a table that lists the main parts and what they do:
Component
Description
Right-sized monitoring
Focuses on the most important workloads for your business.
Unified monitoring frameworks
Combines data from your app, network, and servers in one place.
Data efficiency by design
Keeps only the data you need, saving space and money.
Cloud and vendor neutrality
Works with any cloud or system you use.
Operational simplicity
Uses automation to make setup and use easy.
Distributed tracing
Tracks requests across all your microservices to find slow spots.
Kubernetes and container awareness
Watches your containers and services as they change.
OpenTelemetry standard adoption
Collects data in a way that works with many tools.
AI-assisted root cause analysis
Uses machine learning to find problems fast.
Full observability capabilities
Shows you metrics, logs, and traces together for a full view.
Scalability
Grows with your data and needs.
Pricing transparency
Makes costs clear and easy to understand.
Alert noise reduction
Sends only important alerts, not too many.
Human element
Lets your team build and use dashboards easily.
First, you add agents or code hooks to your app. These tools collect data like response time and errors. The data goes to the dashboard system. There, it gets sorted and checked. The dashboard shows you what is happening right now. FineReport connects to many data sources. You can see all your information in one spot. This helps you act fast when you see a problem.
Metrics and Visualization
You watch many metrics to keep your apps healthy. Here are the most common ones you will see:
Error Rates
Response time
Throughput
Resource Usage (CPU & Memory)
Request Rate
User Satisfaction (Apdex Score)
Churn Rate
Session Duration
Conversion Rate
Uptime (Application Availability)
Database Query Performance
Garbage Collection (GC) Time
Retention Rate
Session Length
Network Latency
You use response time to check how fast your app answers users. If response time gets higher, something is wrong. You also watch error rates and throughput to find problems early.
FineReport gives you many ways to see your real-time data. You can use HTML5 charts, third-party widgets like ECharts, or even 3D charts for a better look. The dashboard lets you drag and drop charts, tables, and graphs. You can build views that show response time, errors, and more. This makes it easy to find and fix problems before users notice.
AI and automation make monitoring easier and faster. AI finds problems before they get big. It looks at your data right away and sees patterns you might not notice. Automation does simple jobs for you, so you do not have to do them all. Here is how AI-powered features help you:
Core Features of AI-Powered APM
Advantages of AI in APM
Real-Time Data Analysis
Improved User Experience
Predictive Analytics
Operational Efficiency
Automated Detection & Resolution
Cost Savings
Dynamic Baselines
Scalability
Dashboards in 2026 use automation to help you act fast. You get alerts with links that show what to do next. Some tools can fix problems by themselves. You can connect alerts to other systems without writing code. These features save time and keep your apps working well.
Cloud-Native and Integration with FineReport
Cloud-native support means your dashboard grows with you. You can watch apps that change size or move to new servers. This is important because cloud apps start and stop quickly. Old tools cannot keep up, but cloud-native dashboards handle these changes easily. You get better reliability and more choices.
FineReport gives you many ways to connect. You can use many data sources, APIs, and even put reports in your own apps. FineReport lets you add plugins for extra features. This makes it easy to fit the dashboard into your business.
Integration Option
Description
Multiple Data Sources
FineReport supports various data sources for seamless integration with enterprise systems.
APIs
Provides rich, open, and well-structured APIs for deeper integration and control.
Embedding Reports
Allows reports to be embedded in web applications for enhanced accessibility and usability.
Plugin Development
Supports development of plugins based on standard APIs, with a plugin store for user selection.
Customization and Mobile Access
You need a dashboard that works for your team. If you cannot change how it looks or works, your team may not use it. Customization lets you pick the charts, colors, and data you want. This helps everyone use the tool better.
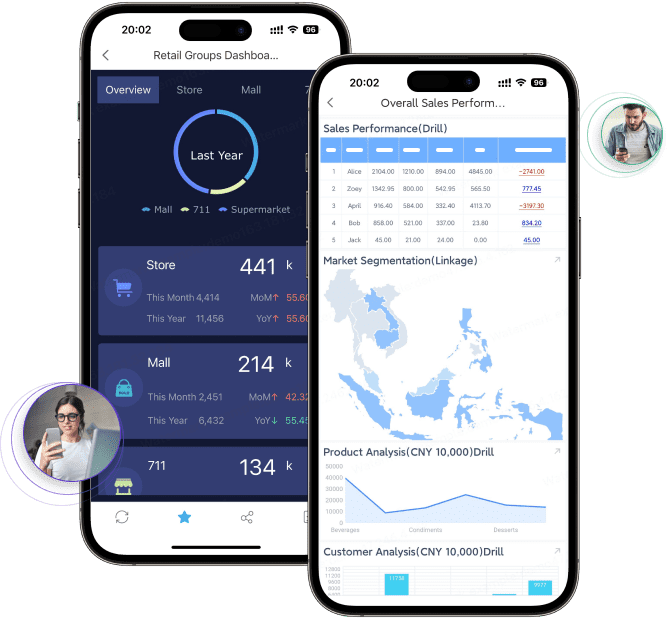
Mobile access is important too. You can check your data anywhere, even on your phone. This helps teams work together and make choices faster. Mobile dashboards give you real-time data, better teamwork, and more trust in your group.
Benefit
Description
Real-time access to data
Enables teams to access and analyze information instantly, facilitating timely decision-making.
Improved decision-making
Supports faster and more informed decisions, reducing reliance on subjective judgment.
Enhanced collaboration
Fosters trust and transparency across teams, improving overall teamwork and communication.
Operational efficiency
Streamlines processes, leading to better performance and increased revenue.
Benefits and use cases of APM dashboards
Real-World Performance Monitoring Scenarios
APM dashboards help you watch how your apps work right now. You can see problems before users notice them. You look at numbers like error rate, latency, and response time. If you see these numbers go up, you know something is wrong. The dashboard will send you alerts when there are problems. You can find out what is wrong fast and fix it. This keeps your apps working well and strong.
Here is a table that shows how APM dashboards help you have less downtime and work better:
Benefit
Description
Reduced Downtime
Predictive maintenance and better scheduling cut unplanned stoppages.
Data visibility reveals hidden capacity and energy savings.
Better Compliance and Safety
Risk-based approaches lower the likelihood of incidents.
You can see how your app is doing all the time. You get alerts and can spot strange things before users do.
Manufacturing and OEE Optimization with FineReport
In factories, you need to watch how apps work to keep machines running. FineReport gives you dashboards that show OEE and other important numbers. You can see error rate, latency, and how much you make in one place. You use these tools to find problems early and plan repairs. This means less downtime and better app performance.
FineReport lets you look at data from MES and other systems. You can track problems and make changes to work better. You see patterns in how your app works and use them to make things run smoother. You get real-time checks and alerts to keep your factory safe and busy.
Customer Success Story: BOE
BOE uses APM dashboards to watch app performance in many factories. You see KPI dashboards with error rate, latency, and production numbers. BOE made their apps better by using the same numbers and comparing across factories. You can find problems and fix them faster.
BOE saved 5% on inventory and worked 50% better. You use dashboards to compare how different places are doing. This helps you find hidden problems and make your apps work better. You make smarter choices with clear data and real-time info.
Tip: Use dashboards to watch app performance and find problems before they get big. This helps you keep things running and your users happy.
Choosing and implementing an APM dashboard
APM Dashboards vs. Other Monitoring Tools
You might ask how APM dashboards are different from other tools. Not all monitoring tools do the same job. Some tools only check if your servers are working. APM dashboards do more than that. They watch how your apps work and show you everything about their performance. You can see what users do in your apps and find problems early.
Here is a table that shows the main differences:
Traditional Monitoring
APM Tools
Monitors system health
Monitors application behavior
Provides limited context
Offers end-to-end visibility
Sends reactive alerts
Enables proactive issue detection
Lacks business insight
Analyzes business transactions
APM dashboards help you learn about your apps, not just your servers. You get alerts before problems get big. You also get helpful business data. This makes it easier to manage apps in today’s busy world.
Selecting the Right Solution (FanRuan-en, FineReport)
When picking an APM dashboard, think about what you need. Choose a tool that can watch all your apps, not just some. FineReport by FanRuan-en is special because it connects to many data sources and gives real-time updates. You can make dashboards that fit your team and business.
Ask yourself these questions:
Does the tool watch all your apps and services?
Can you change dashboards for each team?
Does it let you check data on your phone?
Can you connect to all your data easily?
Does it use automation and AI to fix problems faster?
FineReport has these features. You can watch, study, and act on your app data from anywhere. This helps your apps run well.
Best Practices for Implementation
You want your APM dashboard to work great from the start. Here are some tips:
Make dashboards for different people, like leaders and helpers.
Put the most important numbers at the top.
Use the same time on all charts to compare them.
Add notes for big things, like new updates or issues.
Keep charts simple so they are easy to read.
Set alerts based on goals, not just random numbers.
After you set up your dashboard, keep checking your data. Look at it often to find patterns and make your apps better. Share what you learn with your team. Always try to improve your monitoring.
You use APM dashboards to watch how your apps are doing. They help you find problems and make things work better. FineReport lets you see your data in easy ways and fix things quickly. When you use the newest dashboard tools, your users are happier. You have less downtime and can fix problems before they get big. New trends are changing how dashboards work. More people use mobile APM, smart analytics, and AI to watch apps. Cloud and digital changes make these updates happen. If you use these new tools, your apps work better than others.
Makes apps run better
Gives users a better experience
Helps you fix problems early
Cuts down on downtime
Helps your team work faster
Product Trial
FineReport
Pixel-perfect reports · Interactive dashboards · Easy data entry · Digital twins
Access a wealth of case studies, industry insights, and solution guides to accelerate digital transformation.
FAQ
What is an APM dashboard?
You use an APM dashboard to see how your apps work in real time. It shows important numbers like speed and errors. You can spot problems fast and fix them before users notice.
How does FineReport help with APM dashboards?
FineReport lets you connect to many data sources. You can build custom dashboards with drag-and-drop tools. You see all your app data in one place and act quickly.
Can I use APM dashboards on my phone?
Yes! You can check your dashboards on your phone or tablet. This helps you stay updated and make decisions anywhere.
What metrics should I watch on my APM dashboard?
You should watch: Response time,error rates, uptime, user satisfaction, resource usage. These numbers help you keep your apps healthy.