Data interpretation is the process of placing analytical results into business context — explaining what happened, why it happened, and what should be done next. While data analysis identifies patterns and correlations in datasets, interpretation assigns meaning to those findings within the specific operational, financial, or strategic environment where decisions are made.
In modern enterprises, interpretation is no longer a purely manual exercise performed by senior analysts. Agentic analytics platforms and AI data agents now assist teams in generating governed explanations, surfacing root causes, and activating decisions directly from trusted data. This guide covers the definition, practical business examples, a repeatable interpretation process, and how tools like FineBI and Dora support each stage.

What Is Data Interpretation?
Data interpretation is the process of transforming raw data into meaningful insights that guide decision-making. It involves examining datasets to uncover patterns, trends, and relationships that might not be immediately visible. The core purpose of data interpretation is to enable businesses to make informed decisions based on data-driven insights.
Modern enterprises rely on data interpretation to enhance decision-making, increase operational efficiency, and gain a competitive advantage. For example:
- Enhanced decision-making allows you to make choices backed by comprehensive data analytics.
- Increased operational efficiency comes from automating data processes, saving time and resources.
- Real-time insights help businesses adapt quickly to market changes.
However, defining data interpretation in today’s digital landscape comes with challenges:
- Over-reliance on one data source can lead to incomplete conclusions.
- Using outdated data may result in decisions that fail to align with current market dynamics.
- Ignoring external factors can skew the interpretation and affect outcomes.
By addressing these challenges, you can unlock the full potential of data interpretation and ensure your business strategies remain relevant and effective.
The Importance of Data Interpretation in 2026
Role of AI and Machine Learning in Data Interpretation
Artificial intelligence has revolutionized how you approach data interpretation. By automating data processing, AI enhances efficiency and accuracy, especially when dealing with unstructured data sources like text or images. Machine learning models, on the other hand, uncover complex patterns that traditional methods often miss. These technologies allow you to extract deeper insights from your data analysis efforts.
Natural Language Processing (NLP) plays a significant role in analyzing text-based data. For example, it can help you understand customer feedback or social media trends. AI tools also provide real-time insights, enabling you to make timely adjustments in your decision-making processes. This capability is crucial for industries like healthcare and finance, where time-sensitive decisions can have significant impacts.
Key benefits of AI and machine learning in data interpretation include:
- Automating data processing to save time and reduce errors.
- Using NLP to analyze text-based data for richer insights.
- Detecting hidden patterns within datasets through machine learning models.
- Delivering real-time insights for faster and more informed decision-making.
By leveraging these technologies, you can enhance the importance of data interpretation in your organization and stay ahead in a competitive landscape.
Predictive Analytics and Real-Time Decision-Making
Predictive analysis has become a cornerstone of modern data-driven decision-making. It allows you to forecast future trends by analyzing historical data, enabling proactive strategies. For instance, sales teams can use predictive analytics to identify dissatisfied clients early, reducing churn rates. Similarly, businesses can manage inventories more effectively by understanding past patterns.
The benefits of predictive analytics for real-time decision-making include:
Data Interpretation vs Data Analysis vs Data Visualization
These terms are frequently conflated. Clarity prevents misaligned tool selection and team expectations.
For more on AI-powered analytics tools spanning these capabilities, see Best AI Analytics Tools for Real-Time Data.
Examples of Data Interpretation in Business
Abstract definitions become concrete through real-world application. These examples illustrate how interpretation operates across common business scenarios.
Sales Drop Interpretation
Observation: Monthly recurring revenue declined 6% in June vs. May. Analysis: Cohort breakdown shows decline concentrated in mid-market segment; enterprise and SMB segments flat. Churn rate increased from 2.1% to 3.4%. Interpretation: Mid-market churn spike correlates with competitor's aggressive discounting campaign launched May 15. Exit interviews cite price sensitivity, not product dissatisfaction. Revenue impact: ~$180K/month if trend continues. Action: Revise mid-market pricing tier by July 10 (Owner: Pricing Manager). Equip sales team with competitive battle card by July 5 (Owner: Sales Enablement). Monitor weekly cohort retention through Q3.
Inventory Stockout Interpretation
Observation: SKU-4821 stockout events increased 3x in Week 26 vs. prior 4-week average. Analysis: Demand forecast accuracy dropped from 92% to 71% for this SKU. Supplier lead time extended from 14 to 22 days without notification. Safety stock parameter unchanged since last year. Interpretation: Stockouts caused by combination of demand surge (new retail partner onboarded) and uncommunicated supplier delay. Safety stock model assumes stable lead time; assumption no longer valid. Lost sales estimate: $45K in Week 26 alone. Action: Update safety stock parameters to reflect current lead time variability (Owner: Supply Planning, deadline: July 8). Initiate supplier performance review (Owner: Procurement, deadline: July 15). Flag similar SKUs with same supplier for proactive monitoring.
Churn Risk Interpretation
Observation: Predictive churn model flags 12 enterprise accounts as high-risk this month, up from 5 last month. Analysis: Top contributing factors: declining usage frequency (-40%), unresolved support tickets (>3 open >30 days), and NPS drop below 6. All 12 accounts share same customer success manager. Interpretation: Concentration risk suggests CSM capacity issue rather than product problem. Usage decline precedes ticket accumulation, indicating engagement erosion before support escalation. Historical pattern: accounts with this factor combination have 78% churn probability within 60 days without intervention. Action: Redistribute 4 accounts to backup CSM immediately (Owner: CS Director). Launch targeted re-engagement playbook for remaining 8 accounts by July 7. Review CSM-to-account ratio in next ops planning cycle.
Finance Variance Interpretation
Observation: Q2 operating expenses exceeded budget by 280K over) and travel (25K effective immediately (Owner: CFO). Renegotiate rates with emergency vendors or transition to contracted alternatives by August 1 (Owner: Procurement). Report process gap to audit committee in Q3.
Marketing Campaign Performance Interpretation
Observation: Q2 paid social campaign achieved 140% of lead volume target but only 65% of qualified opportunity target. Analysis: Lead-to-MQL conversion rate dropped from 38% to 19%. Form completion time decreased 40%, suggesting lower-friction form attracted lower-intent respondents. Cost per MQL increased 85% despite lower CPL. Interpretation: Campaign optimization for lead volume inadvertently sacrificed lead quality. Reduced form friction removed self-selection mechanism that previously filtered unqualified prospects. Net pipeline contribution is negative vs. plan despite headline lead metric success. Action: Restore qualifying questions to form by July 3 (Owner: Demand Gen). Shift bidding strategy from lead volume to MQL conversion (Owner: Paid Media). Recalibrate Q3 forecast to reflect corrected conversion assumptions.
Manufacturing Downtime Interpretation
Observation: Line B unplanned downtime totaled 18 hours in June, 3x monthly average. Analysis: Root cause logs show 14 hours attributed to motor bearing failures on Station 3. Maintenance records indicate bearings replaced at 90-day interval per OEM spec; failures occurred at Day 62, 68, and 71. Ambient temperature sensor data shows sustained +8°C above baseline during failure window. Interpretation: OEM maintenance interval assumes standard operating conditions. Elevated ambient temperature accelerates bearing wear beyond spec. Preventive maintenance schedule is correct for normal conditions but inadequate for current thermal environment. Production loss: 2,400 units (~$96K margin impact). Action: Reduce bearing replacement interval to 60 days pending engineering assessment (Owner: Maintenance Lead, effective immediately). Install additional cooling at Station 3 by July 20 (Owner: Facilities). Update PM calendar for all stations with similar thermal profiles by August 1.
Each example follows the same structure: observation → analysis → interpretation → action. Skipping interpretation leaves teams with accurate numbers but no shared understanding of what to do about them.
The Data Interpretation Process
Effective data interpretation follows a structured process that combines reliable data with business knowledge.

Step 1: Define the Business Question
Start with the decision, not the data. "What drove Q2 margin decline?" is a better starting point than "Show me Q2 financials." A well-defined question constrains scope, identifies relevant data sources, and sets expectations for the type of interpretation required (descriptive, diagnostic, predictive, or prescriptive).
Step 2: Collect Trusted Data
Interpretation built on unreliable data produces confident but wrong conclusions. Ensure data is validated, current, and sourced from governed systems. Data quality management and validation techniques are prerequisites, not afterthoughts. When multiple sources conflict, resolve discrepancies before proceeding.
Step 3: Analyze Metrics and Patterns
Apply appropriate analytical methods to answer the defined question. This may include trend analysis, segmentation, correlation testing, anomaly detection, or predictive modeling. Use governed metrics from a semantic layer to ensure consistent definitions across analyses. Document methodology and assumptions for reproducibility.
Step 4: Interpret Causes and Business Impact
Translate analytical findings into business language. Identify root causes, assess magnitude of impact, and evaluate confidence level. Explicitly distinguish between correlation and causation. Acknowledge uncertainty and alternative explanations. This step requires domain expertise and often benefits from collaborative review across functions.
Step 5: Turn Insights Into Action
Every interpretation should conclude with specific, owned, time-bound next steps. Vague recommendations ("improve communication," "monitor closely") fail to create accountability. Link actions back to the original business question and define success metrics for follow-up evaluation. Track whether interpretations led to measurable outcomes to improve future interpretation quality.
How FineBI Helps With Data Interpretation
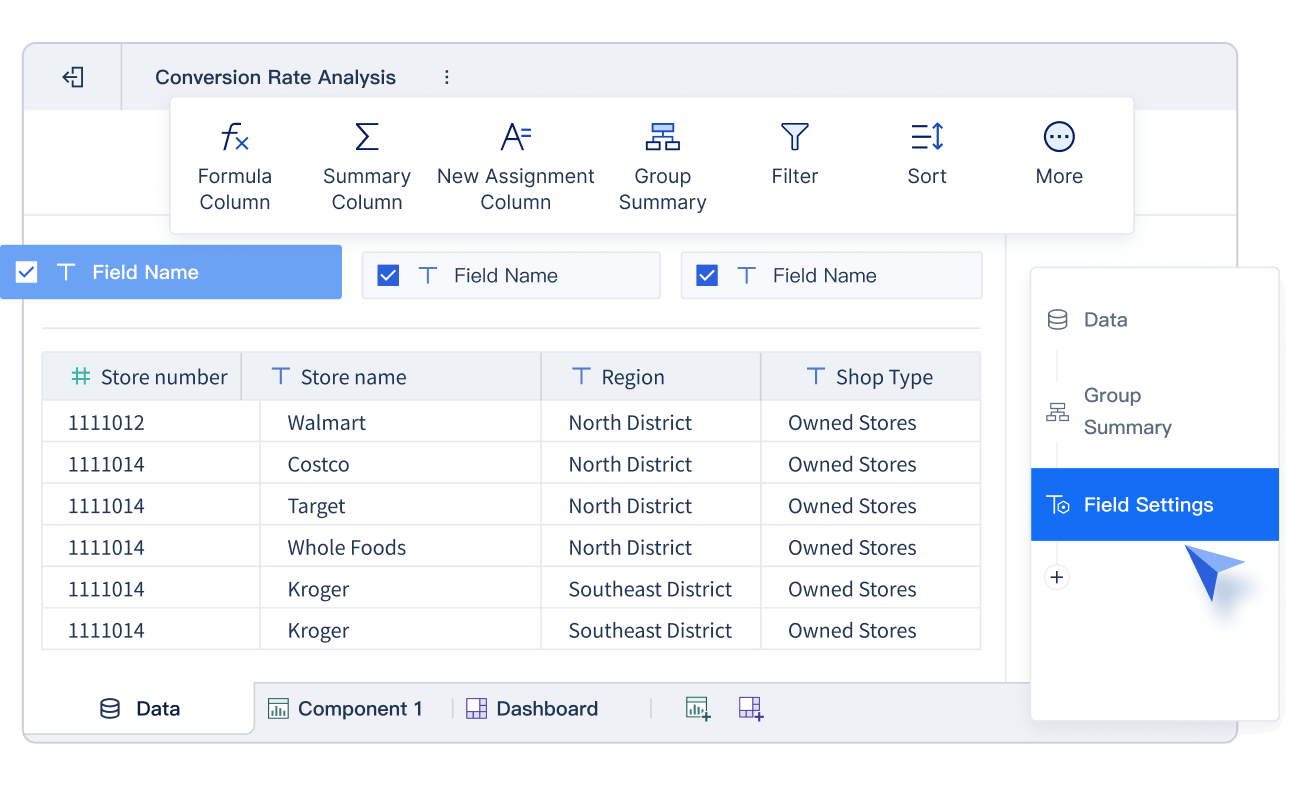
FineBI is where trusted enterprise data becomes governed, AI-assisted insight for business teams and executives. Rather than treating interpretation as a separate step after analysis, FineBI embeds interpretive capabilities throughout the analytics workflow.
Governed Metrics and Semantic Layer
FineBI provides a centralized semantic layer where metric definitions, calculation logic, and business rules are encoded once and reused consistently. This eliminates the most common source of interpretation errors: different teams using the same metric name with different underlying calculations. When a dashboard shows "gross margin," every user sees the same governed definition — enabling trustworthy interpretation without repeated validation.
Self-Service Exploratory Analysis
Business users can drill into anomalies, segment by dimensions, and test hypotheses without waiting for analyst support. Interactive exploration accelerates the interpretation cycle from days to minutes, allowing teams to iterate through multiple explanatory hypotheses before settling on the most evidence-supported conclusion.
Autonomous Insight and Visualization
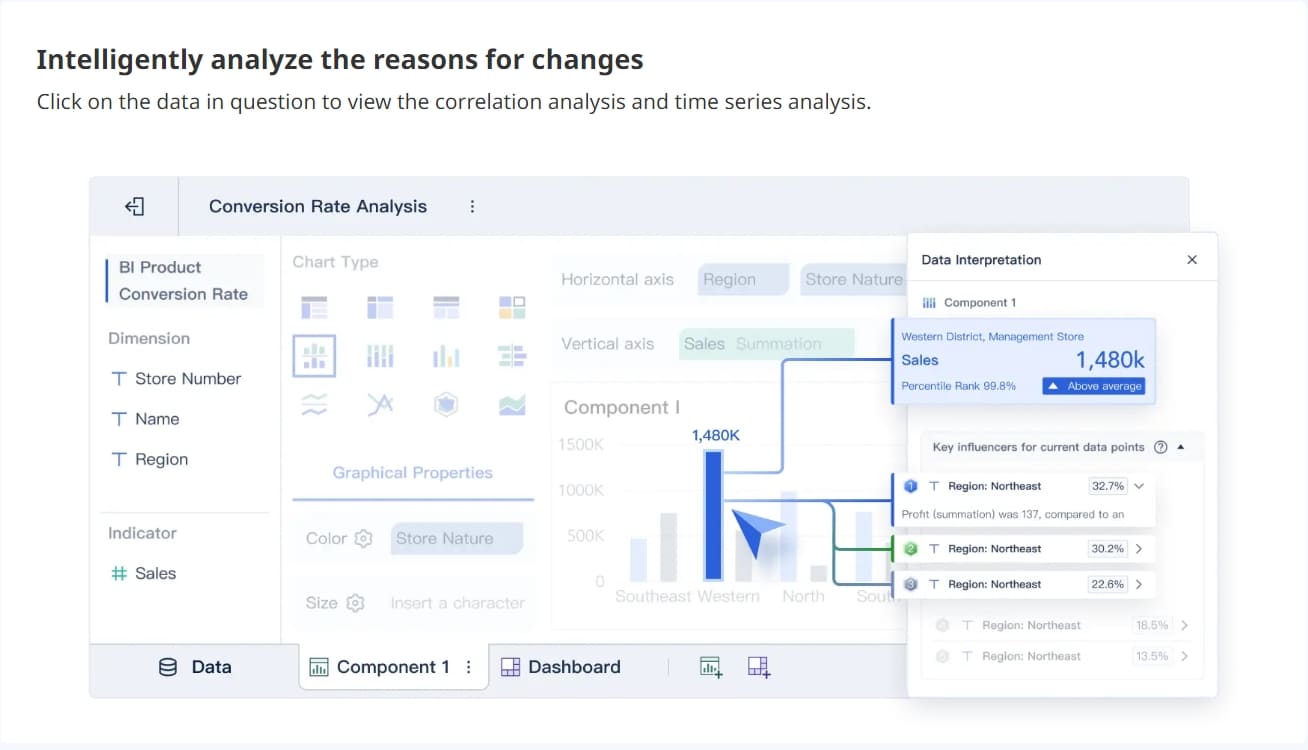
FineBI's AI-assisted features automatically surface key drivers, contributing factors, and anomalous patterns within datasets. Rather than requiring users to manually test every possible dimension, the platform highlights statistically significant contributors to observed changes. Auto-generated visualizations present these findings in contextually appropriate chart types, reducing the cognitive load of translating numbers into narratives.
Data Interpretation for Anomalies and Key Factors
When a KPI deviates from expectation, FineBI can decompose the variance across relevant dimensions (region, product, channel, time period) and rank contributing factors by statistical significance. This structured decomposition replaces speculative brainstorming with evidence-based diagnosis, ensuring interpretation starts from verified data relationships rather than anecdotal impressions.
Decision Activation and Action Workflow
Interpretation without activation is documentation, not decision-making. FineBI supports embedding alerts, thresholds, and workflow triggers directly within dashboards and reports. When an interpreted insight meets predefined criteria, the system can notify stakeholders, create tasks, or initiate approval processes — closing the loop from insight to action within the same governed environment.
By using tools like FineBI, you can manage the growing volume of data effectively and unlock its full potential. This approach not only enhances your data-driven decision-making but also ensures that your strategies remain relevant in a rapidly changing world.
Enhancing Efficiency with FineBI’s Data Interpretation Features
FineBI’s data interpretation features revolutionize how you analyze and act on data. These tools simplify complex datasets, allowing you to focus on what truly matters—making informed decisions quickly and effectively.
Key Features That Boost Efficiency
- Automatic Analysis
FineBI automatically identifies key factors influencing your data. For example, if sales drop in a specific month, the tool pinpoints the product categories or sales teams responsible. This automation saves you time and eliminates guesswork. - Customizable Settings
You can tailor the analysis to focus on dimensions that align with your business goals. This flexibility ensures that you only see insights relevant to your objectives, reducing distractions and improving clarity. - Time Sequence Comparisons
FineBI enables you to compare data across different time periods. This feature helps you identify trends, growth rates, and seasonal patterns, empowering you to plan more effectively.
Benefits of Using FineBI
Tip: Use FineBI’s built-in plugins to streamline your workflow. No installation is required, making it easier to get started.
- Save Time: Automating data interpretation reduces the hours spent on manual analysis.
- Improve Accuracy: FineBI minimizes human error by providing precise, data-driven insights.
- Enhance Collaboration: Teams can share dashboards and analysis results, ensuring everyone stays aligned.
FineBI’s data interpretation features transform raw data into actionable insights. By leveraging these tools, you can enhance efficiency, make smarter decisions, and stay ahead in a competitive market.
How Dora Extends Data Interpretation Into Data Agents
After FineBI establishes governed metrics and structured interpretation workflows, Dora extends these capabilities into conversational, autonomous interaction. Dora operates as an AI data agent on top of trusted FineBI assets, enabling business users to engage with interpreted data through natural language rather than dashboard navigation.
Dora supports data interpretation workflows by:
- Answering natural-language questions: Users ask "Why did APAC revenue drop last month?" and receive sourced explanations grounded in governed FineBI metrics, not generic LLM knowledge.
- Generating summaries and briefings: Scheduled daily or weekly digests highlight key changes, anomalies, and contributing factors across monitored metrics, delivered proactively without user-initiated queries.
- Explaining anomalies and root causes: When FineBI surfaces a variance decomposition, Dora translates it into narrative form with business context, making technical findings accessible to non-analyst stakeholders.
- Pushing alerts and reminders: Configured thresholds trigger proactive notifications when interpreted metrics breach defined boundaries, ensuring time-sensitive insights reach decision-makers before issues escalate.
- Turning repeated analysis into reusable Skills: Frequently asked interpretive questions can be codified as Skills — reusable, governed workflows that standardize how specific business questions are answered across the organization.

Ask Dora in Natural Language
Dora does not replace FineBI's governed semantic layer or exploratory analysis capabilities. It makes those capabilities conversationally accessible, extending interpretation reach to users who need answers but do not navigate dashboards regularly.
Why Trusted Data Matters Before Interpretation
Collecting trusted data is one of the important steps of the data interpretation process. No amount of sophisticated interpretation compensates for unreliable underlying data. Misinterpreted bad data is worse than no data at all — it creates false confidence in incorrect conclusions.
FineDataLink is the data movement and integration layer that makes trusted, timely data available for analysis and AI. It connects ERP, CRM, databases, APIs, and spreadsheets; applies validation rules and transformation logic; and synchronizes cleaned data into warehouses and BI platforms on scheduled or real-time cadences. When FineDataLink ensures data freshness and quality, FineBI can interpret it reliably, and Dora can explain it accurately.
The complete value chain for data-driven decision-making is: trusted data foundation (FineDataLink) → governed interpretation and insight (FineBI) → conversational AI agent action (Dora). Each layer solves a distinct problem; skipping any one undermines the others.
Use FineDataLink to Make Your Data Trusted →
Click the banner below to experience FineBI for free and empower your enterprise to convert data into productivity!
FanRuan
https://www.fanruan.com/en/blogFanRuan provides powerful BI solutions across industries with FineReport for flexible reporting, FineBI for self-service analysis, and FineDataLink for data integration. Our all-in-one platform empowers organizations to transform raw data into actionable insights that drive business growth.
FAQ
What is the difference between data interpretation and data visualization?
Data interpretation focuses on understanding the meaning behind the data, while data visualization presents data in graphical formats like charts or graphs. Visualization helps you see patterns, but interpretation explains why those patterns exist and how they impact your decisions.
How does FineBI simplify data interpretation?
FineBI automates analysis, highlights key factors, and provides customizable settings. You can quickly identify trends, compare time periods, and focus on relevant dimensions. Its user-friendly interface ensures you extract actionable insights without needing advanced technical skills.
Can non-technical users benefit from FineBI?
Absolutely! FineBI’s intuitive design and self-service features make it accessible to users without technical expertise. You can explore data, generate insights, and collaborate with teams effortlessly, empowering you to make data-driven decisions independently.
Why is real-time data analysis important in 2025?
Real-time analysis allows you to respond instantly to market changes. It helps you adjust strategies, optimize operations, and seize opportunities as they arise. In a fast-paced world, staying agile gives you a competitive edge.
How does FineBI handle large datasets?
FineBI uses a high-performance computing engine to process massive datasets efficiently. It supports over 10,000 users for online viewing and integrates data from multiple sources, ensuring seamless analysis even with complex data environments.