YOY means comparing business or financial results from one year to the next. You use year-over-year analysis to track changes in revenue, profit, or other metrics, making it easier to spot patterns and trends. YOY helps you evaluate performance, highlight strengths and weaknesses, and anticipate future results by looking at past years. This approach removes seasonal effects and gives you reliable comparisons for financial planning. You can apply year over year analysis to many business areas, including revenue growth and market share, to make smarter decisions.
YOY and Year-Over-Year Basics
YOY Definition
YOY stands for "year-over-year." In finance and business, you use this metric to compare a value from one year to the same value in a previous year. This approach helps you measure changes in revenue, profit, or other important metrics over time. You can see how your business performs by looking at the same period each year, which gives you a clear picture of growth or decline.
Year-over-year (YoY) is a metric that refers to the 12-month change of a particular value and compares it to the change in a different period. In other words, it is the change in annualized returns between two comparable periods. Year-over-year analysis is most commonly used when discussing financial or economic data, especially regarding growth.
You often see YOY used in financial reports, business updates, and market analysis. For example, you might compare your company's revenue in the first quarter of this year to the first quarter of last year. This method helps you understand if your business is moving in the right direction. YOY growth shows whether your revenues, profits, or other key numbers are increasing or decreasing over time.
YOY analysis matters because it gives you a reliable way to track business performance. When you compare results from the same period in different years, you remove the effects of seasonality. This makes it easier to spot real trends in your financial data.
Year-over-year analysis is particularly effective because it compares a company's performance in a specific period to the same period in the previous year, which mitigates the impact of seasonal variations. This method provides a clearer perspective on long-term trends and performance changes, unlike metrics such as Quarter-over-Quarter (QoQ), which can be skewed by seasonal effects.
You can use YOY analysis in many areas of business:
YOY analysis helps to uncover steady trends by removing seasonal fluctuations.
It provides a more accurate comparison of performance over the same period, allowing for better long-term insights.
In contrast, QoQ analysis is more effective for assessing immediate changes and trends, such as the impact of new product launches.
You rely on YOY comparisons for several reasons:
Eliminates short-term volatility: YOY comparisons smooth out fluctuations caused by short-term events, providing a clearer view of long-term performance.
Tracks growth and decline: By comparing the same period across different years, businesses can assess their growth trajectory.
Benchmarking performance: YOY data serves as a benchmark for measuring performance against previous years, aiding in goal setting.
Contextual insights: This method offers context by comparing financial metrics to the same period in the prior year.
You find YOY analysis especially useful in these scenarios:
Sales: Comparing quarterly or annual revenue year-over-year to assess organic growth and market share gains.
Inventory management: Tracking inventory levels annually to anticipate procurement needs and avoid shortages.
Customer support: Measuring year-over-year improvements in ticket resolution times and customer satisfaction scores.
Cybersecurity: Analyzing trends in the number of security incidents and severity levels to assess the effectiveness of investments in protection.
Human resources: Monitoring employee turnover rates year-over-year to refine retention strategies.
IT asset management: Comparing asset deployments, device loss rates, depreciation schedules, and lifecycle refresh activities to optimize resource planning.
When you use YOY growth as a key metric, you gain a better understanding of your business's financial health. This approach helps you make informed decisions, set realistic goals, and communicate progress to stakeholders. Year over year comparisons are essential for anyone who wants to track revenue, profit, or other financial metrics in a meaningful way.
YOY Growth Calculation
YOY Formula
You can calculate YOY growth using a simple formula. This formula helps you compare your business or financial results from one year to the next. Here is the standard way to calculate year-over-year growth:
(Current Year’s Value ÷ Previous Year’s Value) – 1
You can also express the result as a percentage by multiplying by 100. This formula works for revenue, profit, or any other metric you want to track. Using this method, you can see how your financial performance changes each year.
Tip: Always use accurate and consistent data for your YOY analysis to avoid misleading results.
Step-by-Step Example
Let’s walk through a practical example of YOY growth calculation for revenue:
Find your revenue for the current year and the previous year. For example, your business earned $230,000 in revenue this year and $195,000 last year.
Subtract last year’s revenue from this year’s revenue: $230,000 - $195,000 = $35,000.
Divide the difference by last year’s revenue: $35,000 ÷ $195,000 = 0.1794.
Multiply by 100 to get the percentage: 0.1794 × 100 = 17.94%.
Your YOY growth in revenue is 17.94%. This calculation helps you understand how your revenues change from year to year and supports better financial planning.
FineReport can automate these YOY calculations for you. You can set up reports that compare each year’s values, visualize trends, and generate dashboards. This saves time and reduces errors in your finance team’s reporting process.
You need to avoid several common mistakes when performing YOY analysis in business:
Misaligned time periods: Always compare the same period each year, such as Q1 this year to Q1 last year.
Ignoring inflation: If your revenue grows but inflation is higher, your real growth may be negative.
Not using external benchmarks: Compare your YOY growth to industry averages for a complete view.
Focusing only on revenue: Look at other financial metrics like profit margins and cash flow to assess overall financial performance.
Overlooking one-time events: Exclude unusual events that can distort your year-over-year growth.
You can improve your YOY comparisons by using tools like FineReport. FineReportensures data accuracy, aligns periods correctly, and helps you visualize year over year trends for better business decisions.
Consideration Type
Description
Contextual Analysis
Consider market conditions and industry trends that affect your performance.
Data Accuracy
Use accurate and consistent data for reliable YOY analysis.
Professional Services
Seek expert help for complex financial reporting and record-keeping.
By following these steps and using the right tools, you can make your YOY growth calculations more accurate and meaningful for your business and finance needs.
Beyond Traditional YoY: How AI is Transforming Year-over-Year Analysis
Traditionally, calculating and analyzing YoY growth required manual data consolidated from multiple spreadsheets, often leading to delayed insights. Today, AI-powered BI tools like FineBI/FineReport are changing the game. Instead of just looking at the past, modern enterprises leverage AI-driven anomaly detection and automated insights to understand why YoY revenue dropped or spiked in seconds. With natural language processing (NLP), business analysts can simply ask, 'Show me the YoY growth for Q2 by region,' and get instant, interactive visual dashboards.
You gain several advantages when you use YOY analysis in business and finance. YOY measurements help you track trends in key financial metricsover time. This approach gives you a clear view of growth or decline across years. Here are some main benefits:
YOY analysis helps you identify long-term trends in business performance, such as steady revenue growth or decline.
You can benchmark your results against previous years, which helps you set realistic goals and measure progress.
By comparing current performance to the previous year, you make informed decisions about business strategies.
YOY reporting is easy to compute and understand, making it accessible to many stakeholders.
This method provides a long-term perspective, reducing the risk of being misled by short-term changes.
YOY analysis accounts for seasonal fluctuations, giving you a clearer picture of underlying performance.
Tip: Use YOY percentage change to quickly spot patterns and make better forecasts for your business.
Benefit of YOY Analysis
Explanation
Comprehensive view of long-term growth patterns
YOY analysis compares metrics over a 12-month period, providing insights into overall performance.
Identifies strengths and weaknesses
This method helps you pinpoint areas of success and those needing improvement.
Assesses performance without seasonality influence
YOY analysis mitigates the impact of seasonal fluctuations, allowing for a more accurate assessment.
Limitations
While YOY analysis is powerful, you should know its limitations in financial reporting:
Limitation
Description
Reliance on historical data
YOY analysis uses past data, which may not reflect current market conditions.
Subjectivity in accounting practices
Different accounting methods can lead to varying interpretations of the same data.
Lack of non-financial information
YOY analysis does not include qualitative factors that can impact business performance.
Potential manipulation
Companies may use practices that distort financial results, affecting reliability.
Historical data limits your ability to predict future results.
Different accounting practices can cause inconsistencies in YOY comparison.
Important non-financial factors, such as customer satisfaction, may be overlooked.
Comparisons: YOY vs YTD vs QOQ vs MOM
You often compare YOY with other time-based metrics in finance. Each metric serves a different purpose:
Metric
Description
Purpose
YOY
Compares results over comparable periods annually
Provides a broader annual perspective, mitigating seasonality
YTD
Measures performance from the start of the year to the current date
Allows for interim assessments of performance
QOQ
Focuses on changes between one fiscal quarter and the previous one
Reflects short-term performance shifts
MoM
Highlights recent fluctuations in performance
Useful for tracking immediate changes
YOY analysis helps you see long-term growth and reduces the impact of seasonal changes. YTD gives you an accurate picture of current year performance. QOQ and MoM are useful for tracking short-term shifts and immediate changes.
Best practice: Combine YOY with other metrics like MoM or QOQ for a complete view of your business trends.
YOY Analysis in Business
YOY Financial Reporting
You use YOY analysis in financial reporting to compare your company’s performance from one year to the next. This method helps you track changes in key metrics such as revenue, profits, and other financial indicators. When you review year-over-year results, you gain a benchmark for measuring business performance and economic growth.
YOY analysis serves as a benchmark for comparing KPIs like revenues and profits.
It provides context to earnings or revenue, making your financial reports more meaningful.
You track business performance over time and see how effectively your resources generate value.
YOY comparisons allow you to spot trends and patterns that might not be visible in shorter time frames. You can use this approach to evaluate whether your financial performance is improving, staying steady, or declining. This insight is essential for both internal management and external stakeholders who want to understand your company’s growth.
YOY Business Decision-Making
You rely on YOY analysis to make informed decisions and drive strategic planning. By smoothing out short-term volatility, YOY analysis gives you a clearer picture of sustainable growth.
YOY analysis helps you shape business strategies for both short-term and long-term goals.
You use YOY metrics to foster long-term growth and success.
YOY comparisons provide valuable insights that guide your decisions and help you allocate resources more effectively.
When you analyze year-over-year growth, you can identify which areas of your business need improvement and which strategies deliver the best results. This approach supports better forecasting and risk management, helping you stay competitive in the finance industry.
FineReport for YOY Analysis
FineReportempowers you to automate YOY analysis and streamline financial reporting. You can create dashboards and reports that visualize year-over-year growth, making it easier to monitor business performance in real time. The platform offers features that support efficient YOY analysis:
Combines data from multiple sources for comprehensive analysis.
User-friendly Reporting Tools
Allows you to create reportsor dashboards quickly using drag & drop.
Real-time Data Entry
Improves efficiency in updating real-time data for financial dashboards.
Customization via Open APIs
Enables IT to customize reporting systems to meet specific needs.
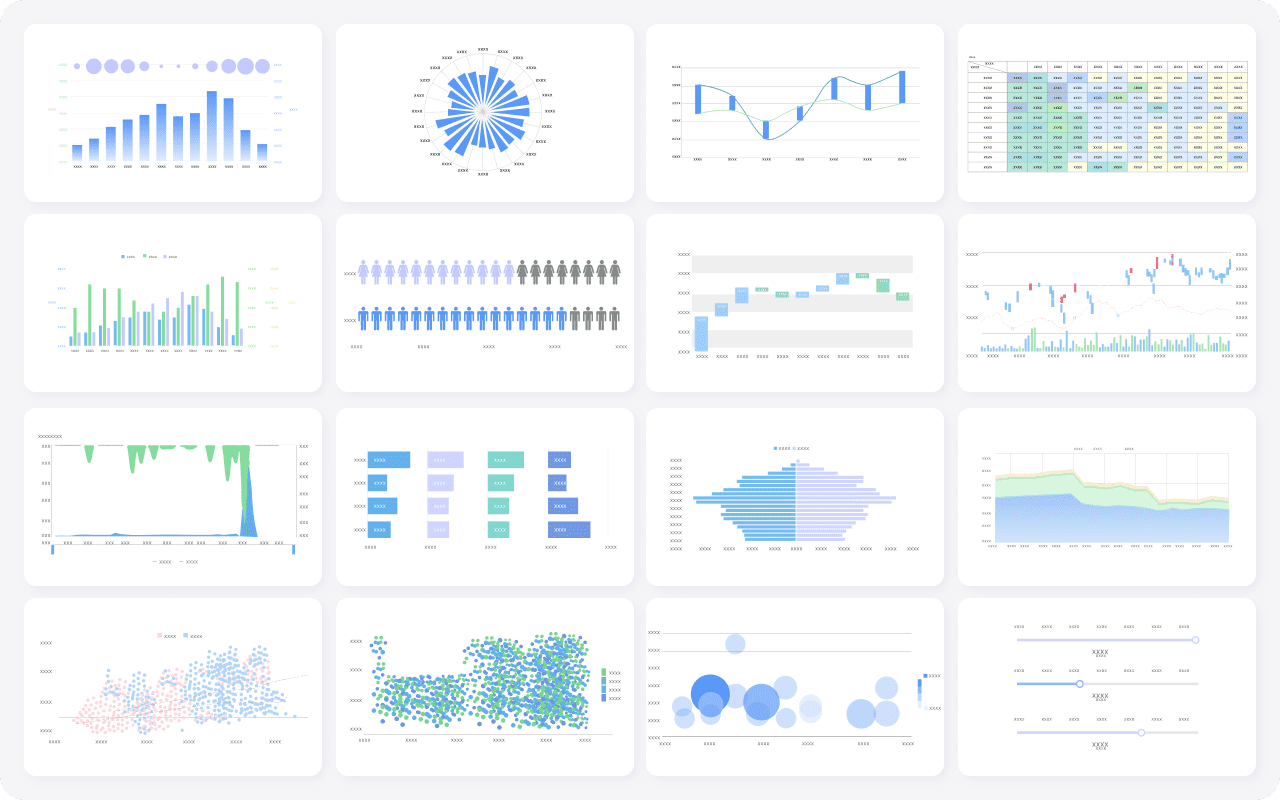
Rich Chart Options
Provides over 50 styles of HTML5 charts for enhanced data presentation.
Data Input Controls
Facilitates massive data input with validation and temporary storage.
You benefit from FineReport’s financial management solution, which integrates data from various sources and automates report generation. Many companies, such as Founder Securities, have improved their business operations and decision-making by using FineReport for YOY analysis. You can leverage these tools to gain deeper insights into revenue trends, financial performance, and business growth, ensuring your organization stays ahead in a competitive market.
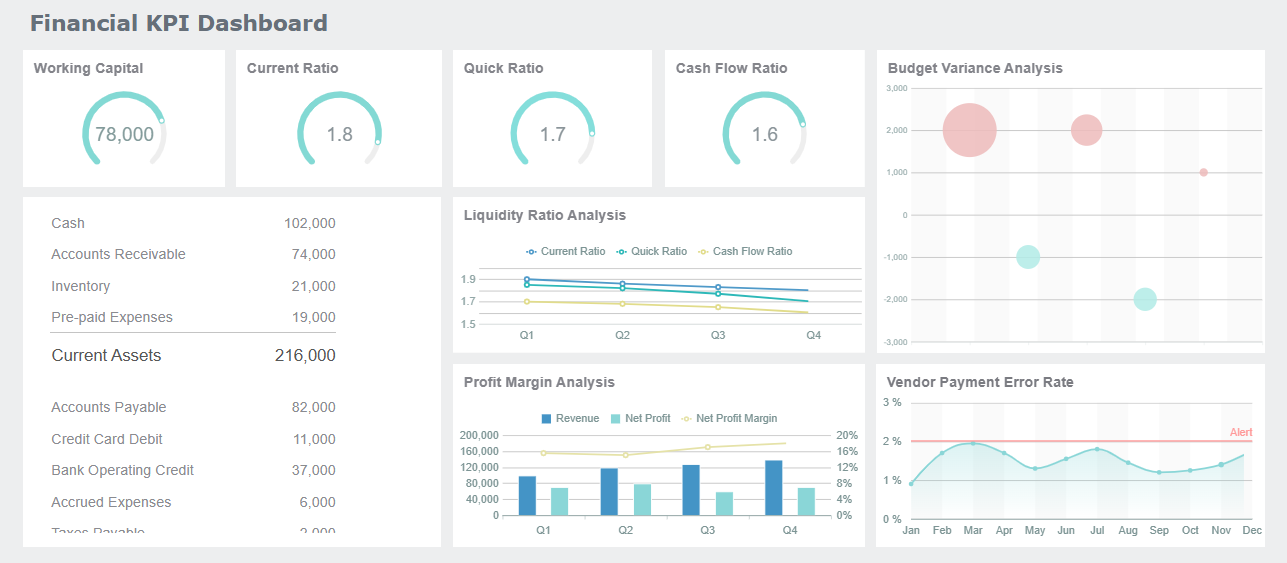
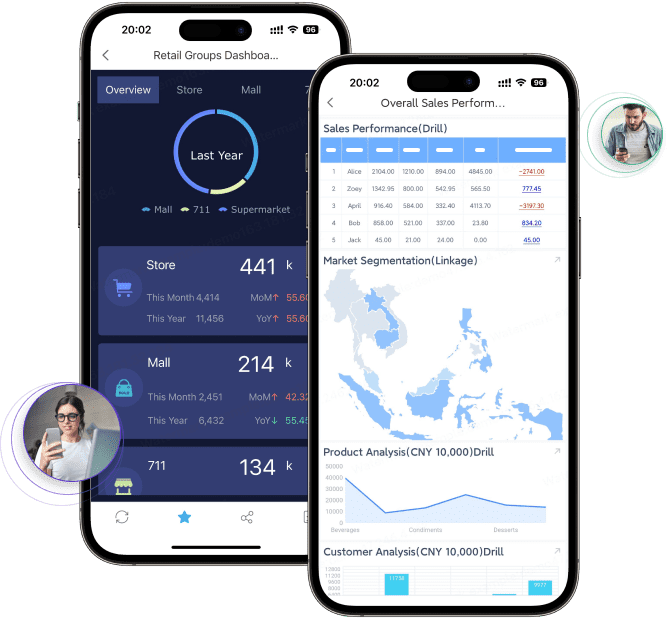
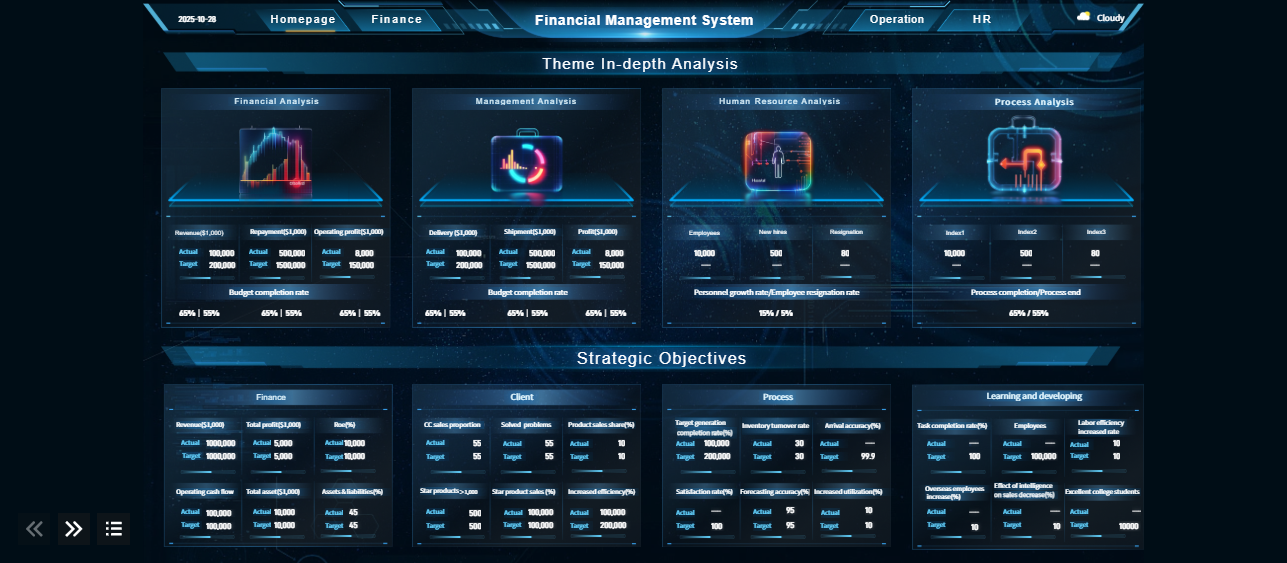
FineReport's Multiple Charts For Data Visualization
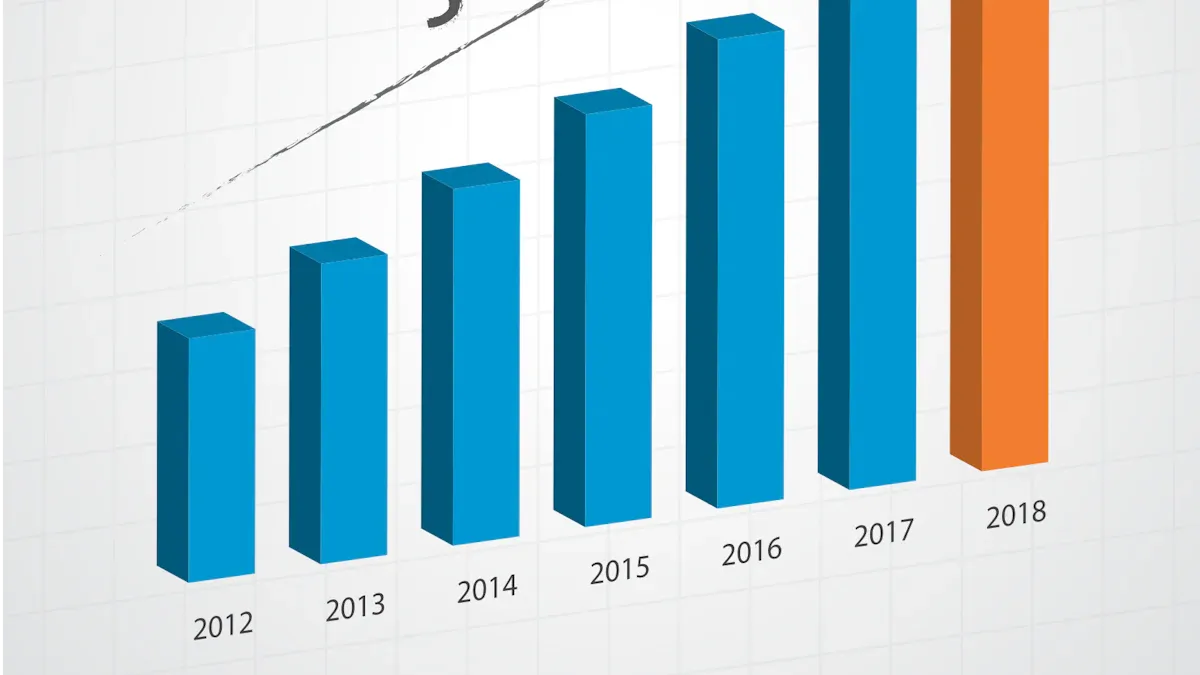
You often start your year-over-year analysis by looking at YOY revenue growth. This metric compares your revenue from one year to the same period in the previous year. For example, if your business earned $500,000 last year and $600,000 this year, you see a YOY increase in revenues of 20%. Tracking YOY revenue growth helps you understand if your sales strategies work and if your business expands over time. Many companies use this metric to measure financial performance and set future goals. You can also break down revenue by product or service to see which areas drive the most growth.
YOY Profit
YOY profit is another key metric for evaluating business success. You calculate this by comparing net profit from one year to the next. If your net profit was $80,000 last year and $100,000 this year, your YOY profit growth is 25%. This metric shows how well you control costs and increase efficiency. By tracking YOY profit, you can spot trends, identify challenges, and make better decisions for your business. YOY comparisons for profit help you see if your strategies improve your bottom line.
Other Key YOY Metrics
You can track many other year-over-year metrics to get a complete view of your business. Common uses of year-over-year analysis include:
Operating cash flow
Customer acquisition cost
Inventory turnover
Customer satisfaction rates
Website traffic
Accounts receivable days
These metrics help you measure growth, efficiency, and customer engagement. Year over year analysis gives you a clear picture of changes across different areas.
FineReportdashboards and reports make it easy to visualize these YOY metrics. You can use the flexible report designer to create custom dashboards that show YOY growth for revenue, profit, and other key indicators. The platform offers diverse visualization types, interactive analysis, and mobile BI access. You can connect data from multiple years and sources, making your YOY analysis accurate and actionable.
Feature
Description
Flexible Report Designer
Rapidly build dashboards to visualize YOY metrics.
Diverse Visualization
Display YOY data with charts and graphs.
Interactive Analysis
Explore trends and compare year-over-year results easily.
Data Entry
Input and update data for accurate YOY comparisons.
Deployment & Integration
Gather YOY data from different periods and sources.
Mobile BI
Access YOY metrics on any device, anytime.
By using FineReport, you can track and present all your important YOY metrics, helping you make informed decisions and drive business growth.
FineReporthelps you overcome common YOY analysis challenges. You can use flexible formula calculations to support accurate YOY growth rates. FineReport allows you to fetch data from various business databases, making your YOY reporting more comprehensive. Multi-dimensional dashboards enable you to analyze YOY performance deeply and make better decisions for your business.
Understanding YOY gives you a clearer view of business performance by neutralizing seasonal effects and aligning timeframes. You can use YOY analysis to compare growth, shape business strategies, and make informed decisions.
YOY helps you monitor efficiency, benchmark against competitors, and spot trends that affect long-term growth.
FineReport streamlines YOY tracking and reporting, letting you visualize key metrics and act quickly. Explore FineReportto simplify your year-over-year analysis and support smarter business decisions.
Access a wealth of case studies, industry insights, and solution guides to accelerate digital transformation.
FAQ
What does YOY mean in finance and business?
YOY stands for year-over-year. You use YOY to compare a financial metric, like revenue or profit, from one year to the same period in the previous year. This helps you track growth and spot trends.
How do you calculate YOY growth?
You calculate YOY growth by subtracting last year’s value from this year’s value, dividing by last year’s value, and multiplying by 100. This gives you the YOY growth rate as a percentage.
Why should you use YOY analysis instead of MoM or QoQ?
YOY analysis removes seasonal effects. You get a clearer view of long-term trends. MoM (month-over-month) and QoQ (quarter-over-quarter) can show short-term changes but may be affected by seasonality.
What are common mistakes in YOY analysis?
You might compare different periods, ignore inflation, or overlook one-time events. Always use consistent data and compare the same periods each year for accurate YOY results.
How can FineReport help with YOY reporting?
FineReport lets you automate YOY calculations, visualize trends, and create dashboards. You can connect data from multiple sources and generate accurate YOY reports quickly, supporting better business decisions.