A white label reporting tool is software that lets you deliver dashboards, reports, or analytics experiences under your own brand instead of the vendor’s. If you are a marketing agency, consultancy, SaaS company, or product team, you are likely trying to solve one of these problems:
Show client or customer data without exposing a third-party vendor
Deliver recurring reports at scale without manual formatting
Embed analytics into a product or portal with a branded experience
Manage multiple tenants, clients, or accounts efficiently
Balance visual branding with real reporting, governance, and scalability needs
In practice, buyers are not just comparing logos and color themes. They are evaluating whether a platform can support client-facing analytics workflows, automated delivery, multi-client administration, embedded access, and in some cases more structured operational reporting than a dashboard tool alone can provide.
White-label reporting means you use a reporting or analytics platform, but your clients or end users experience it as part of your service or product. That can be simple branding, or it can go much deeper into product delivery.
For agencies, the usual goal is to provide recurring client reports that look native to the agency brand. For SaaS teams, the goal is often to give customers in-app analytics, embedded dashboards, or a separate branded analytics portal without building a full BI layer from scratch.
A white label reporting tool typically helps you do four things:
Present dashboards or reports in a customer-facing way
Define white-label reporting in practical terms for agencies, SaaS teams, and client-facing analytics workflows
For an agency, white-label reporting usually means:
Adding your logo, colors, and brand style
Sharing reports from your own domain or subdomain
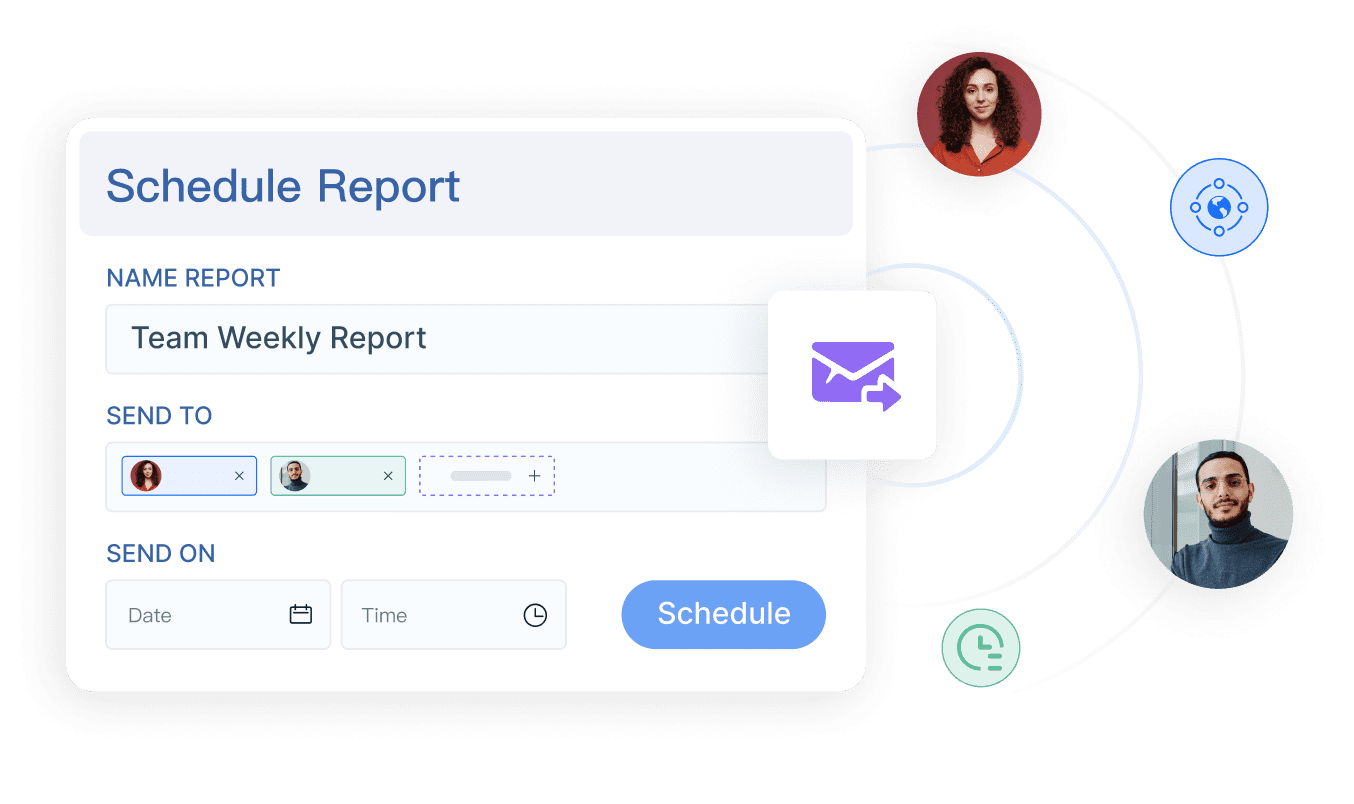
Sending scheduled PDFs or links from your own email identity
Giving clients dashboard access without visible vendor branding
Reusing templates across many accounts
For a SaaS company, white-label reporting often means:
Embedding analytics inside the product
Matching the application UI closely
Supporting account-based permissions and tenant isolation
Letting customers self-serve insights without leaving the product
Scaling branded analytics across many end users
Clarify how branded dashboards, scheduled reports, client portals, and domain customization differ
These terms are related, but not identical.
Branded dashboards
These are live, interactive dashboards where the vendor branding is reduced or removed and replaced with your own design elements.
Scheduled reports
These are automated exports or recurring emails, often in PDF or link form, sent weekly or monthly to stakeholders or clients.
Client portals
These give users a login-based place to view dashboards, reports, and sometimes files or comments. This matters when you want clients to self-serve, not just receive email attachments.
Domain customization
This means users access analytics via a branded URL such as reports.yourcompany.com rather than a vendor-owned domain. This is often an important trust and product-experience requirement.
Explain where these tools sit between dashboard software, BI platforms, and reporting automation products
A white label reporting tool can sit in one of three broad categories:
Dashboard-first tools focused on KPI visibility and easy sharing
BI platforms that support more advanced modeling, embedded analytics, and exploration
Reporting platforms built for highly formatted, operational, printable, or scheduled reporting
This distinction matters. Many buyers start by asking for white-label dashboards, but later realize they also need:
That is often when a dashboard-only product stops being enough.
The 7 options compared at a glance
How each platform serves agencies vs. SaaS teams
Here is how the seven options generally align with the two main buyer groups.
1. FineReport
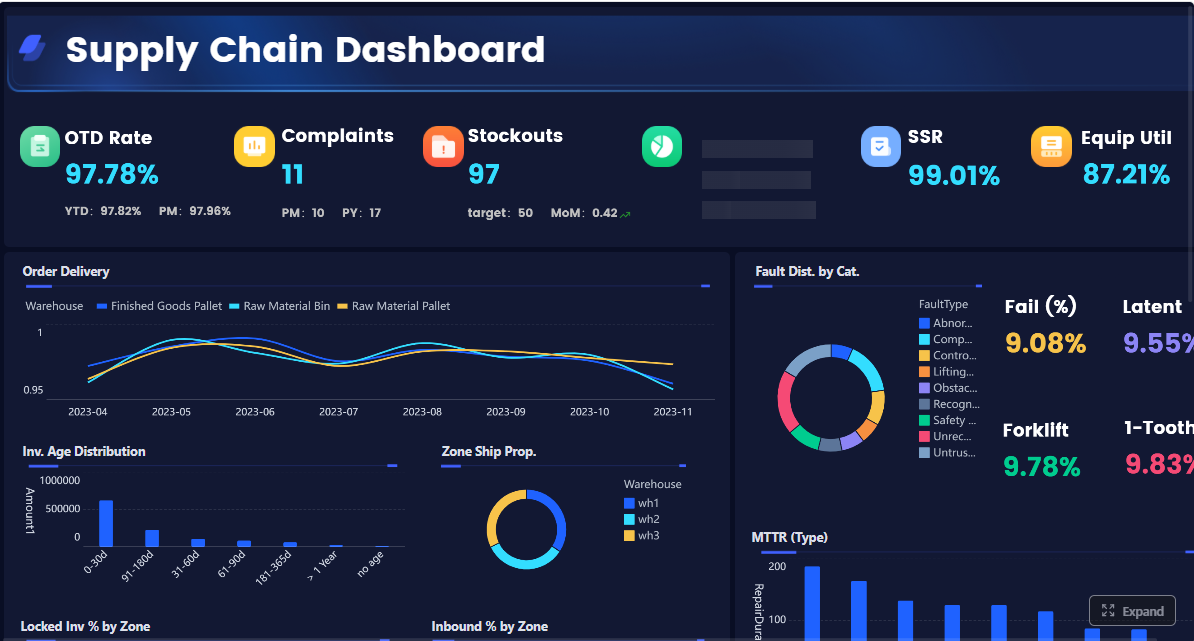
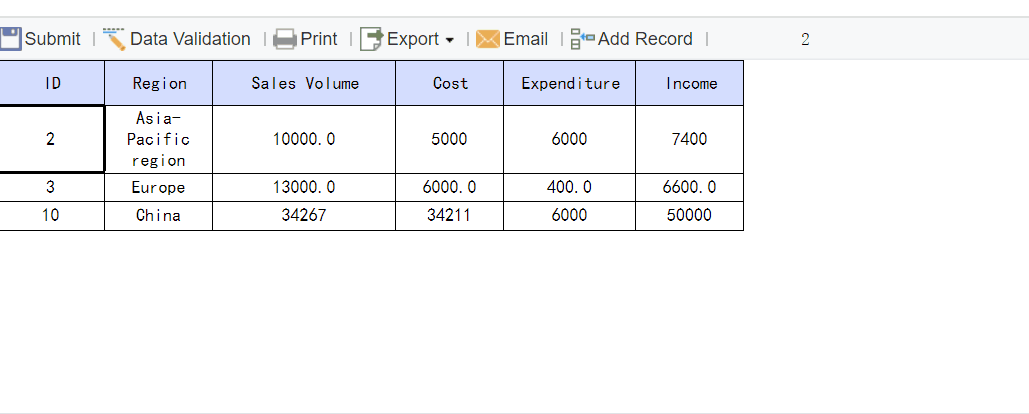
FineReport is best understood as an enterprise reporting and analytics platform rather than a marketing-only reporting tool. It is relevant when buyers need branded dashboards, embedded analytics, scheduled reports, and also more structured outputs such as paginated reports, printable forms, parameterized reports, and operational workflows.
Better fit for: SaaS teams, enterprise application teams, operations-heavy environments, finance and management reporting Less ideal for: teams that only need simple plug-and-play marketing dashboards with minimal customization
2. AgencyAnalytics
AgencyAnalytics is primarily agency-oriented. It is designed around marketing integrations, recurring client reporting, and account-level delivery. It is a natural fit when your reporting workflow is heavily centered on campaign performance and client communication.
Better fit for: digital marketing agencies, SEO agencies, PPC reporting teams Less ideal for: SaaS teams needing deeply embedded product analytics or highly custom reporting logic
3. DashThis
DashThis emphasizes quick setup and easy dashboard reuse. It is often attractive to agencies that want polished, fast-to-launch client reporting without building a complex BI layer.
Better fit for: agencies with standardized KPI packages Less ideal for: organizations that need deep modeling, application embedding, or enterprise reporting controls
4. Whatagraph
Whatagraph is usually considered by agencies that need multi-channel performance reporting and visually polished client deliverables. It tends to appeal to teams that want both dashboards and recurring reports for marketing data.
Databox is centered on KPI tracking, dashboards, and sharing. It can serve both agencies and SaaS teams, especially when the reporting experience is more about performance monitoring than highly structured reporting.
Better fit for: KPI-focused teams, client-facing scorecards, lightweight white-label experiences Less ideal for: document-heavy reporting requirements
6. Looker Studio
Looker Studio is often chosen because of accessibility and low entry cost. Some teams use it for branded client dashboards, especially in Google-centric environments. But white-label expectations need to be checked carefully against actual product delivery requirements.
Better fit for: budget-conscious teams, lightweight reporting, internal-to-client sharing Less ideal for: robust white-labeled portals, stronger governance, or more advanced embedded UX needs
7. Zoho Analytics
Zoho Analytics sits closer to BI than agency-only reporting products. It can be relevant for SMBs and SaaS vendors looking for a white-label BI layer with broader analytics capability than simple dashboard tools.
Better fit for: SMB software vendors, teams wanting rebrandable BI capabilities Less ideal for: buyers who need very specialized enterprise operational reporting layouts
Strengths, trade-offs, and pricing considerations
Each white label reporting tool tends to optimize for a different combination of speed, flexibility, and reporting depth.
Trade-offs: less suited to highly formatted and paginated reporting
Pricing consideration: buyers should inspect white-label add-ons and feature gating carefully
Looker Studio
Strengths: accessible, flexible for lighter reporting, broad familiarity
Trade-offs: often requires more technical effort and may not satisfy full white-label or enterprise delivery expectations
Pricing consideration: low entry cost, but maintenance and customization effort can become the hidden cost
Zoho Analytics
Strengths: white-label BI positioning, broader analytics scope than agency-only tools
Trade-offs: requires evaluation for product UX fit, governance, and advanced reporting needs
Pricing consideration: can be attractive for SMB buyers, but total cost depends on users, embedding, and scale
FineReport
Strengths: strong report design, dashboards plus reports, parameter queries, scheduling, data entry forms, enterprise deployment support
Trade-offs: more platform-oriented than lightweight dashboard tools, so implementation planning matters
Pricing consideration: should be evaluated as a reporting platform investment, especially when replacing multiple tools or manual workflows
Branding and delivery capabilities
When buyers compare white label reporting tools, branding is only one layer. Delivery controls matter just as much.
Common branding and delivery capabilities to evaluate include:
Logo and theme customization
Custom domains or subdomains
Branded login experience
Vendor branding removal
White-labeled email delivery
PDF export quality
Live dashboard sharing
Access controls by client or workspace
Embedded access inside your app or portal
A simple dashboard product may support logo changes and shared links but still fall short on custom domain support, export quality, or tenant-level control. By contrast, more complete BI or reporting platforms may support a deeper delivery model, especially for SaaS and enterprise use cases.
Evaluation criteria buyers should use before purchasing
Many teams buy a white label reporting tool by focusing too much on visual branding and not enough on how reporting will operate six months later. A better evaluation starts with workflows, scale, and maintenance.
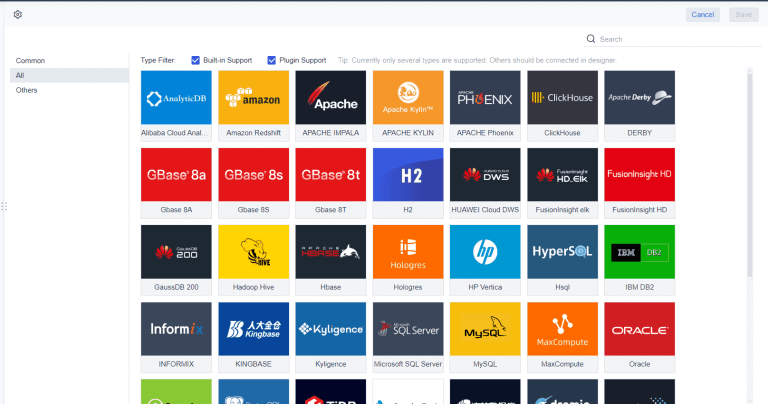
Data integrations and modeling flexibility
A reporting experience is only as good as the data behind it.
Assess these questions:
Which native connectors are available?
Can the platform connect to databases, warehouses, or APIs?
How well can it blend or model data across sources?
Are transformations handled in-platform, upstream, or manually?
Can report logic be standardized and reused?
Agency-focused tools often do well with common marketing connectors. BI platforms tend to offer broader modeling flexibility. Enterprise reporting tools are especially valuable when you need reports built from structured operational or transactional systems, not just ad platforms.
If your use case includes finance, operations, inventory, HR, or project workflows, look beyond connector count alone. You may need stronger control over report layout, business logic, and print-ready output.
Multi-client management and scalability
This is one of the biggest decision points for agencies and SaaS teams alike.
Key areas to examine:
Workspace or tenant structure
Role-based permissions
Account hierarchies
Dashboard and report cloning
Template reuse
Client onboarding speed
Bulk updates across many accounts
How easily your team can maintain hundreds of branded deliverables
A tool may look excellent in a demo but become difficult once you are managing 50, 100, or 500 clients or tenants. Ask how reusable assets work in real life, not just whether the feature exists.
Embedded reporting and customer-facing experiences
For SaaS companies, this may be the most important evaluation area.
Review:
iframe embedding support
APIs or SDK options
Single sign-on possibilities
User-level and tenant-level access control
Custom navigation or portal integration
Whether the analytics UX feels native enough for your product
Some tools are easier to share externally than to truly embed elegantly. That distinction matters if analytics is part of your product experience, not just an external dashboard link.
Support, implementation, and long-term maintenance
White-label reporting is not just a software purchase. It becomes part of your delivery model.
Consider:
Onboarding support
Documentation quality
Training resources
Customer success responsiveness
Enterprise SLAs if required
Change management effort
Admin burden over time
The technical skill level needed to maintain data pipelines and templates
A low-cost tool that requires constant manual fixes can become more expensive than a platform with better governance and implementation support.
Where each tool fits best
Best fit for marketing agencies
If your main job is recurring client reporting on PPC, SEO, social, email, and web analytics, agency-focused products usually make the most sense.
The strongest options for this profile are often:
AgencyAnalytics for recurring agency reporting operations
DashThis for speed and template-driven delivery
Whatagraph for multi-channel marketing visibility
Databox for KPI dashboards and ongoing client performance tracking
These tools generally align well when:
Your metrics mostly come from marketing platforms
Your clients expect dashboards and monthly reports
You want fast rollout and low admin friction
You do not need highly formatted enterprise documents or operational workflows
Best fit for SaaS products and BI-led teams
If you are delivering analytics as part of a software product, your shortlist may look different.
The stronger options here often include:
Zoho Analytics for broader white-label BI scenarios
Databox for straightforward branded KPI experiences
Looker Studio for lightweight and budget-sensitive use cases
FineReport when embedded analytics must also support structured reports, printable outputs, dashboards, and more complex reporting workflows
These tools are more relevant when:
You need customer-facing analytics in-app or in a portal
You need stronger tenant separation and permissions
This is a common turning point for operations, finance, manufacturing, logistics, and enterprise software teams. They still want a white-labeled experience, but they also need a real reporting platform, not just charts on a screen.
Tools like DashThis, AgencyAnalytics, Databox, and Whatagraph are widely used for client-facing dashboards and marketing reporting. They can be very effective when the main requirement is to automate KPI visibility and present branded analytics externally.
But teams with more complex reporting workflows may also need a dedicated enterprise reporting platform like FineReport.
FineReport is especially relevant when your white label reporting requirement goes beyond dashboard branding and includes:
This makes FineReport a practical option for SaaS platforms, enterprise software teams, and organizations that need both customer-facing analytics and structured business reporting.
For example, an agency might use a dashboard-first tool for marketing KPI summaries. But a SaaS company delivering analytics to customers may need a more complete mix of embedded dashboards, printable reports, filtered account views, and scheduled outputs. Likewise, operations or finance teams may need branded portals plus formal report documents that dashboard tools alone do not handle well.
Get Ready-to-Use Dashboard and Report Templates in Fine Gallery
Final thoughts
The best white label reporting tool depends less on surface branding and more on the kind of reporting experience you are actually delivering.
If you are a marketing agency, a dashboard-first platform may be the right answer. If you are a SaaS company or enterprise team with embedded analytics, customer-facing reporting, or operational reporting needs, you may need a platform with broader reporting depth.
The smartest buyers compare tools across four areas:
branding
delivery
scalability
reporting depth
If your requirements include branded dashboards, formal reports, scheduling, embedding, and more structured enterprise reporting workflows, FineReport is worth evaluating alongside the more dashboard-centric options.
A white label reporting tool lets you present dashboards, reports, or analytics under your own brand instead of the software vendor’s. It is commonly used by agencies and SaaS teams to deliver a more seamless client or customer experience.
White label reporting focuses on rebranding the analytics experience so it looks like your product or service. Embedded analytics refers more specifically to placing dashboards or reports inside an app, portal, or website.
The most important features are custom branding, scheduled report delivery, client or tenant-level permissions, and custom domain support. Teams with more advanced needs should also evaluate embedding, automation, and scalable administration.
Yes, many platforms support custom domains and branded email delivery, but the depth of this feature varies by vendor and plan. Buyers should confirm whether login pages, shared links, alerts, and scheduled reports are all fully branded.
If you need more than dashboard sharing, look for a platform that supports pixel-perfect reports, paginated output, automation, and stronger governance. Tools such as FineReport are better suited to enterprise reporting and operational workflows than lightweight dashboard-first options.
Product Trial
FineReport
Pixel-perfect reports · Interactive dashboards · Easy data entry · Digital twins
 AgencyAnalytics is primarily agency-oriented. It is designed around marketing integrations, recurring client reporting, and account-level delivery. It is a natural fit when your reporting workflow is heavily centered on campaign performance and client communication.
 DashThis emphasizes quick setup and easy dashboard reuse. It is often attractive to agencies that want polished, fast-to-launch client reporting without building a complex BI layer.
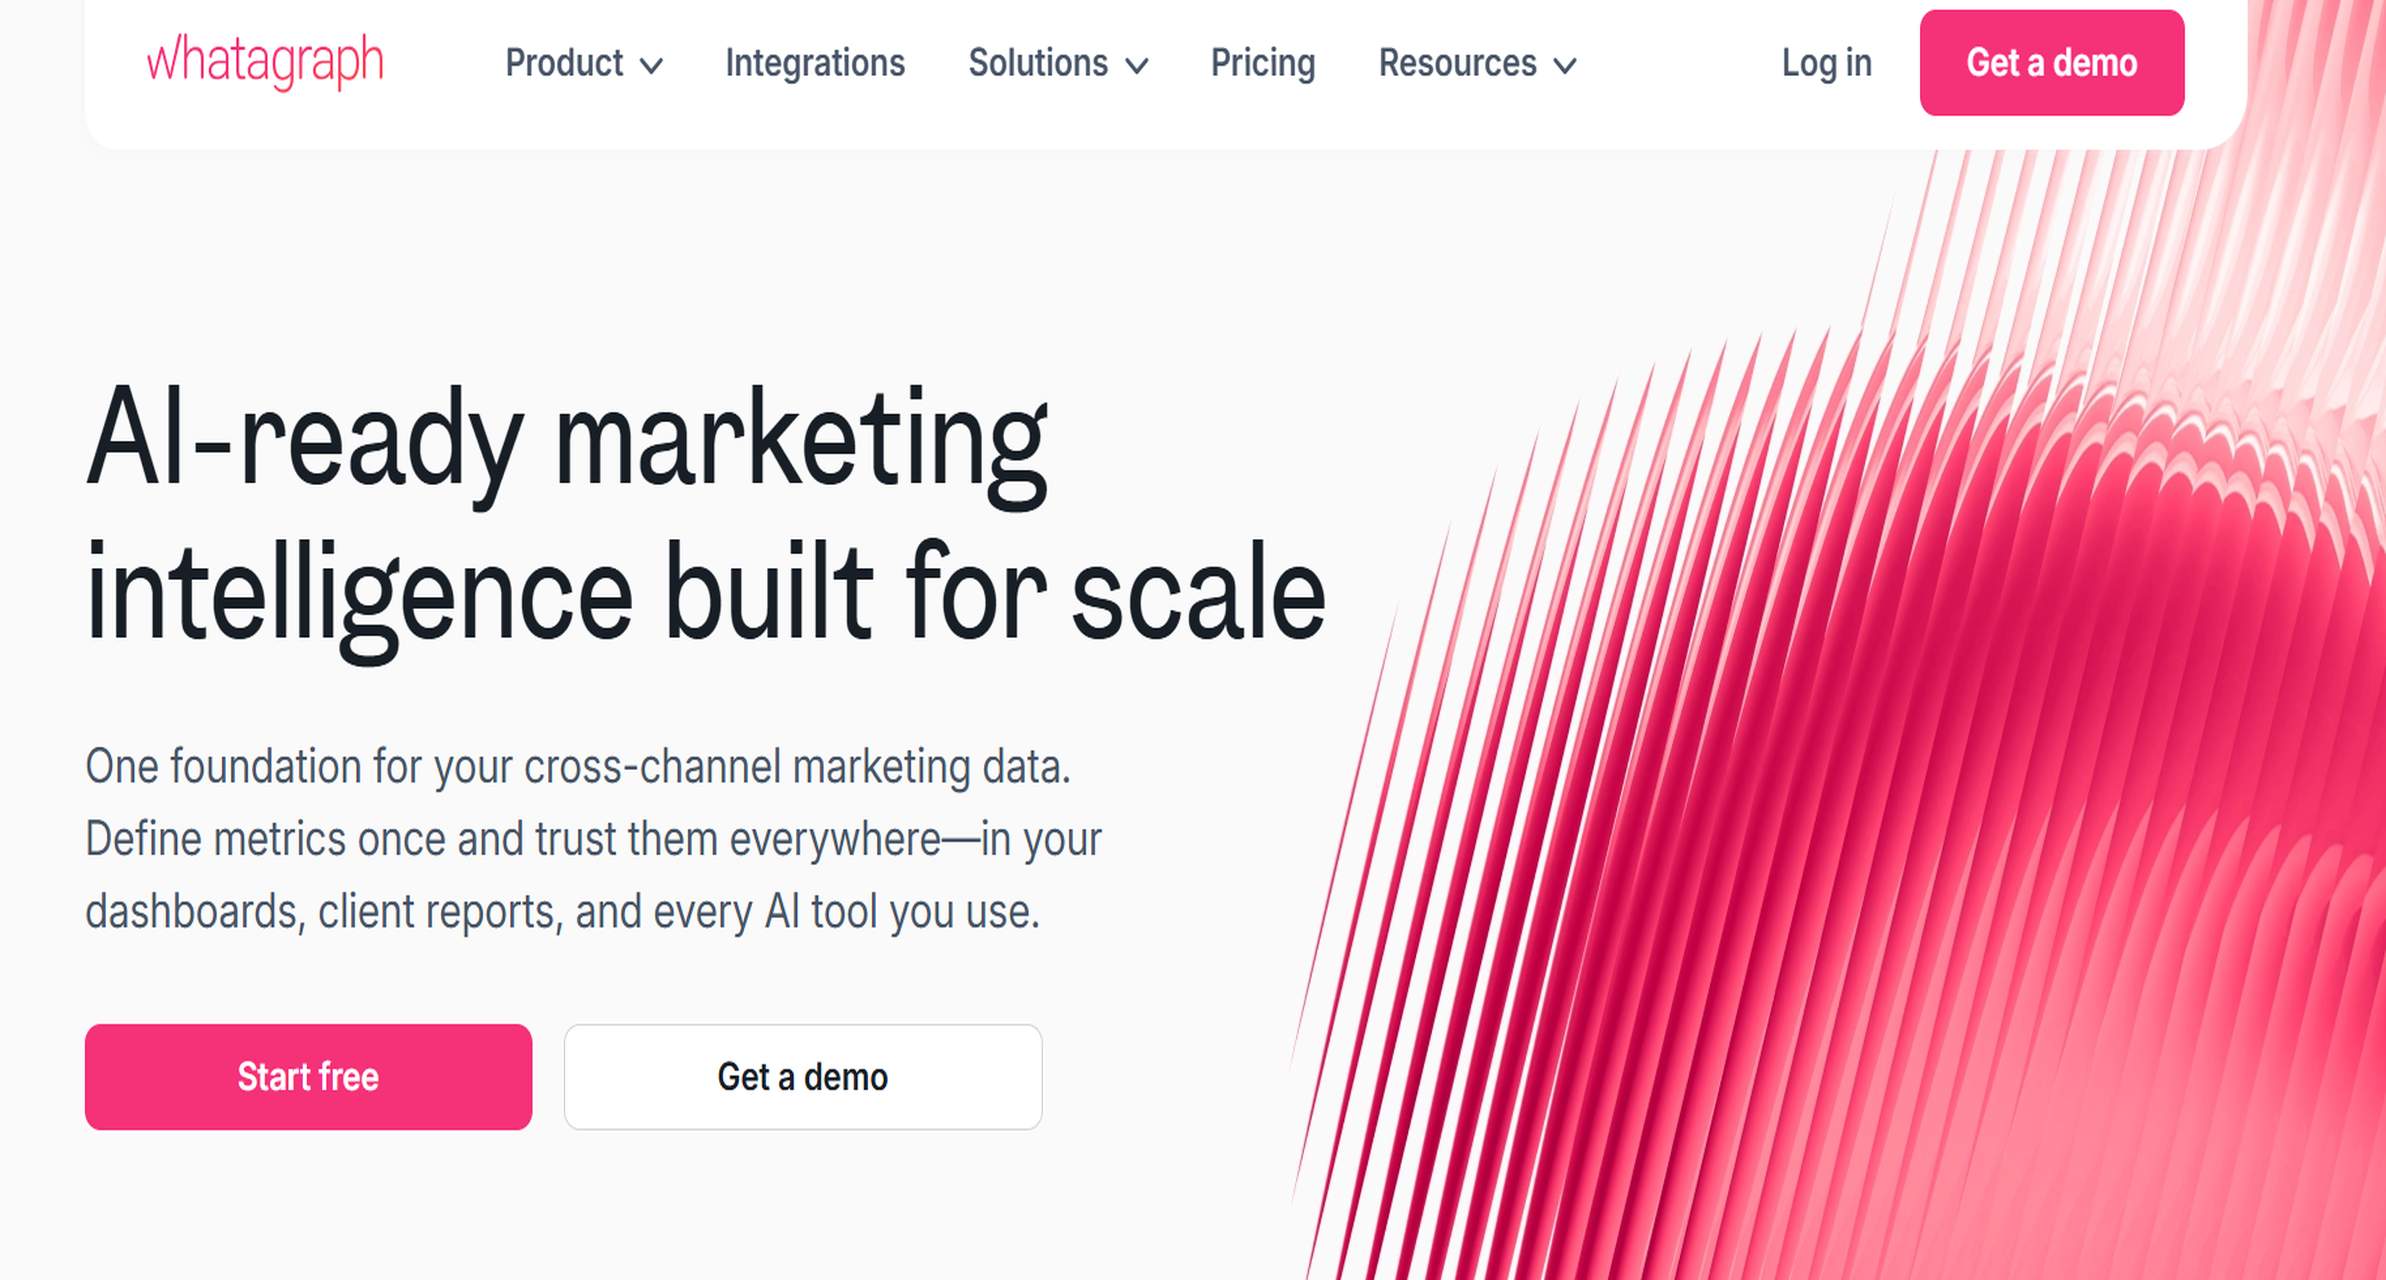 Whatagraph is usually considered by agencies that need multi-channel
 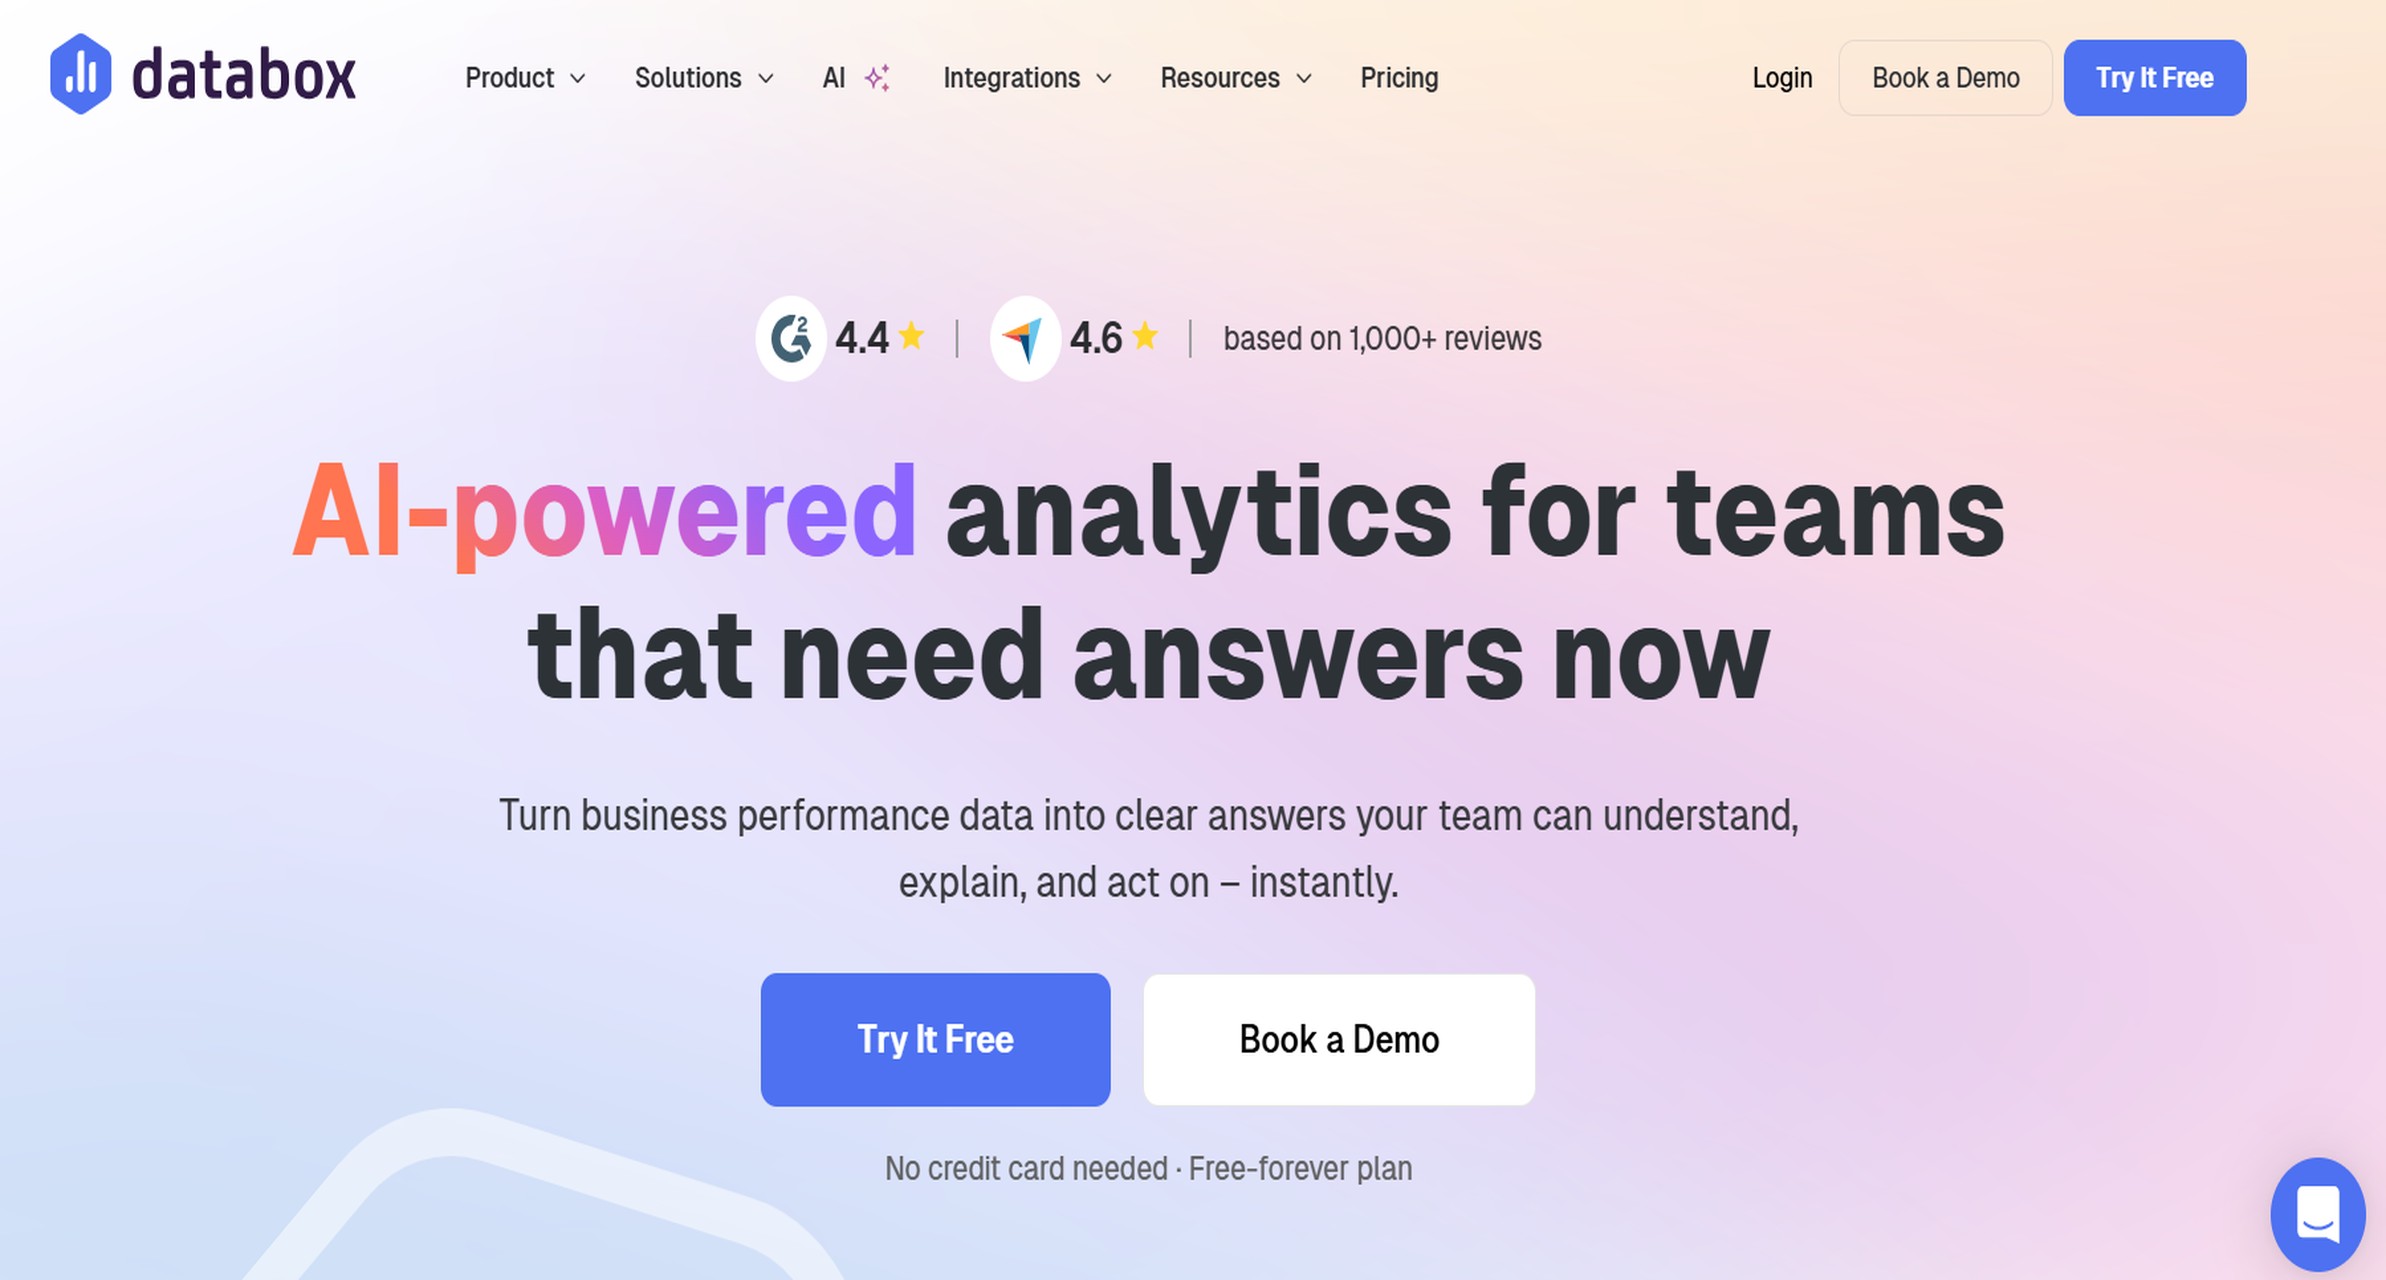 Databox is centered on
 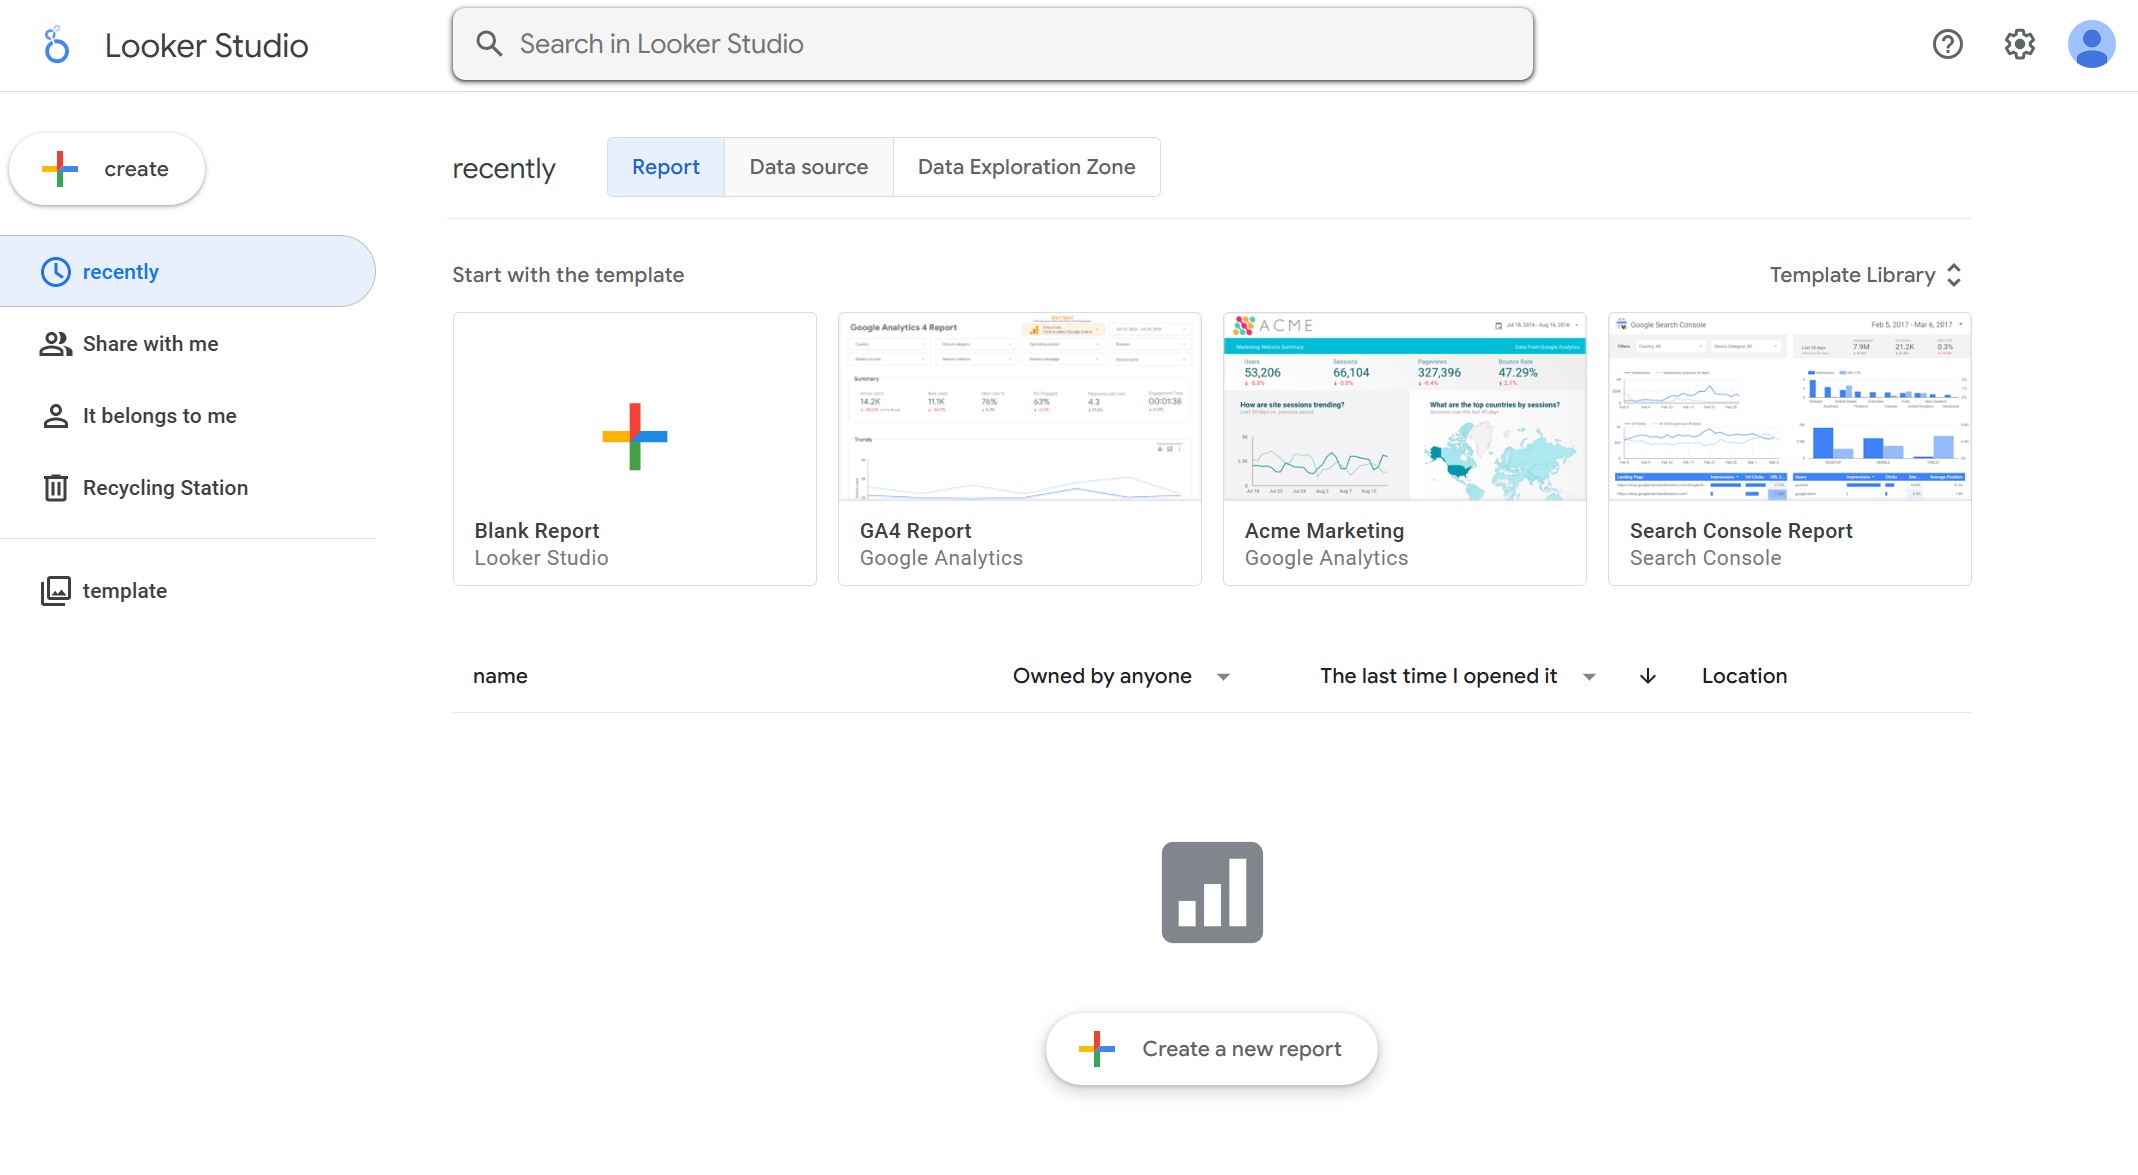 Looker Studio is often chosen because of accessibility and low entry cost. Some teams use it for branded client dashboards, especially in Google-centric environments. But white-label expectations need to be checked carefully against actual product delivery requirements.
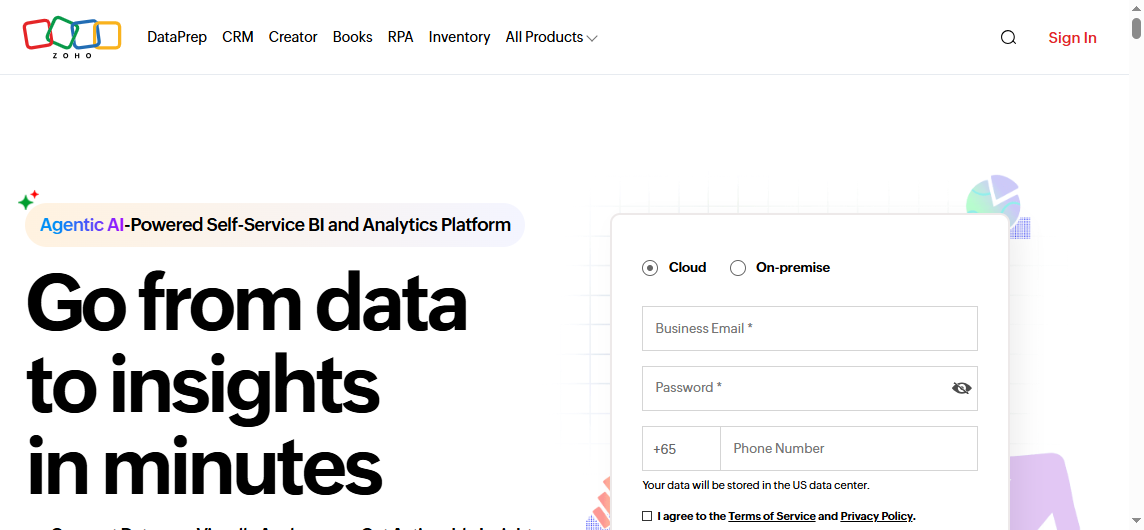 Zoho Analytics sits closer to BI than agency-only reporting products. It can be relevant for SMBs and SaaS vendors looking for a white-label BI layer with broader analytics capability than simple