Investment performance reporting is not just a monthly or quarterly output. For asset managers, investment teams, and operations leaders, it is the system that turns portfolio data into oversight, client communication, and decision support.
A strong framework helps teams standardize how they calculate returns, compare results with benchmarks, explain drivers, and communicate performance to internal stakeholders and investors. An even stronger framework adds an AI assistant layer on top of trusted reporting assets so teams can consume reports faster, generate structured narratives, and push exceptions to the right owners.
With FineReport + Dora, teams can ask for a report summary in chat, generate structured narratives from trusted report assets, receive scheduled briefings, and push exceptions to the right owner.
Click To Try The Dashboard
All reports in this article are built with FineReport
What an Investment Performance Reporting Framework Is and Why It Matters
An investment performance reporting framework is the operating model for how an investment organization measures, validates, presents, and distributes portfolio performance information.
For asset managers and investment teams, the purpose is straightforward:
create a consistent view of returns and risk
support oversight across mandates, portfolios, and managers
provide transparent investor reporting
make performance evaluation repeatable over time
Without a framework, reporting often becomes fragmented. Different teams use different data cuts, benchmark logic varies by report, commentary is written manually, and executives or clients receive inconsistent explanations. That weakens trust internally and externally.
A solid reporting framework improves three things immediately:
Decision-making
Portfolio managers and executives can identify what drove performance, where risk is building, and which mandates require attention.
Transparency
Investment committees, clients, and relationship teams receive consistent figures and clearer explanations.
Client confidence
Investors are more likely to trust a manager that delivers timely, understandable, and methodologically stable reporting.
The long-term value is even greater. Investment performance reporting links day-to-day oversight with strategic evaluation. Internal teams use it to monitor execution. Client-facing teams use it to explain outcomes. Leadership uses it to assess whether results align with mandates, objectives, and long-horizon expectations.
external communication through investor reports and periodic updates
long-term performance evaluation through benchmarked historical analysis, attribution, and trend review
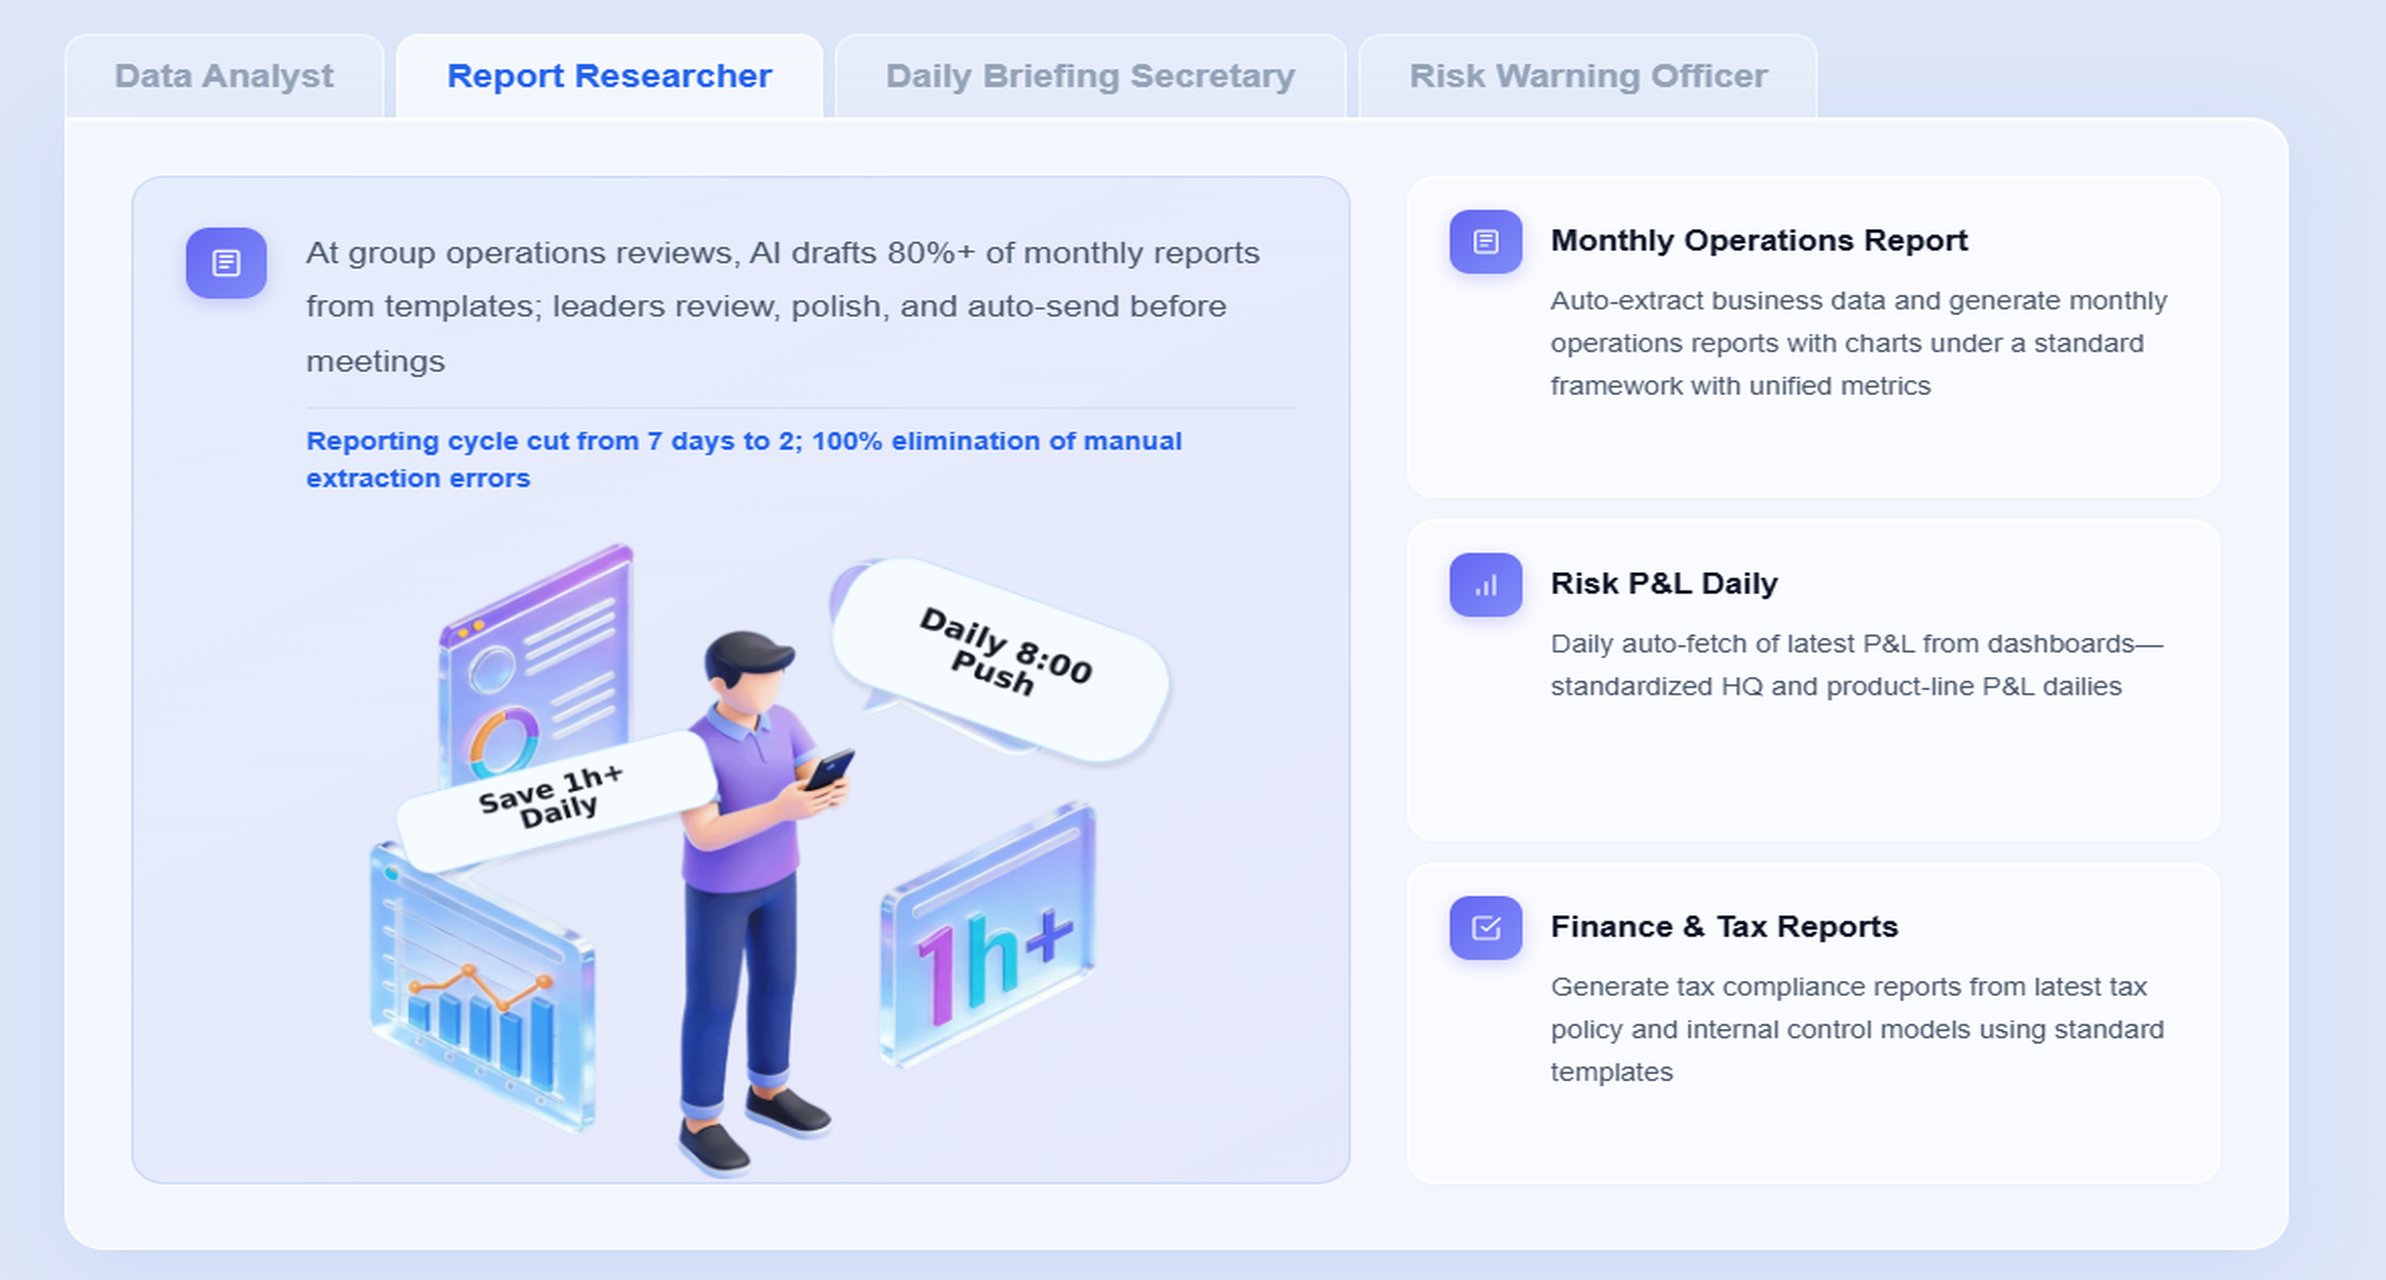
For executives, this is where reporting becomes more than compliance. A reporting framework becomes a repeatable business asset. Dora is not an AI experiment. It is a landed digital employee for recurring reporting work such as monthly management reports, performance summaries, benchmark exception alerts, and owner follow-up.
Core Components of Investment Performance Reporting
A reliable investment performance reporting framework starts with a clear separation between data inputs, calculation rules, validation controls, and presentation standards.
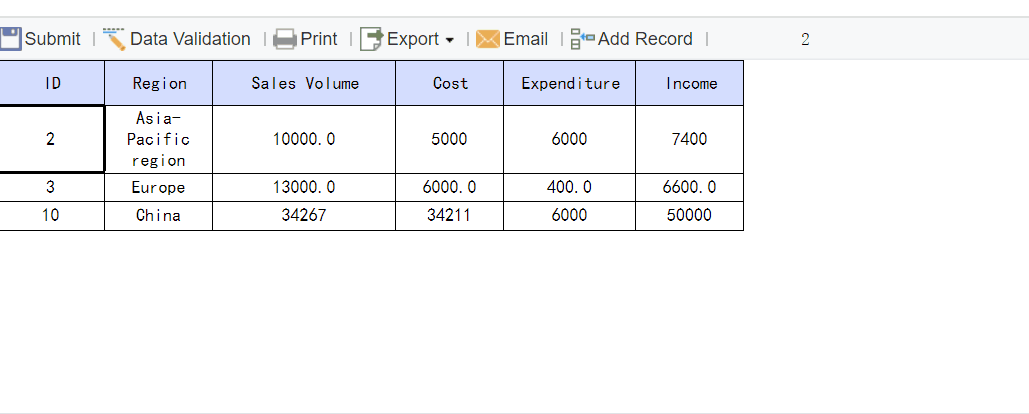
Portfolio data: Position, valuation, and exposure data used to calculate return and risk views. Business value: Creates the base record of what the portfolio owned and how it changed. AI use:Dora can retrieve the relevant FineReport performance view, summarize exposure changes, and explain which sections require review.
Benchmark data: Index or blended comparator data tied to a mandate or strategy. Business value: Provides context for whether returns were strong, weak, or simply market-driven. AI use:Dora can compare portfolio results with benchmark returns, explain excess return patterns, and highlight periods of benchmark drift.
Cash flows: Subscriptions, redemptions, contributions, withdrawals, and other movement data. Business value: Supports accurate return calculations and investor-experience views. AI use:Dora can explain the effect of large flows on reporting results and include them in a structured report summary.
Fees and expenses: Management fees, performance fees, custody costs, and related charges. Business value: Clarifies net performance and client-level economics. AI use:Dora can generate a fee impact explanation in plain language for executives or client service teams.
Attribution data: Allocation, selection, sector, security, or factor contribution data. Business value: Moves reporting beyond “what happened” to “why it happened.” AI use:Dora can summarize contribution drivers, identify detractors, and create management-ready narratives.
Calculation, Validation, and Presentation Are Different Jobs
Many firms treat investment performance reporting as one step. It is actually three:
Performance calculation
This is the rules engine for producing return numbers, benchmark comparisons, and attribution outputs. It includes time-weighted and money-weighted logic, fee treatment, valuation timing, and period handling.
Validation
This is the control layer. It confirms that the outputs are complete, reconciled, and methodologically consistent. It includes checks for missing prices, incorrect mappings, stale benchmarks, duplicate flows, or unexplained variances.
This is the reporting layer. It decides how different audiences see the results: dashboards, formatted reports, board packs, management summaries, investor statements, and exception notifications.
This distinction matters because many reporting failures happen not in the calculation itself, but in weak validation or poor presentation. FineReport is especially valuable here because it can standardize formatted reports, complex performance tables, operational cockpits, and reporting workflows on one trusted foundation.
Standardize Periods, Audiences, and Delivery Formats Early
This is where many teams overcomplicate. The goal is not infinite customization. The goal is controlled repeatability.
Metrics Every Asset Manager Should Include
The exact mix will vary by strategy, but a core investment performance reporting package should usually include the following.
Return measures across time horizons
Report Element: Returns across MTD, QTD, YTD, 1-year, 3-year, 5-year, and since inception periods. Business value: Gives stakeholders a complete short-, medium-, and long-term view. AI use:Dora can summarize which horizons show improvement or deterioration and explain the time-period relevance in chat.
Report Element: Gross and net return views where applicable. Business value: Separates investment outcome from fee impact. AI use:Dora can produce a clear management narrative on the difference between gross skill and net investor experience.
Report Element: Time-weighted versus money-weighted returns when needed. Business value: Helps distinguish manager performance from investor cash flow timing effects. AI use:Dora can explain which view is appropriate for a committee report versus a client review.
Report Element: Volatility, drawdown, Sharpe ratio, tracking error, or other strategy-appropriate risk measures. Business value: Prevents returns from being interpreted in isolation. AI use:Dora can summarize whether stronger returns were achieved with proportionate or disproportionate risk.
Report Element: Downside risk and period stress behavior. Business value: Shows resilience in difficult markets. AI use:Dora can flag mandates whose risk profile is diverging from expectations and push alerts to owners.
Attribution, contribution, and fee impact views
Report Element: Sector, asset class, region, manager, or security contribution. Business value: Identifies return drivers and detractors. AI use:Dora can generate chart explanations and structured summaries for performance review meetings.
Report Element: Allocation versus selection attribution. Business value: Helps isolate market exposure decisions from manager skill. AI use:Dora can answer natural-language questions such as “Was underperformance driven more by allocation or selection this quarter?”
Report Element: Fee and expense impact. Business value: Improves clarity for end investors and fiduciary review. AI use:Dora can include fee effects in a scheduled briefing for relationship managers.
Commentary that explains results in plain language
Report Element: Narrative commentary on performance, benchmark gap, risk behavior, and outlook considerations. Business value: Makes reports understandable to executives and clients who do not want raw analytics alone. AI use:Dora can generate a structured report summary from trusted FineReport assets, while keeping human review in place for sensitive communication.
Building Investment Performance Reporting and Benchmarking Into the Process
Benchmarking is not a report decoration. It is central to performance interpretation.
If the benchmark is poorly chosen or inconsistently applied, the rest of the investment performance reporting framework becomes less meaningful.
Set Benchmark Selection Rules Up Front
Benchmark selection should follow documented rules tied to:
mandate objective
strategy style
asset class mix
geographic exposure
investable opportunity set
currency and hedging treatment
rebalancing assumptions for blended benchmarks
This creates consistency across portfolios and reporting periods. It also reduces debate later when performance falls short or style drift appears.
For IT and reporting teams, this is where the AI era changes the role. IT moves from manually building every report to optimizing enterprise data connections, semantic layers, data quality, permission governance, report templates, and reusable agent Skills.
Create a Repeatable Comparison Methodology
A good comparison process should answer the same questions every reporting cycle:
What was the portfolio return?
What was the benchmark return?
What was the excess return?
Was the gap explained by market exposure, manager selection, or fee drag?
Did the result align with mandate objectives and expected style behavior?
When this methodology is standardized in FineReport, Dora can consume it reliably through a governed AI workflow rather than through ad hoc prompting against unstructured files.
Address Benchmark Drift and Multi-Asset Complexity
Real-world reporting gets messy when:
the benchmark no longer reflects the actual mandate
the portfolio spans multiple asset classes
custom blends are used
investor objectives differ across client segments
strategy constraints limit direct index comparability
Your framework should define how benchmark changes are approved, documented, and disclosed. It should also explain how blended and custom benchmarks are maintained over time.
How to Make Benchmark Comparisons More Useful
Match benchmarks to investor objectives rather than using generic market proxies
A broad market index may be convenient, but convenience is not the same as relevance. Benchmarks should reflect what investors actually expect the strategy to pursue.
Separate market effects from manager skill with attribution and excess return analysis
Excess return alone is not enough. If the portfolio lagged due to a deliberate defensive posture during a volatile period, that context matters. Attribution helps teams explain whether results came from allocation choices, selection quality, or risk control decisions.
Use benchmark context to explain underperformance, outperformance, and style differences
Benchmark comparison should make reports more useful, not more punitive. It should answer:
was the portfolio behaving as designed?
was underperformance temporary, structural, or process-related?
was outperformance consistent with the stated style?
Understanding Your Investment Performance Through Better Analysis
The best investment performance reporting frameworks do more than publish numbers. They help stakeholders interpret them.
That means moving from raw output to analysis that supports action.
Turn Performance Data Into Decisions
Portfolio managers, executives, relationship teams, and clients all consume performance differently.
Portfolio managers need deeper driver analysis.
Executives need concise insight into mandate health, risk, and exceptions.
Client-facing teams need clear explanations they can communicate with confidence.
Investors need understandable reporting tied to objectives and outcomes.
A useful framework supports all of them without rebuilding the analysis from scratch each time.
Analyze Trends Across the Right Dimensions
Your reporting framework should support trend analysis across:
market cycles
sectors and industries
mandates and strategies
portfolio managers
client segments
geographies
benchmark regimes
This matters because isolated monthly numbers rarely tell the full story. Strong analysis reveals patterns over time, such as repeated underperformance in a sector, improving risk-adjusted results after a process change, or fee drag becoming more material in a lower-return environment.
Highlight Exceptions and Drivers That Need Review
Not every variance requires escalation. The framework should define which issues do.
Examples include:
excess return outside expected range
sharp drawdown versus benchmark
fee impact materially above expectation
benchmark mismatch or unexplained drift
contribution concentration in a few names or sectors
unusual cash flow effects on investor returns
recurring validation breaks or stale inputs
This is where an operational cockpit becomes especially valuable. FineReport can present the status indicators, exception lists, and drill-down paths that investment operations and management teams need for daily oversight.
Look beyond top-line return. Separate market beta, allocation, selection, sector concentration, currency, and fees.
How did performance compare with objectives and benchmarks?
A positive return can still be disappointing if it lagged objective. A negative return may still be acceptable if risk was managed as intended during a difficult market.
Were results consistent with the stated strategy and risk profile?
This question catches style drift and unintended exposures early.
What actions should follow from the analysis?
Good reporting should lead to actions such as:
deeper mandate review
manager discussion
benchmark reassessment
client communication update
risk escalation
operational remediation
How an AI Data Agent Automates Report Consumption
Traditional investment performance reporting often breaks down at the last mile. Teams may have good dashboards and formatted reports, but users still spend too much time searching for the right version, interpreting charts manually, writing repetitive commentary, and following up on exceptions through email chains.
This is where Dora adds practical value as an enterprise Data Agent on top of trusted reporting assets.
FineReport remains the reporting foundation. It builds the trusted reports, operational cockpits, KPI definitions, permission structure, and reporting workflows. Dora turns that foundation into a scenario-specific AI assistant or AI digital employee for report consumption and follow-up.
These roles are valuable because investment teams do not just need static reports. They need fast interpretation, periodic briefing, anomaly detection, and follow-up.
“Summarize this month’s investment performance reporting package, compare each strategy with its benchmark, highlight mandates with abnormal drawdown or negative excess return, and list the owners who need follow-up.”
A governed 6-step Dora workflow
Retrieve trusted FineReport report or operational cockpit data Dora pulls the approved investment performance reporting package, benchmark comparison tables, attribution views, and exception lists from FineReport.
Understand KPI definitions, report templates, filters, business terms, and semantic rules Dora uses the governed semantic setup to interpret return horizons, net versus gross rules, benchmark assignments, mandate labels, and exception thresholds correctly.
Generate a structured report summary through chat Dora creates a management-ready summary of returns, excess return, attribution drivers, risk signals, and fee impact using the approved reporting structure.
Detect exceptions and anomalies Dora identifies portfolios with threshold breaches such as material underperformance, benchmark drift, unusual drawdown, delayed data validation, or attribution inconsistencies.
Push summaries, alerts, and suggested actions to responsible users
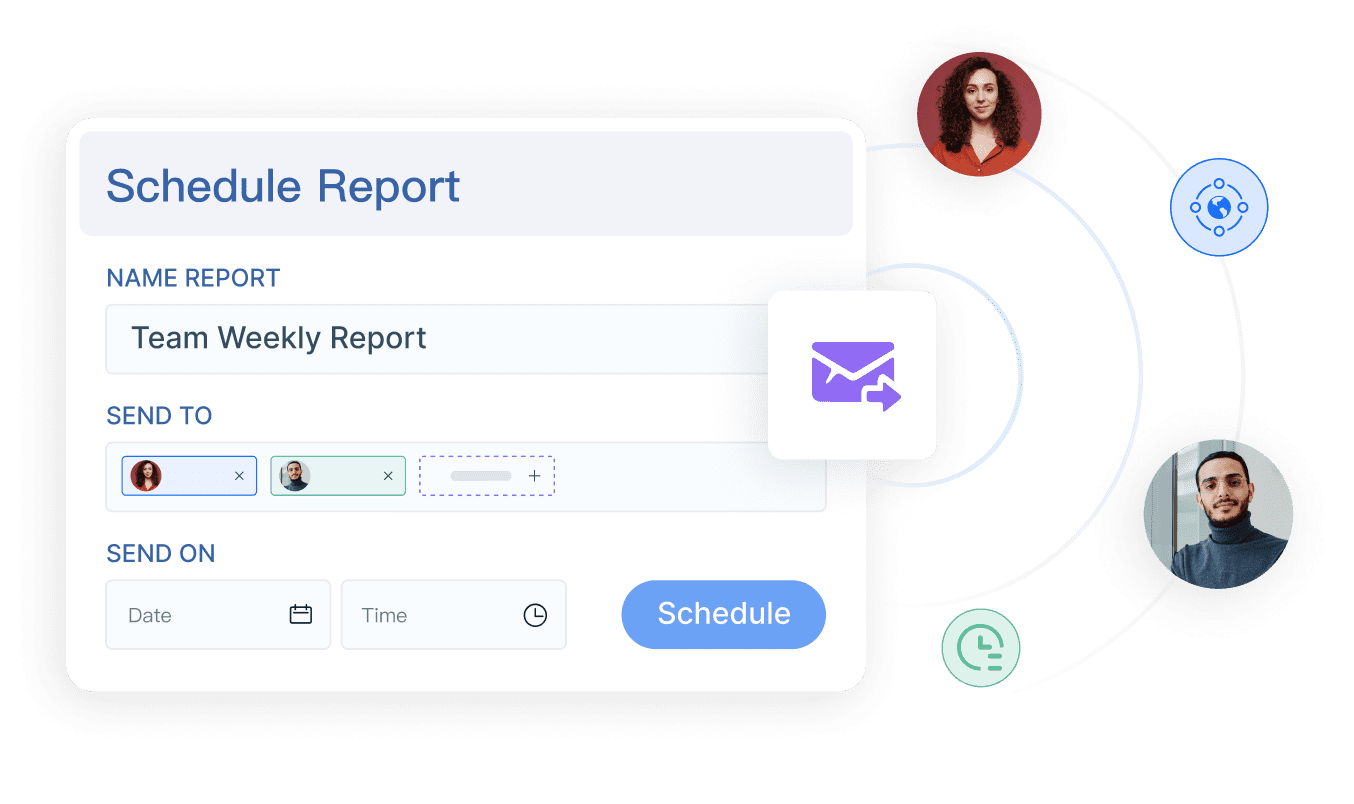
The relevant owners receive scheduled briefings or exception pushes, such as a strategy head getting a benchmark gap summary or operations lead getting a validation issue alert.
Produce follow-up records and periodic summaries Dora logs follow-up items, prepares daily or weekly oversight summaries, and supports review meetings with a consistent briefing trail.
[Insert AI Agent Demo Here: Show Dora generating a scenario-specific report summary, highlighting exceptions, and linking back to the FineReport source report]
Why this works in real enterprises
The key is that Dora is not working from random prompts alone. It works from trusted enterprise assets.
natural-language query over trusted reporting assets
chat-based AI assistant for report consumption
report, cockpit, metric, and exception retrieval
structured report summaries and chart explanations
scheduled summaries and daily or weekly briefings
exception alerts and push notifications
follow-up support through Skills-based execution
This approach has better enterprise landing capability than feature-only agent comparisons because it is based on governed reporting logic rather than raw model improvisation. It is also better suited for controllable and auditable workflows, helping reduce token waste, improve response speed, and increase workflow stability compared with raw prompt-only agents.
For business users, the value is immediate: Dora helps teams get timely report summaries, chat-based answers, scheduled briefings, and exception pushes without waiting for analysts or searching through reports.
Each has different detail requirements, approval paths, and sensitivity levels.
Distinguish the reporting purpose
Regulatory and fiduciary reporting
This requires methodological consistency, auditability, and clear control over how numbers are produced and approved.
Client communication
This requires clarity, transparency, and plain-language explanation. Clients need to understand not only the result, but also the context behind it.
Strategic relationship support
This is where reporting becomes a growth tool. Timely, credible, and insightful reports help strengthen retention, support review meetings, and reinforce trust during volatile periods.
Governance, Approvals, and Escalation Matter
Sensitive reporting issues should never depend on informal fixes. Your framework should define:
who owns the data inputs
who approves calculation rules
who reviews external-facing commentary
which exceptions trigger escalation
how benchmark changes are documented
how version control is maintained
This becomes even more important when AI is introduced. AI-generated report narratives should be used within a governed workflow, with human review expanding gradually as templates, semantics, and controls mature.
Common Reporting Mistakes to Avoid
Inconsistent data sources or calculation methodologies
If different teams report different answers, trust disappears quickly.
Overly technical reports that clients cannot interpret
Strong analytics fail if the audience cannot understand the message.
Missing narrative context around risk, benchmark changes, or unusual performance
Numbers without explanation create confusion, especially during underperformance.
Delays that reduce the relevance of the report
A technically correct report delivered too late still damages decision quality.
How to Implement and Improve Your Reporting Framework Over Time
The best reporting frameworks are phased, governed, and iterative.
Do not try to automate every reporting scenario at once. Start with the highest-value recurring reports and build from there.
1. Standardize report templates, KPI definitions, business terms, and exception rules
This is the base layer for both reporting consistency and AI usability. If return definitions, benchmark assignments, or commentary structure vary too widely, automation becomes unreliable.
2. Build a semantic layer inside the reporting workflow
This is an AI-specific best practice. Dora performs best when FineReport assets are mapped to clear business meaning such as benchmark rules, mandate terms, attribution logic, and exception thresholds.
3. Treat data quality as part of the AI implementation
Another AI-specific best practice. AI cannot compensate for stale valuations, incomplete cash flows, or poor benchmark mapping. Trusted output depends on trusted input.
4. Start with high-value recurring reports instead of automating everything
Monthly management packs, quarterly investor summaries, benchmark exception reviews, and underperformance follow-up are better starting points than highly bespoke one-off reports.
5. Preserve permission governance and use human review for sensitive narratives
AI outputs should respect FineReport access boundaries. For external communication, keep review workflows in place and expand Dora Skills gradually as trust and control mature.
Building this manually is complex. FineReport helps teams standardize trusted reports, operational cockpits, templates, and reporting workflows. Dora turns those assets into an AI assistant that can answer report questions in chat, generate structured summaries, push scheduled briefings, monitor exceptions, and follow up with responsible owners.
For investment performance reporting, that means teams can build a governed reporting foundation for:
FineReport + Dora is not only a reporting upgrade; it is a practical fourth-generation Agentic BI path.FineReport provides governed reports and operational cockpits. Dora provides the AI assistant layer for scenario execution, with more controlled Skills, lower token waste, faster execution paths, and more stable workflows than prompt-only agents.
Get Ready-to-Use Dashboard Templates in Fine Gallery
The strongest Dora pitch is scenario + product + service: FineReport provides the trusted reporting foundation, Dora provides the AI digital employee, and implementation service connects data, governance, semantic setup, Skills, report templates, permissions, and rollout.
For executives, the value is concrete. This is a practical way to reduce manual reporting effort, improve reporting timeliness, strengthen oversight, and make investment performance reporting easier to consume and act on across the enterprise.
An investment performance reporting framework is a structured approach for collecting data, calculating returns, validating results, and presenting performance consistently. It helps investment teams turn portfolio data into reliable oversight, client reporting, and decision support.
A strong report usually includes portfolio returns, benchmark comparisons, cash flow effects, fees, attribution, and key risk indicators. It should also provide clear commentary that explains what happened and why.
Time-weighted return removes the impact of external cash flows and is commonly used to evaluate manager performance. Money-weighted return reflects the timing of contributions and withdrawals, so it better represents the investor’s actual experience.
Benchmarks give performance results context by showing whether returns came from manager decisions or broader market movements. They also support fair comparisons across portfolios, mandates, and reporting periods.
AI can speed up report consumption by summarizing trusted reporting assets, generating draft narratives, and flagging exceptions for review. When paired with governed data and tools like FineReport and Dora, it can reduce manual effort without replacing reporting controls.
Product Trial
FineReport
Pixel-perfect reports · Interactive dashboards · Easy data entry · Digital twins