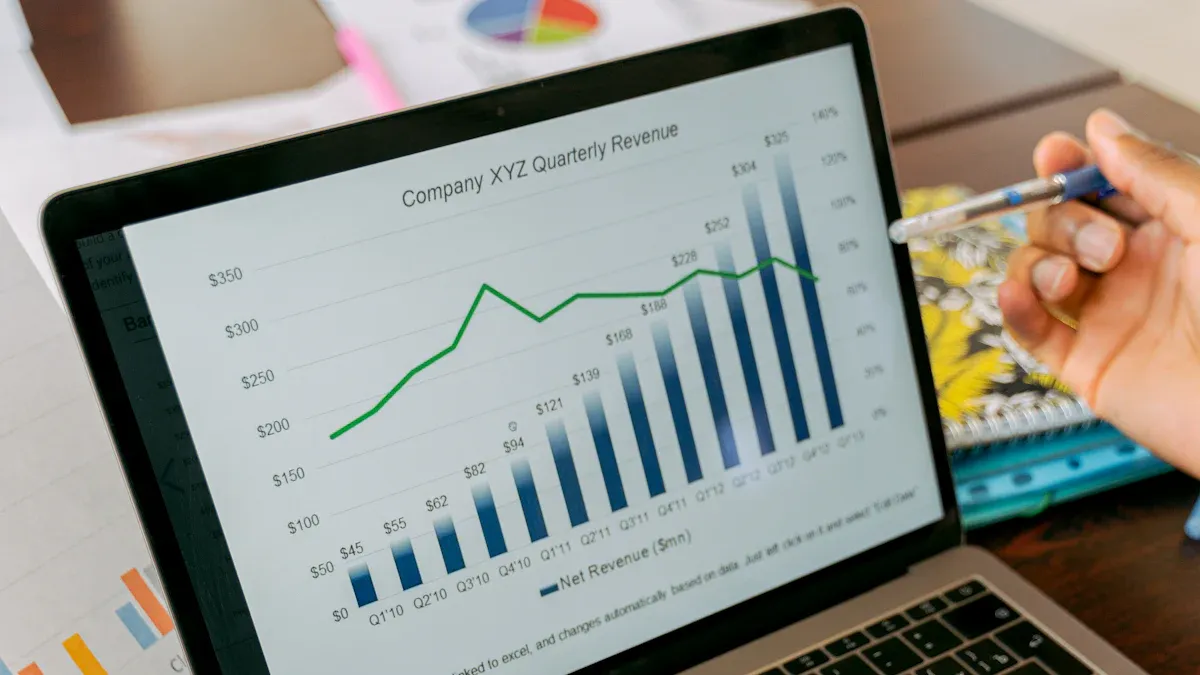
A crm kpi dashboard shows how your business is doing. It tracks important numbers from crm activities. You can see sales results, marketing progress, and customer support data in one place. This helps you notice patterns and find ways to get better. Experts say crm dashboards help you see the customer journey and check if campaigns work well. This helps you make smarter choices. FineReport from FanRuan lets you connect your data and make a kpi dashboard easily. This helps you act fast and make customers happier.
CRM KPI Dashboard Basics
What Is a CRM KPI Dashboard
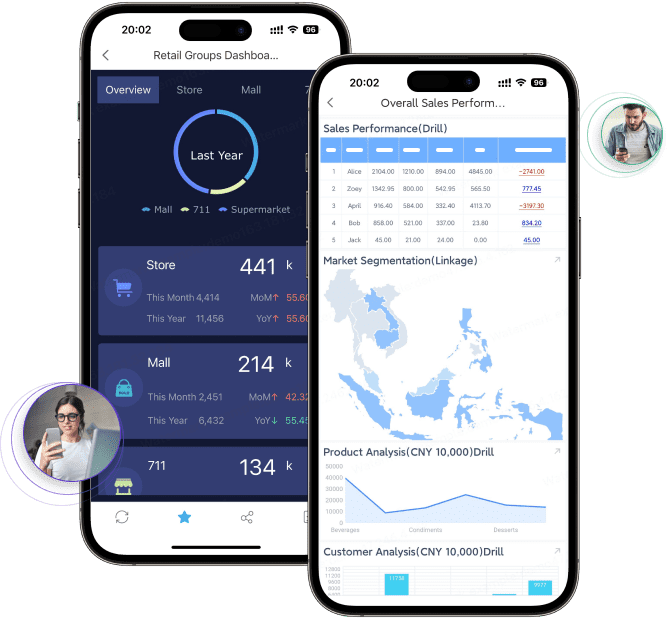
A crm kpi dashboard helps you see how your business is doing. It puts important data from your crm system in one place. You can check sales numbers, marketing results, and customer support details together. The dashboard uses charts, graphs, and tables to show information. You can add widgets to make the dashboard fit your needs. Real-time updates keep your dashboard up to date. You can connect the dashboard to other tools like email or e-commerce platforms. This setup lets you track kpi and find trends fast.
- Data visualizations help you see patterns and trends.
- Customizable widgets let you change the dashboard.
- Real-time updates keep your information new.
- Integration connects your dashboard to other business tools.
Why CRM Dashboards Matter
A crm dashboard helps you make good decisions. You see all your crm metrics in one spot. You can track sales, marketing, and support kpi. You can find problems and ways to do better. The dashboard gives you real-time insights into your sales pipeline and team activity. You can understand customer behavior and see how marketing campaigns change revenue. You use analytics to check if campaigns work and change your strategy.
Here is a table that shows common kpi dashboard metrics for different functions:
| Function | Common KPIs |
|---|---|
| Sales | Number of new leads, Pipeline value, Deal stage progression, Sales quota vs actual revenue, Win/loss ratio, Activity metrics (calls, meetings, emails) |
| Marketing | Lead source breakdown, Cost per lead (CPL), Email open and click-through rates, Campaign ROI, Website traffic and form submissions, MQL volume |
| Customer Support | Number of open vs resolved tickets, First response time, Average resolution time, Customer satisfaction (CSAT), Net Promoter Score (NPS) |
| Executive | Total revenue and pipeline growth, Customer acquisition cost (CAC), Customer lifetime value (CLV), Team performance summaries, Campaign ROI and goal tracking |
You use a crm kpi dashboard to check sales performance, understand customer behavior, and track marketing results. This dashboard helps you act quickly and make your business better.
How CRM KPI Dashboards Work
Key Features of CRM Dashboards
A crm dashboard helps you see how your business is doing. You can check important numbers and see how your team works. The dashboard shows sales, marketing, and customer support data. You can look at charts, graphs, and tables to understand the numbers. Many dashboards let you change the layout and add widgets you need.
Here is a table that shows the main features you should look for in a crm dashboard:
| Feature | Description |
|---|---|
| Real-time Reports | Track crm metrics as they happen for up-to-date insights. |
| Customizable CRM Dashboards | Create reports that match your unique crm data needs. |
| Integration Capabilities | Export data to other tools and connect with platforms like Google Sheets. |
| AI Data Entry | Collect more complete data for reliable reporting. |
| API and Webhooks | Connect with internal and third-party tools for advanced kpi tracking. |
These features help you make a dashboard that fits your business. Real-time reports let you spot trends quickly. Customization helps you focus on the most important numbers. Integration lets you share data with others in your company. AI data entry and APIs keep your information correct and current.
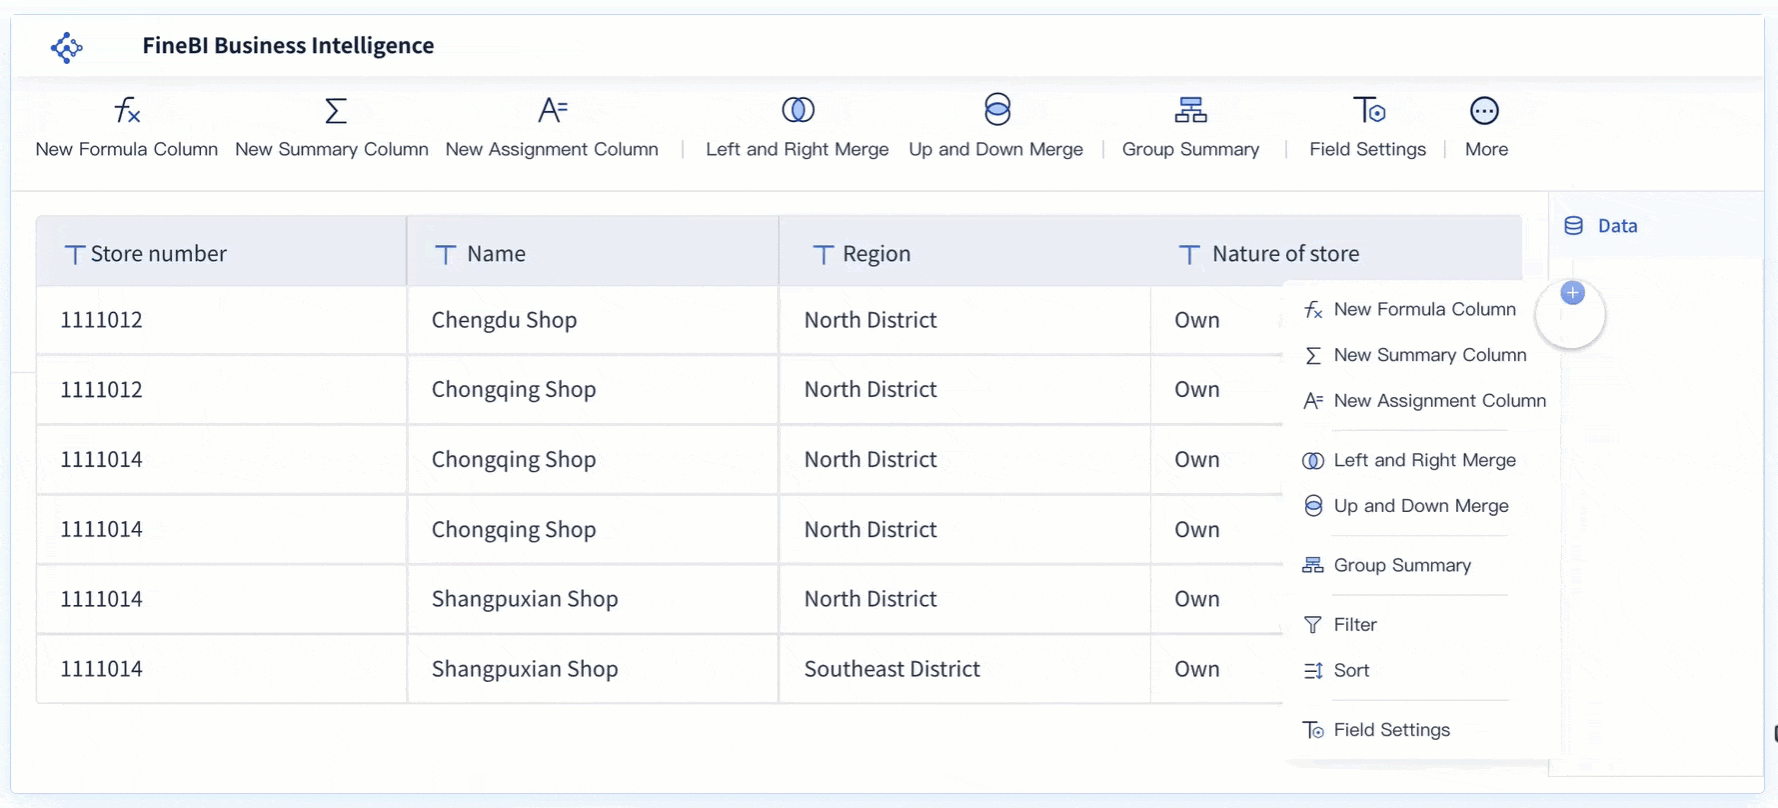
Data Integration with FineReport
FineReport from FanRuan lets you bring all your crm data together. You can connect to many data sources and see everything in one place. FineReport works with both structured and unstructured data. You can use data from databases, spreadsheets, and cloud services. You can also link your crm dashboard to ERP and IoT systems.
Here is a table that shows how FineReport makes data integration simple:
| Feature | Description |
|---|---|
| Unified Platform | Combine multiple data sources into one dashboard. |
| Real-Time Data Synchronization | Keep your data fresh with real-time updates and automated reporting. |
| Integration Support | Connect with databases, ERP, crm, IoT, and cloud services. |
| Self-Service Analytics | Use drag-and-drop tools to explore your data and build custom dashboards. |
| Custom Dashboard Creation | Design dashboards that show the insights you need for your business. |
You can connect FineReport to over 500 data sources. This means you can use data from almost any system. The platform helps you automate reports, so you do not have to do it by hand. Automated reporting updates as work happens, which lowers mistakes and saves time. Your team can spend more time looking at results instead of gathering data.
- FineReport connects to over 500 data sources.
- It works with both structured and unstructured data.
- You can link systems like ERP and crm for a full view.
Real-Time KPI Tracking
Real-time kpi tracking lets you see how your business is doing right now. You can watch your numbers change as new data comes in. This helps you act fast if there is a problem or a new chance. For example, if you see sales drop, you can fix it quickly.
To set up real-time kpi tracking, you need a platform that collects and checks data right away. FineReport gives you these tools. You can set up data flows, so your dashboard always has the newest numbers. The system checks your data to keep your kpi dashboard correct.
Here are the steps to set up real-time kpi tracking:
- Pick a platform that does real-time analytics and lets you change dashboards.
- Connect all your data sources, like databases, spreadsheets, and APIs.
- Set up automatic data flows to keep your dashboard current.
- Check your data links often to make sure your numbers are right.
- Use the dashboard to get quick insights and make fast choices.
Seeing crm kpi dashboard metrics in real-time helps your business react faster. You can change your plans as soon as you see something new. Leaders get the latest information, which helps them make better choices. Watching your data all the time helps you do better and reach your goals sooner.
Automated reporting in your crm dashboard also cuts down on manual work. You do not need to pull data or make reports by hand. The system does it for you, which saves time and lowers stress. Your team can use analytics to get better results, not just collect numbers.
Essential CRM KPIs to Track
You need to watch the right key performance indicators. This helps you get the most from your crm kpi dashboard. FineReport lets you change dashboards for sales, marketing, and support. You can pick KPIs that fit your business needs with FanRuan solutions. This makes it easy to focus on the metrics that matter most.
Sales KPIs
Sales metrics show how your team is doing. They help you guess future results. You can use a sales crm dashboard to check pipeline health, revenue, and activity. There are three main types of sales KPIs:
- Pipeline Health Metrics: Deal speed, pipeline coverage, stage conversion rates, pipeline aging.
- Revenue Performance Indicators: Monthly revenue, average deal size, win rate, revenue per sales representative.
- Sales Activity Tracking: Call volume, email engagement, meeting conversion rates, follow-up consistency.
You can use these KPIs to balance guessing with past results. This helps you find useful insights and not just hope for good outcomes. Here is a table with common benchmarks for sales KPIs in different industries:
| KPI | Benchmark Range |
|---|---|
| Revenue Growth | 10–20% |
| New Business Revenue | ~30% of total revenue |
| Recurring Business Revenue | ~70% from repeat purchases |
| Customer Satisfaction Rate | 70–90% |
| Sales Cycle Length | 3-6 months |
Tracking these numbers helps you see progress and get better return on investment.
Marketing KPIs
Marketing KPIs help you see how well your crm dashboard supports your campaigns. You can use analytics to measure ROI and make your strategy better. Here is a table with important marketing KPIs:
| KPI | Description |
|---|---|
| Customer Acquisition Cost (CAC) | Measures the total cost to get a new customer. |
| Customer Lifetime Value (CLV) | Estimates total money from a customer over their relationship. |
| Conversion Rate | Shows the percent of leads that become paying customers. |
| Customer Retention Rate | Measures the percent of customers you keep over time. |
| Customer Satisfaction Score (CSAT) | Checks how happy customers are with your service. |
You can use these metrics to track lead conversion rate and make your marketing better.
Customer Support KPIs
A crm dashboard shows customer service data in real-time. You can track open vs resolved tickets, first response time, and average resolution time. Customer satisfaction scores like CSAT or Net Promoter Score show how well your team meets expectations.
You can use a kpi dashboard to watch support metrics and make quick changes. FineReport lets you change dashboards for different teams, so you always see the data that matters.
Benefits of CRM KPI Dashboards
Improved Visibility and Insights
When you use a crm kpi dashboard, you see your business clearly. The dashboard changes raw data into useful information. You can see sales numbers and pipeline health right away. Your team stops guessing and starts using facts. You notice deals that are stuck and fix bad forecasts fast. The crm dashboard helps you watch sales numbers and keep your pipeline organized. This makes your team work better and guess results more accurately. You earn more money because of these improvements.
- The dashboard helped raise annual revenue by $12.8M, which is an 8% increase.
- Reporting time went down by 95%, saving 40 hours each month.
- Forecast accuracy got better by 15-20%, so variance dropped from 30-40%.
Better Team Alignment
A kpi dashboard keeps your team working together. It puts important numbers for sales, marketing, and support in one place. Everyone sees the same data and knows the goals. You make choices faster because you all share the same view. The dashboard lets all team members check tracking data on a shared platform. You work toward the same goals and understand what customers want. This helps your team give a more personal touch and stay focused.
Data-Driven Decisions
You make better choices when you use data and analytics. The kpi dashboard gives you the info you need to act fast. You measure business results with metrics like user adoption rate, customer satisfaction score, lead conversion rate, sales cycle length, customer retention rate, revenue growth, net promoter score, and data quality metrics. You check customer lifetime value and how fast support tickets get solved. You also watch cross-selling and upselling rates.
| KPI | Definition | Why It Matters |
|---|---|---|
| Lead conversion rate | Percentage of leads that turn into customers | Shows if sales steps work well |
| Sales cycle length | Average time to close a deal | Shorter cycles mean sales are more efficient |
| Customer retention rate | Customers who keep doing business with you | Keeping customers costs less money |
| Revenue growth | Increase in revenue over time | Shows your business is doing well |
You check roi by looking at benefits and costs. You track customer lifetime value and cost per acquisition to see if you get good results. You use a sales crm dashboard to make better choices and improve your plans.
Customizing Your CRM KPI Dashboard with FineReport
Personalization and User Roles
You can make your crm dashboard fit your team’s needs with FineReport. The drag-and-drop design lets you build dashboards without writing code. You choose what to show and how to show it. You can add charts, tables, and filters that help your team see the most important data. FineReport gives you control over who sees what. You set up user roles so each person gets the right view. Sales teams can see sales numbers. Support teams can check ticket status. Managers can track overall progress. You can also use mobile access to check your dashboard anywhere. This helps you stay connected and make decisions on the go.
Best Practices for KPI Dashboards
You get the best results when you follow smart steps for your kpi dashboard. Here are some tips:
- Pick the most important metrics for your crm.
- Group related data together for easy reading.
- Use the right charts and colors to highlight key points.
- Keep your dashboard clean and simple.
- Let users filter and drill down for deeper insights.
- Make sure your dashboard works well on computers and mobile devices
Avoiding Common Pitfalls
You can avoid mistakes by keeping your dashboard focused and clear. Here are some things to watch out for:
- Do not add too many widgets. Stick to 5–7 key metrics.
- Use both historical and real-time data for a full picture.
- Build reports around the most important kpi.
- Test your dashboard on phones and tablets.
- Ask users for feedback and give training.
- Clean your data before you start and check for errors often.
When you use FineReport, you get a scalable and secure crm dashboard. You can customize it for your business and keep your data safe. The platform works well with the FanRuan ecosystem, so you can grow and change as your needs do.
You make your business better when you track the right KPIs in your CRM dashboard. FineReport lets you build dashboards that match your team and industry. First, pick the most important metrics. Check the table below to help you choose:
| Area | KPI | Why It Matters |
|---|---|---|
| Sales | Lead Conversion Rate | Predicts revenue |
| Customer Service | CSAT Score | Measures customer happiness |
| Marketing | Customer Acquisition Cost | Shows cost to gain new customers |
Try changing your dashboard for real-time updates and layouts for each role. Start your project by finding KPIs and using FineReport’s easy steps.


FAQ

The Author
Lewis Chou
Senior Data Analyst at FanRuan
Related Articles

Portfolio Reporting for PMOs: 9 Executive Metrics Every Weekly Portfolio Dashboard Should Include
Weekly portfolio reporting should help executives answer three questions fast: Are we delivering the right initiatives, are we putting outcomes at risk, and what decisions need leadership this week? For PMOs, that means
Yida Yin
Jul 01, 2026

How to Build an Investment Portfolio Reporting Dashboard for Executives: KPIs, Benchmarks, and Drill-Down Views
Investment portfolio reporting for executives is not about showing every holding, transaction, and chart your investment team can produce. It is about giving CEOs, CFOs, CIOs, boards, and investment committees a fast, re
Yida YIn
Jun 25, 2026

12 KPI Reporting Examples for Executive Dashboards: What to Show in Weekly, Monthly, and Quarterly Reviews
Executive leaders do not need more data. They need decision ready $1 examples that match how often they review the business and what actions they are expected to take. A weekly $1 should surface fast moving risks and per
Yida YIn
Jun 25, 2026