Self-service BI helps business teams access, analyze, and visualize data without depending on IT for every report request. For finance leaders, sales managers, marketing teams, and operations directors, that means fewer reporting bottlenecks, faster answers, and more confident day-to-day decisions. Instead of waiting days or weeks for static reports, users can explore trusted data on their own, drill into root causes, and act while the information is still relevant.
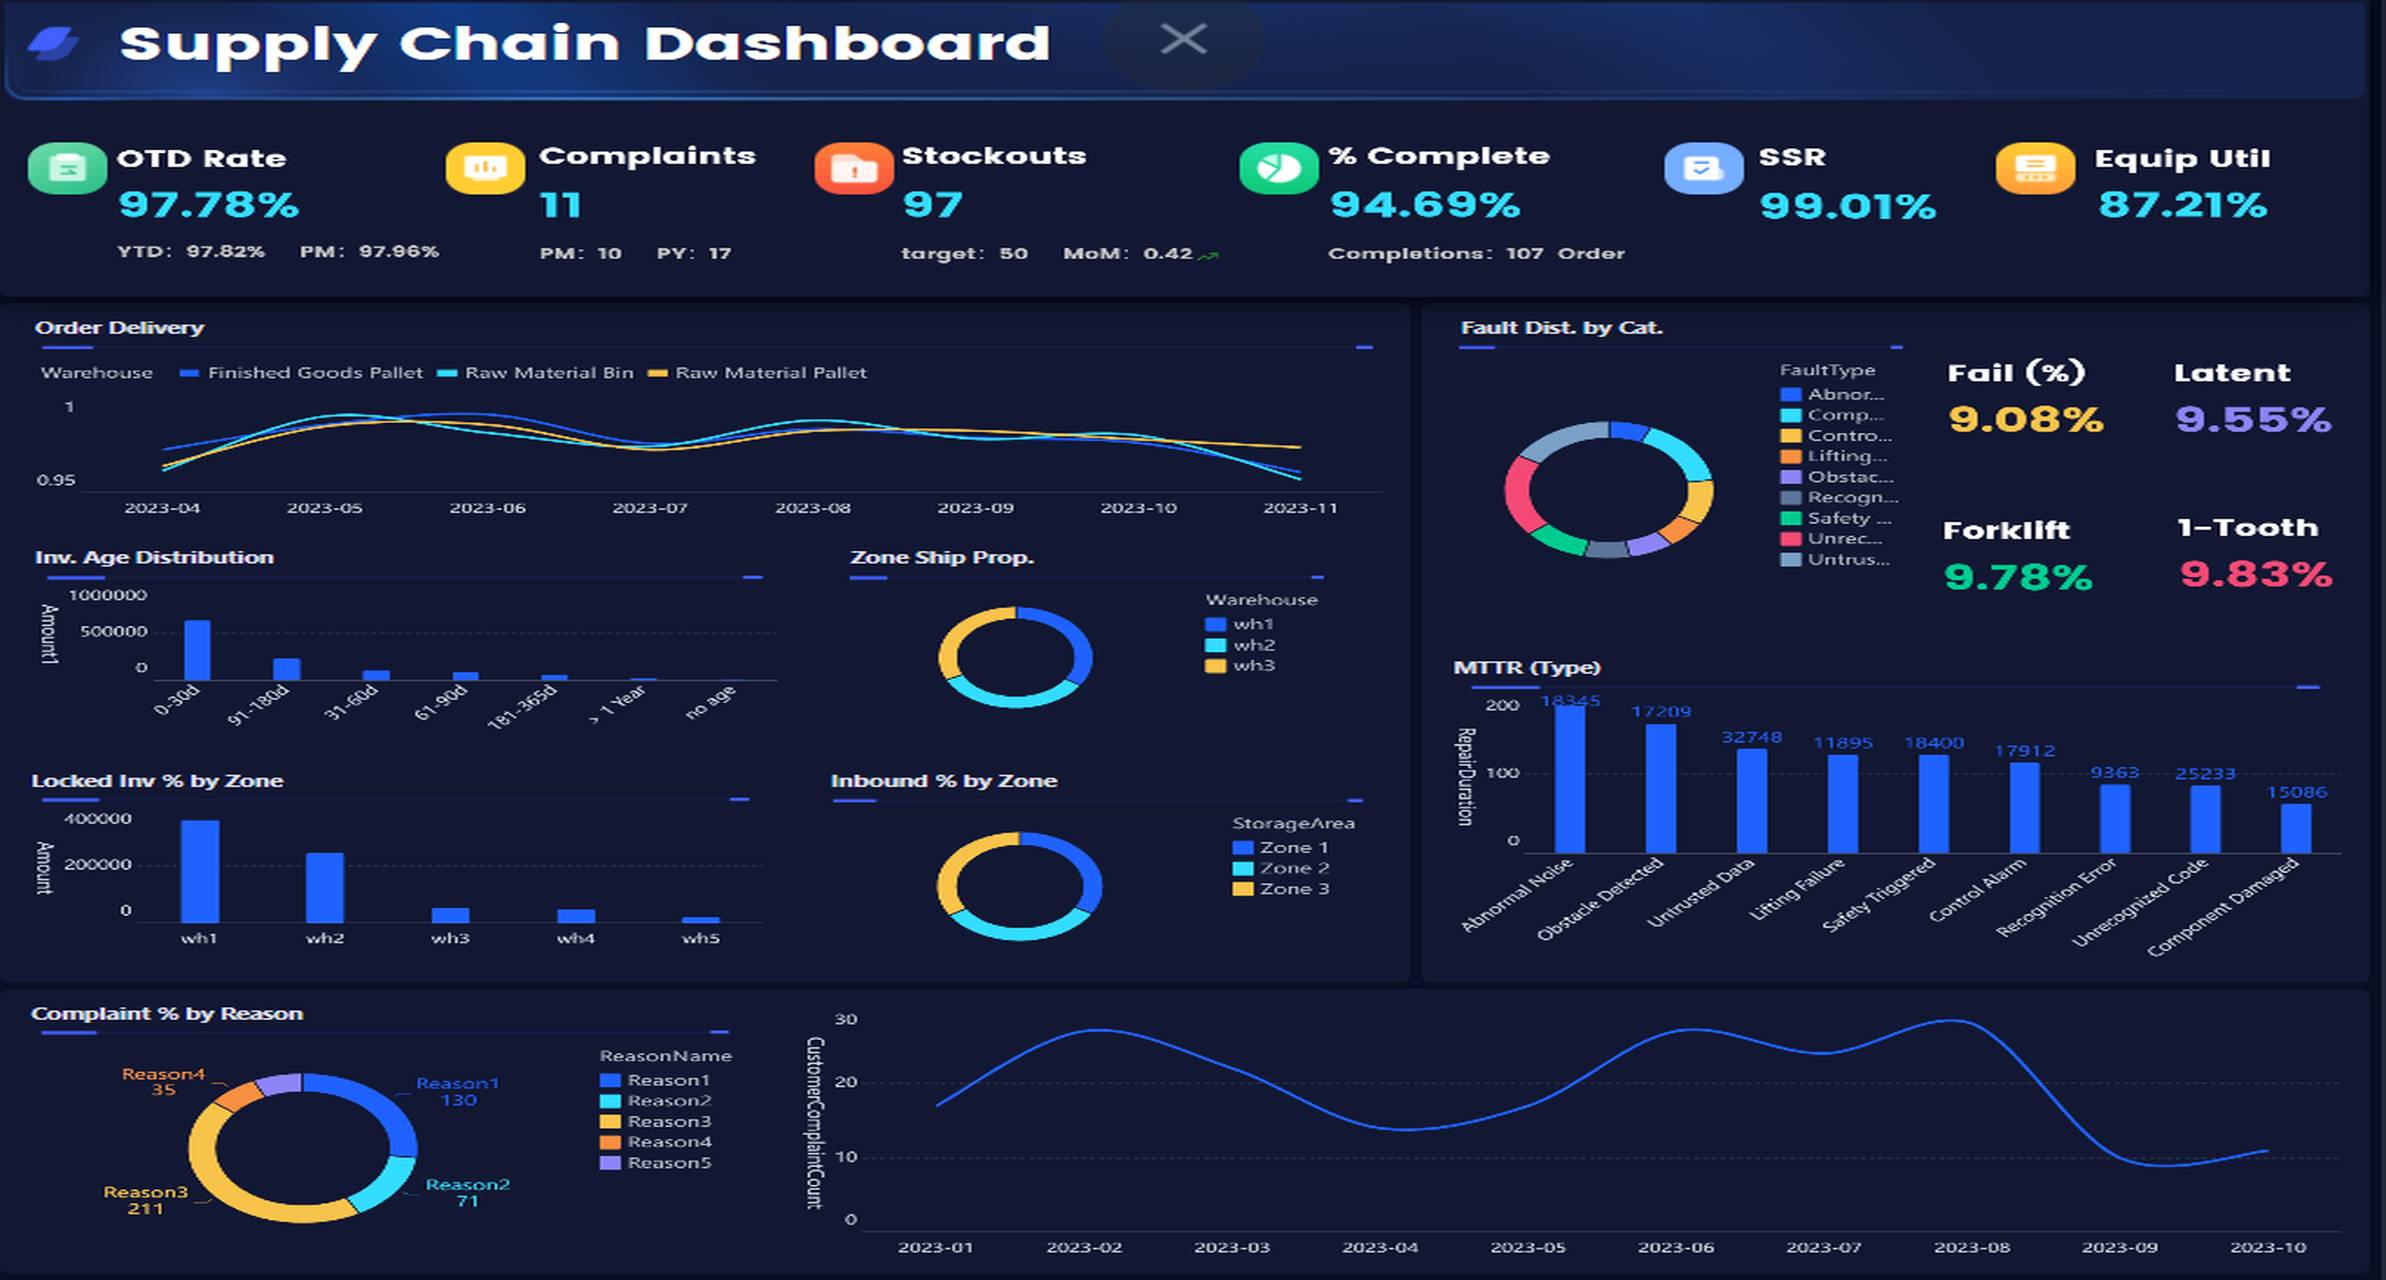
All dashboards in this article are built with FineBI.
Self-service BI is a business intelligence approach that gives non-technical users the ability to work with data through dashboards, reports, filters, and visual analysis tools. In plain language, it means business users can answer many of their own questions without submitting every request to a central BI or IT team.
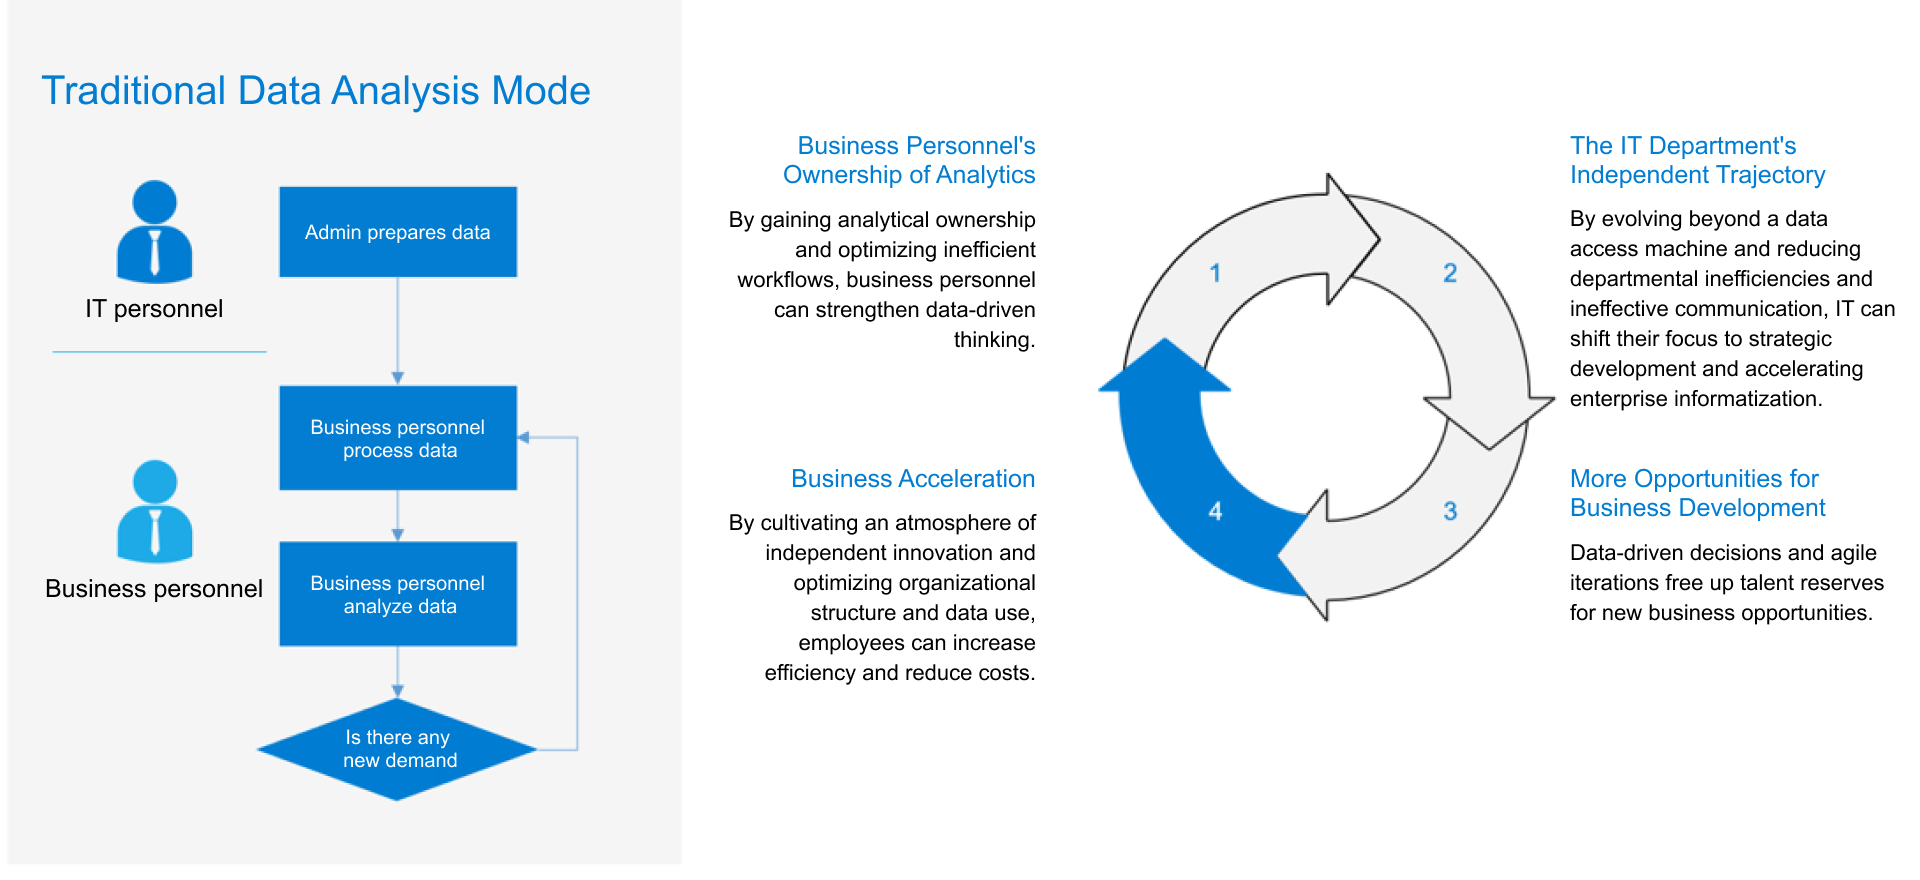
Traditional reporting is usually IT-led. A department asks for a report, waits for data extraction, waits again for dashboard design, then receives a static output that may already be outdated by the time it arrives. Self-service BI changes that model. IT and data teams still play a critical role, but they focus more on preparing trusted data, setting governance rules, and supporting scalable analytics rather than manually producing every report.
Who uses self-service BI?
Self-service BI is used by a wide range of roles across the business:
Finance teams for budget tracking, variance analysis, profitability review, and forecasting
Sales leaders for pipeline monitoring, quota progress, and regional performance
Marketing teams for campaign ROI, lead quality, attribution, and audience analysis
Operations managers for inventory, fulfillment, service levels, and process efficiency
Executives for consolidated performance monitoring and faster review cycles
The best self-service BI environments serve both casual users who need quick dashboard access and advanced users who want deeper exploration.
What questions does self-service BI help answer?
Self-service BI is designed for practical business questions such as:
Why did revenue decline in one region last month?
Which campaigns are producing the highest-quality leads?
Where are cost overruns happening by department or cost center?
Which warehouse is driving fulfillment delays?
Which product categories are generating the strongest margins?
These are not abstract analytics exercises. They are operational questions tied directly to revenue, cost, risk, and customer performance.
Where does it fit in daily decision-making?
Self-service BI sits in the middle of daily and weekly decision cycles. Teams use it to:
Monitor KPI trends
Investigate exceptions
Compare actuals to targets
Review performance by segment, region, product, or time period
Align departments around one shared view of performance
That is why self-service BI matters. It improves access to trusted insights, reduces dependency on manual reporting, and broadens data adoption across the organization.
Core Benefits and Best Practices for Adopting Self-Service BI
A strong self-service BI strategy is not just about giving users a dashboard tool. It is about creating an environment where people can move quickly without compromising consistency, security, or trust.
Core benefits of self-service BI
Self-service BI delivers value in three areas: speed, flexibility, and alignment.
Faster decision-making: Users can answer routine business questions immediately.
Less pressure on IT and BI teams: Technical teams can focus on data modeling, governance, and advanced analytics.
More agile reporting: Teams can adapt dashboards to new business conditions without long development cycles.
Higher data adoption: More users engage with data when tools are intuitive and accessible.
Better cross-functional collaboration: Shared dashboards reduce conflicting interpretations of performance.
Key Metrics (KPIs) for a successful self-service BI program
To make self-service BI effective, organizations should monitor both business and adoption KPIs.
Report turnaround time: How long it takes users to get answers to reporting questions.
Dashboard adoption rate: Percentage of target users actively using dashboards.
Self-service query volume: Number of analyses completed without IT intervention.
Data trust score: User confidence in the accuracy and consistency of dashboards.
KPI definition consistency: Degree to which teams use shared metric definitions.
Time-to-insight: How quickly users can move from question to actionable conclusion.
Reuse rate of certified dashboards: Frequency with which approved dashboards or data models are reused.
Reduction in ad hoc reporting requests: Decrease in manual report requests sent to BI or IT teams.
Decision cycle speed: Improvement in weekly, monthly, or quarterly review timelines.
Governance compliance rate: Adherence to role-based access, security, and data quality rules.
The right balance: user freedom and data governance
The biggest mistake in self-service BI adoption is treating it as unrestricted access to everything. That usually leads to duplicate reports, conflicting numbers, and low trust.
A better model is governed self-service BI. In this model:
IT or data teams prepare and certify trusted data sets
Business users build or customize dashboards on top of those governed data assets
Shared definitions standardize metrics like revenue, gross margin, conversion rate, or inventory turnover
Quality standards ensure the data is timely, complete, and understandable
This balance gives users flexibility at the reporting layer while protecting the integrity of the data foundation.
Best practices for adopting self-service BI
Here are the most practical best practices for enterprise rollout:
Start with high-value use cases
Focus first on reporting bottlenecks that affect revenue, cost control, or operational efficiency.
Build reusable data models and dashboards
Avoid one-off reporting chaos by creating standard templates that teams can customize.
Train users by role
Finance, sales, marketing, and operations teams ask different questions. Training should reflect those workflows.
Certify trusted data sources
Make it easy for users to know which dashboards, dimensions, and KPIs are official.
Create ongoing support loops
Self-service BI works best when business users can get help with data interpretation, dashboard design, and governance questions.
Common concerns and how to reduce risk
Many organizations hesitate because they worry self-service BI will create data confusion. That concern is valid, but manageable.
Common issues include:
Too many versions of the same report
Misunderstood KPI definitions
Inconsistent filters and logic
Low adoption due to poor usability
Security concerns around sensitive business data
These risks drop significantly when the platform is easy to use, the data model is well designed, and support is built into the rollout. FineBI is often a practical fit here because it combines interactive self-service analysis with governed dashboard distribution, making it easier to scale business access without losing control.
Real-World Self-Service BI Use Cases in Finance
Finance is one of the strongest functions for self-service BI because reporting delays directly affect planning, cost control, and executive decision-making.
Budgeting, variance analysis, and forecasting
Finance teams use self-service BI to monitor actuals versus budget in real time instead of waiting for month-end consolidation reports. With interactive dashboards, users can drill into:
Departments
Cost centers
Time periods
Business units
Expense categories
This makes variance analysis faster and more precise. A finance manager can quickly identify whether overspending is isolated to one department, tied to a seasonal pattern, or driven by a specific vendor or project.
Self-service BI also improves forecasting. Instead of relying on static spreadsheets passed between teams, finance users can compare historical trends, current actuals, and forecast assumptions in one place. Scenario analysis becomes more practical when the data is already connected and visualized.
Cash flow, profitability, and executive reporting
Cash flow visibility is essential for stable operations. Self-service BI allows finance leaders to monitor liquidity, receivables, payables, and working capital through live or near-real-time dashboards.
Profitability analysis is another high-value use case. Teams can review margin trends by:
Product line
Customer segment
Region
Channel
Period
That supports better pricing decisions, cost management, and portfolio optimization.
Executive reporting also becomes much more efficient. Instead of building separate slide packs manually every month or quarter, finance can maintain a set of dynamic dashboards for leadership. Executives can view summary-level performance and drill into details only when needed.
Real-World Self-Service BI Use Cases in Sales and Marketing
Sales and marketing teams operate in fast-moving environments where delayed reporting leads directly to missed opportunities and wasted spend. Self-service BI supports continuous optimization.
Sales pipeline, revenue tracking, and territory performance
Sales leaders need a current view of pipeline health, not a report that was accurate three days ago. With self-service BI, teams can analyze:
Pipeline value by stage
Conversion rates by rep or region
Quota attainment
Win rates
Average deal size
Sales cycle length
Territory performance is especially important for distributed sales teams. Managers can compare regions, identify underperforming segments, and redirect support faster. Individual reps can also use dashboards to prioritize accounts, track target progress, and spot stalled opportunities.
This is where self-service BI outperforms static CRM reporting. Users can filter by period, product, team, or market segment without submitting a custom report request each time.
Campaign performance, attribution, and customer insights
Marketing teams need to understand not just which campaigns generated activity, but which ones drove qualified leads, conversions, and revenue. Self-service BI helps answer questions such as:
Which channels deliver the best ROI?
Which campaigns produce the highest-quality leads?
Where are cost per lead and conversion rates improving or declining?
Which audiences are responding best to messaging?
By combining campaign, web, CRM, and customer data, marketers can evaluate performance across the full funnel. Attribution analysis becomes more practical when dashboards show channel contribution, influenced revenue, and downstream conversion trends in a single view.
Customer insights are another major use case. Self-service BI can reveal patterns in customer behavior, engagement, retention, and segmentation, helping teams refine targeting and budget allocation.
Real-World Self-Service BI Use Cases in Operations
Operations teams depend on timely data to keep inventory moving, maintain service levels, and reduce process friction. Self-service BI gives them continuous visibility into execution performance.
Inventory, supply chain, and service performance
Operations managers often need answers across multiple systems: ERP, warehouse management, procurement, and service tools. Self-service BI brings those views together.
Common operations use cases include tracking:
Inventory levels by SKU or location
Stockout risk
Fulfillment delays
Supplier performance
On-time delivery
Service response and resolution times
Instead of relying on static operational summaries, managers can investigate why issues are happening. For example, they can drill from a top-level delay metric into specific warehouses, vendors, product categories, or shift periods.
This matters because operational decisions are highly time-sensitive. Faster visibility can prevent service failures, reduce carrying costs, and improve customer satisfaction.
Process improvement and cross-functional decision-making
One of the most valuable aspects of self-service BI in operations is shared visibility. When finance, operations, and leadership all use the same dashboard framework, teams can align faster around the cause of performance gaps.
Self-service BI helps identify:
Process bottlenecks
Location-to-location performance differences
Team productivity issues
Rework patterns
SLA exceptions
This enables more structured continuous improvement. Teams can compare locations, test operational changes, and monitor whether those changes actually improve throughput, cost, or service outcomes.
In many enterprises, this cross-functional visibility is where self-service BI delivers its biggest long-term value.
How to Choose the Right Self-Service BI Approach
Choosing a self-service BI platform is not just a software decision. It is an operating model decision. The right choice depends on your data architecture, user maturity, governance requirements, and rollout goals.
Evaluate your data sources, users, and governance needs
Start by assessing three factors:
Data sources: ERP, CRM, marketing platforms, spreadsheets, databases, cloud apps, and operational systems
User skill levels: Executives, casual users, analysts, and power users all need different levels of flexibility
Governance requirements: Security, auditability, role-based access, KPI standardization, and data quality controls
If your environment is fragmented, your first priority should be preparing clean, trusted, reusable data sets before scaling self-service access.
Higher risk of conflicting metrics and duplicated reporting
For most organizations, managed self-service BI is the better starting point. It offers business autonomy while preserving a single source of truth. FineBI can support this kind of approach by giving business teams interactive analysis tools while maintaining centralized standards for data access and dashboard distribution.
Actionable Best Practices: How to Implement Self-Service BI Successfully
A successful rollout requires more than enabling dashboards. It needs a disciplined adoption plan.
1. Prioritize one high-impact use case first
Pick a use case with visible business value and frequent reporting pain. Good starting points include:
Finance budget versus actual reporting
Sales pipeline and quota tracking
Marketing campaign ROI dashboards
Inventory and fulfillment monitoring
This creates early wins and helps justify broader adoption.
2. Build a governed semantic layer or shared data model
Do not ask users to figure out raw data on their own. Create shared business-ready data assets with:
Standard KPI formulas
Clean dimensions
Consistent filters
Clear business labels
Role-based permissions
This is the foundation of trusted self-service BI.
3. Design dashboards for decisions, not just visibility
Every dashboard should answer a business question and guide action. Include:
Top-level summary KPIs
Trend views
Comparison views
Drill-down paths
Exception alerts
If a dashboard does not help a manager decide what to do next, it needs redesign.
4. Train users in context, not in theory
Teach people how to answer real questions from their role. For example:
Finance: isolate variance drivers
Sales: spot pipeline leakage
Marketing: compare campaign efficiency
Operations: identify delay root causes
This makes adoption much faster than generic tool training.
5. Measure adoption and improve continuously
Track usage, feedback, dashboard reuse, and request patterns. Then refine:
Which dashboards are actually used
Where users still depend on spreadsheets
Which KPI definitions cause confusion
Which teams are ready for broader rollout
Final Takeaway
Self-service BI is not just a reporting upgrade. It is a practical way to make trusted data available at the speed of business. For finance, sales, marketing, and operations teams, the value is clear: faster analysis, fewer bottlenecks, stronger collaboration, and better decisions.
The organizations that succeed with self-service BI do three things well: they start with high-value use cases, build governance into the foundation, and make dashboards easy enough for business teams to use confidently. When those elements are in place, self-service BI becomes a scalable operating advantage, not just another analytics project.
If you want to give business users more independence without losing control over data quality and consistency, FineBI is a strong option to evaluate.
Self-service BI lets business users explore data, build reports, and answer routine questions without relying on IT for every request. It is designed to make analysis faster while still using trusted, governed data.
Traditional BI usually depends on central teams to create reports and dashboards, which can slow down decisions. Self-service BI shifts more day-to-day analysis to business teams while IT focuses on data preparation, quality, and governance.
It is useful for finance, sales, marketing, operations, and executives who need quick access to performance data. Both casual dashboard users and more advanced analysts can benefit from it.
The biggest benefits are faster reporting, less pressure on IT, and better access to insights across teams. It also helps improve KPI alignment and encourages more data-driven decisions.
A successful setup needs clean, trusted data, clear metric definitions, role-based access, and user training. The goal is to give teams flexibility without losing consistency, security, or confidence in the numbers.
Product Trial
FineReport
Pixel-perfect reports · Interactive dashboards · Easy data entry · Digital twins