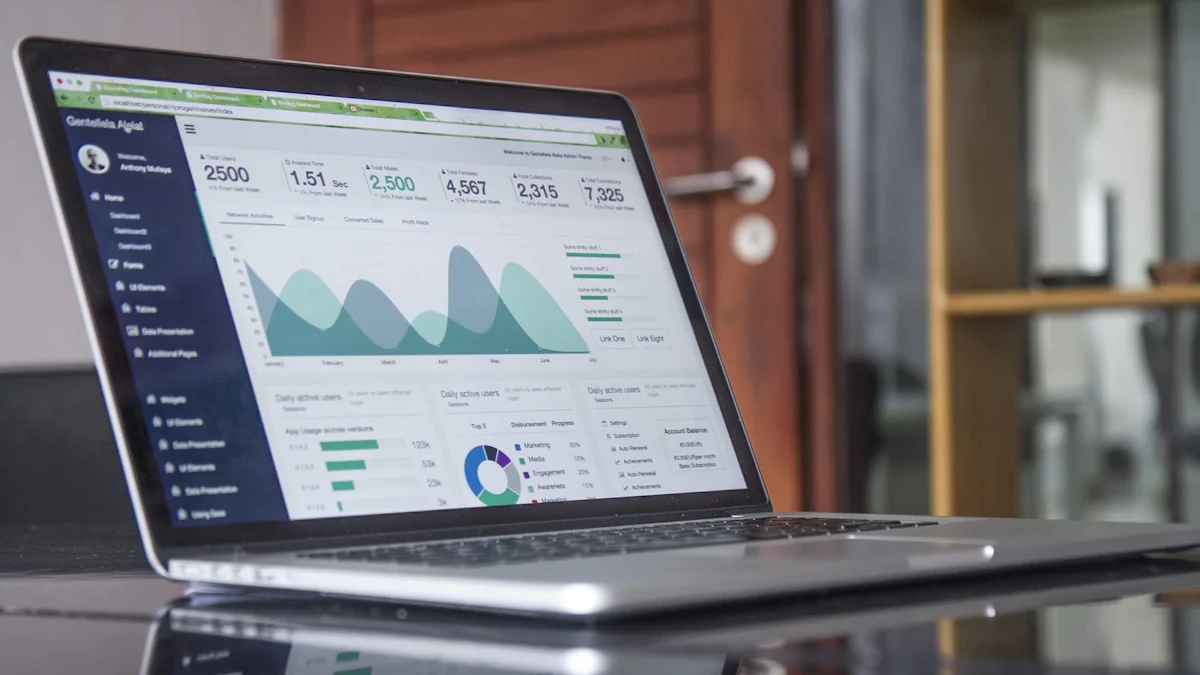
Unlock the full potential of your business with the Square Dashboard. Real-time sales analytics, customer feedback monitoring, and instant business insights - these are just the beginning of what Square Dashboard offers. Whether you're tracking daily sales performance, analyzing customer behavior patterns, or monitoring inventory in real-time, Square Dashboard serves as your comprehensive business intelligence center.
This powerful tool offers you a comprehensive view of your sales trends, allowing you to compare daily, weekly, and yearly gross and net sales. By mastering the Square Dashboard, you enhance your business efficiency, making informed decisions swiftly. Tools like FineReport and FineBI can further elevate your data visualization and analysis, providing deeper insights into your operations. Embrace these resources to streamline your processes and drive growth.
Getting Started with the Square Dashboard
Accessing the Square Dashboard
To begin your journey with the Square Dashboard, you need to access it effectively. Here's how you can get started:
Creating an Account
Visit the Square Website: Head over to squareup.com and click on the "Sign Up" button.
Fill in Your Details: Enter your email address, create a password, and provide some basic information about your business.
Verify Your Email: Check your inbox for a verification email from Square. Click the link to confirm your account.
Complete Your Profile: Once verified, log in and complete your business profile by adding details like your business name and address.
Creating an account is straightforward. You just need to follow these steps, and you'll be ready to explore the dashboard.
Logging In
Go to the Login Page: Navigate to squareup.com/dashboard.
Enter Your Credentials: Use the email and password you set up during account creation.
Access Your Dashboard: Click "Log In" and you'll be taken to your personalized Square Dashboard.
Logging in gives you access to all the tools and features that Square offers. Make sure to keep your login details secure.
Initial Setup of Square Dashboard
Once you're logged in, it's time to set up your dashboard to suit your business needs.
Configuring Basic Settings
Navigate to Account & Settings: This is where you can view or edit personal account details.
Set Up 2-Step Verification: Enhance security by enabling this feature.
View Business Details: Ensure all your business information is accurate.
Update Receipt Settings: Customize how receipts are sent to your customers.
Configuring these settings ensures that your dashboard is tailored to your business operations. Here's how to leverage these basic settings for business growth:
Customized Receipt Strategy: Design receipts that double as marketing tools by including your social media handles, upcoming promotions, or loyalty program details. This turns every transaction into a marketing opportunity.
Smart Tax Configuration: Set up tax rates by product category to automate calculations and ensure compliance. This becomes especially valuable during high-volume sales periods or when expanding to new locations.
Location Settings Optimization: If you operate multiple locations, customize settings for each to reflect local market conditions and customer preferences. This granular approach can increase customer satisfaction and sales across all locations.
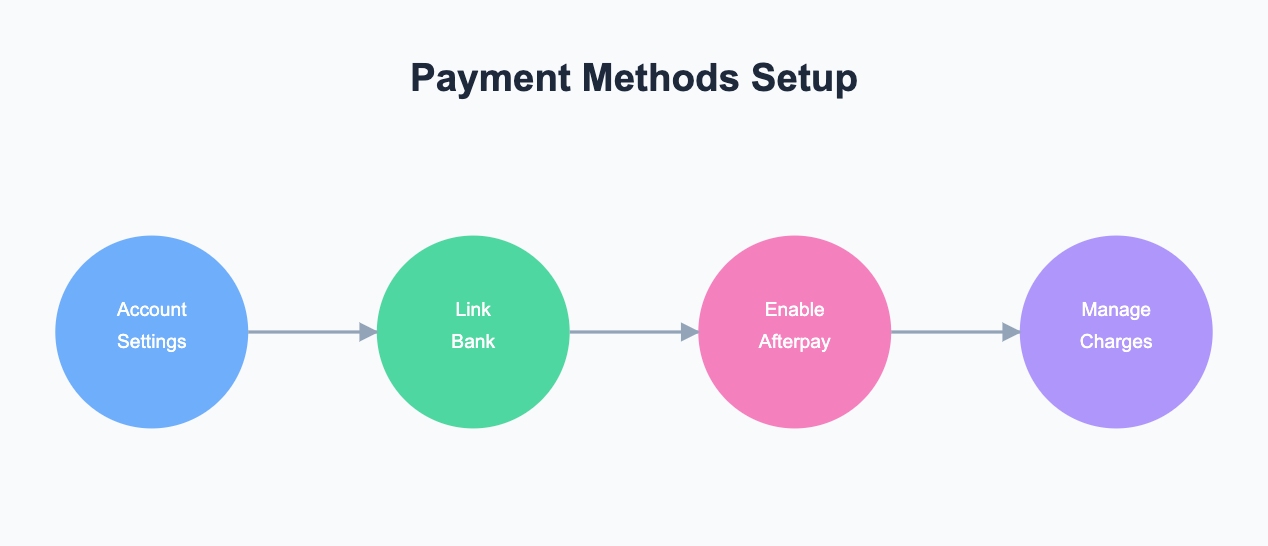
Linking Payment Methods
Go to Payment Methods: Find this option under the Account & Settings section.
Link Your Bank Account: Add your bank details to receive payments directly.
Set Up Afterpay: If eligible, enable Afterpay for flexible payment options.
Manage Service Charges: Create and manage any additional charges you might need.
Linking payment methods is crucial for seamless transactions. It allows you to manage your finances efficiently.
Quick Win Setup Guide - First 24 Hours
In today's fast-paced business environment, getting your Square Dashboard optimized quickly can make the difference between just managing and truly excelling in your operations. These key settings are carefully selected to give you immediate results in efficiency, customer satisfaction, and business insights. Think of this as your "first 24 hours" checklist - a strategic approach to setting up your dashboard for maximum impact from day one.
What makes these settings particularly valuable is their compound effect: each optimization builds upon the others, creating a synchronized system that works for you around the clock. Whether you're running a retail store, restaurant, or service business, these settings form the foundation of a well-oiled operation.
Before we dive into the specific settings, let's understand why these particular configurations matter:
They automate critical monitoring tasks.
They prevent common operational issues before they occu
They provide early warning systems for potential problems
They create a foundation for data-driven decision making
Let's configure these essential settings to immediately boost your business efficiency:
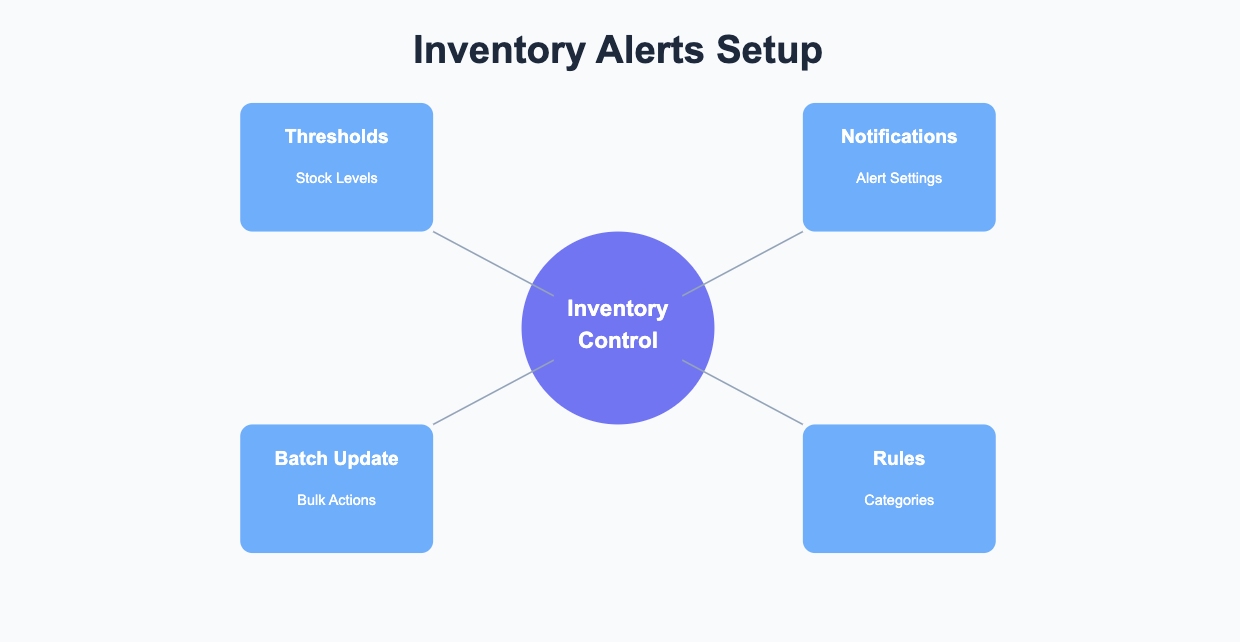
1. Configure Inventory Alerts
Navigate to "Items" > "Inventory Alerts"
Set minimum stock thresholds for best-selling items 1 Pro tip: Start with your top 20% selling items 2 Consider seasonal variations in demand 3 Set different thresholds for different product categories
Enable automated restock notification emails 1 Choose key staff members to receive alerts 2 Set notification frequency to avoid alert fatigue
Configure batch update settings for multiple items 1 Group similar items for easier management 2 Set up category-specific alert rules
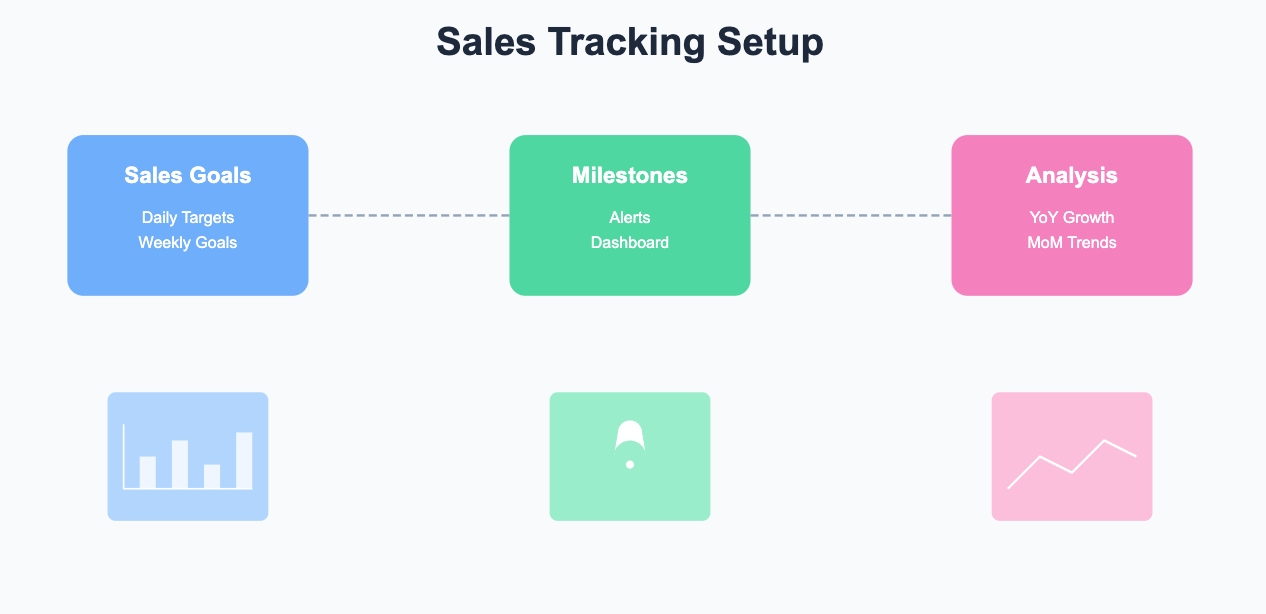
2. Set Up Sales Tracking
Go to "Sales" > "Goals"
Configure daily/weekly sales targets 1 Base targets on historical data 2 Account for seasonal fluctuations 3 Set realistic stretch goals
Enable milestone notifications 1 Create motivating achievement alerts 2 Set up team performance dashboards
Set up comparative analysis with previous periods 1 Track year-over-year growth 2 Monitor month-over-month trends
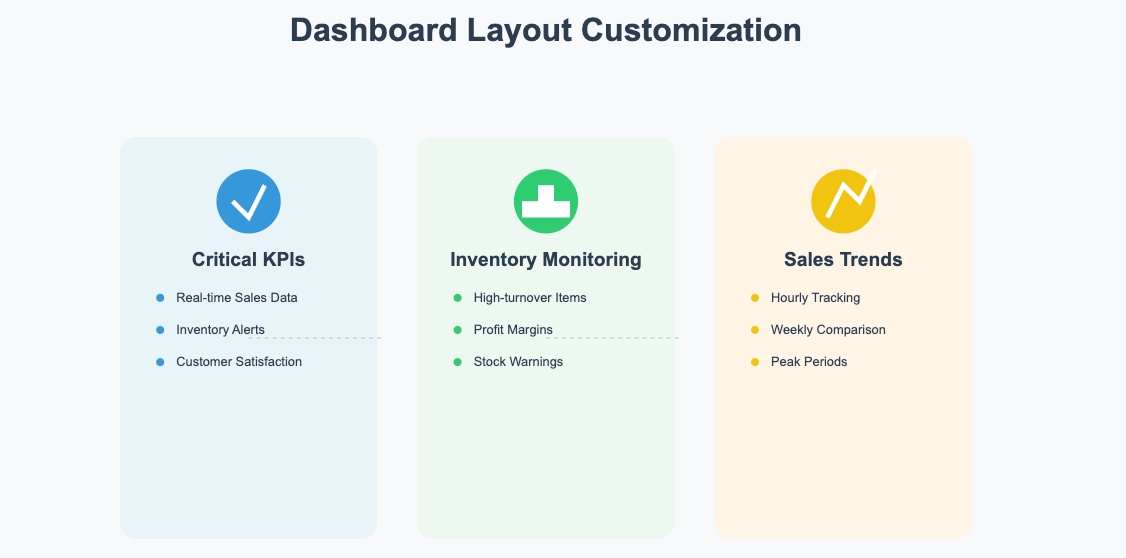
3. Customize Dashboard Layout
Drag critical KPIs to the top 1 Prioritize real-time sales data 2 Feature inventory alerts prominently 3 Display customer satisfaction metrics
Add real-time inventory monitoring widgets 1 Focus on high-turnover items 2 Include profit margin indicators 3 Show stock level warnings
Configure sales trend charts with custom parameters 1 Set up hourly sales tracking 2 Display week-over-week comparisons 3 Highlight peak sales periods
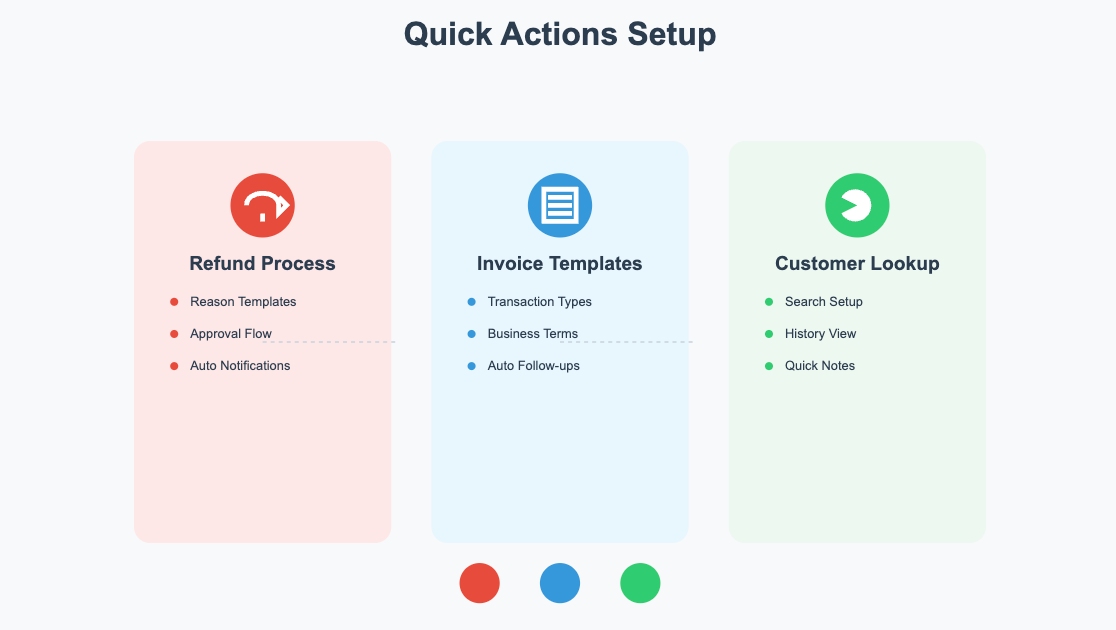
4. Enable Quick Actions
Set up one-click refund process 1 Create refund reason templates 2 Configure approval workflows 3 Set up automatic customer notifications
Configure quick invoice templates 1 Design templates for common transactions 2 Include your business terms 3 Set up automatic follow-ups
Enable rapid customer lookup 1 Configure search parameters 2 Set up customer history views 3 Enable quick note-taking
Remember: The goal is to create a system that works for you, not the other way around. These settings are designed to be adjusted as you learn more about your business patterns and customer needs. Start with these configurations, then fine-tune them based on your specific business requirements and customer feedback.
Pro Tip: Schedule a weekly 15-minute review of these settings for the first month to ensure they're optimized for your business patterns. This small time investment can lead to significant improvements in your operational efficiency.
By following these steps, you will have a well-configured Square Dashboard that supports your business activities. Dive in and explore the features that can help streamline your operations!
Navigating the Square Dashboard
Navigating the Square Dashboard is like having a bird's-eye view of your business. It offers a comprehensive suite of tools to manage your operations efficiently. Let's dive into how you can make the most of it.
Understanding the Interface of Square Dashboard
The interface of the Square Dashboard is designed to be intuitive and user-friendly. Here's what you need to know:
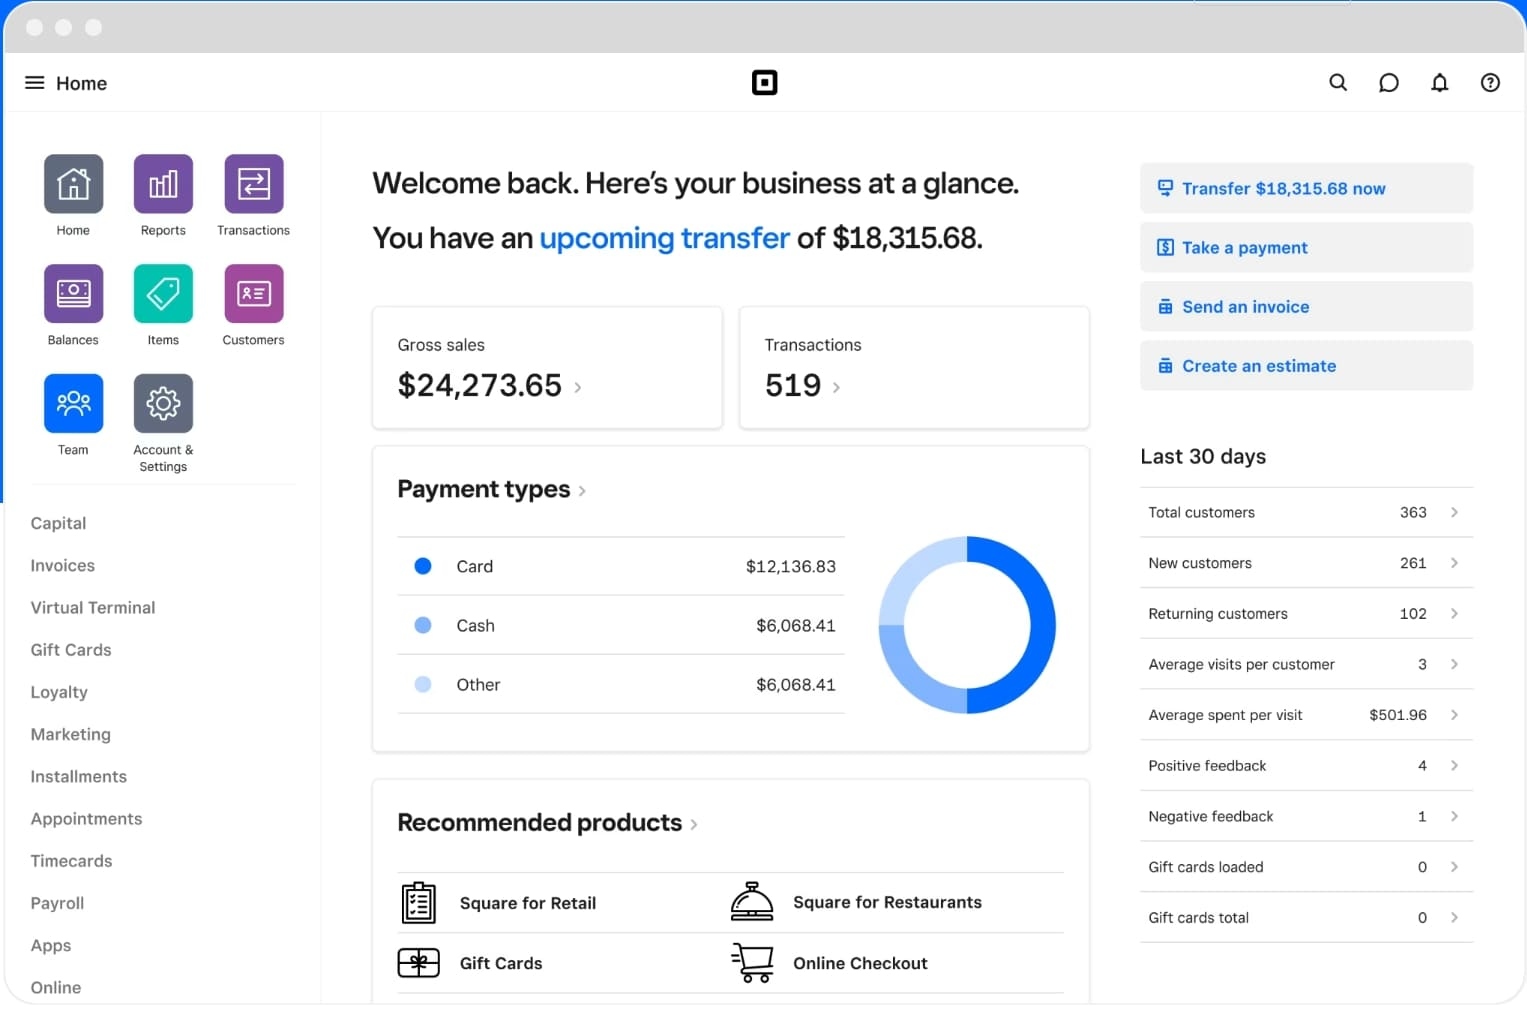
Overview of Main Tabs
The main tabs on the Square Dashboard provide quick access to essential features:
Home: This is your starting point. It gives you a snapshot of your business performance, including sales trends and key metrics.
Sales: Dive deeper into your sales data. You can compare daily, weekly, and yearly sales figures to identify trends and make informed decisions.
Customers: Manage your customer relationships. This tab allows you to view customer details and track interactions.
Items: Keep track of your inventory. You can add new items, update existing ones, and monitor stock levels.
Reports: Access detailed analytics. This feature provides insights into your sales, helping you understand what's working and what needs improvement.
Customizing the Layout
Customizing your dashboard layout can enhance your workflow:
Drag and Drop: Rearrange widgets to prioritize the information you need most.
Add or Remove Widgets: Tailor the dashboard to your specific needs by adding or removing widgets.
Adjust Display Settings: Modify the appearance to suit your preferences, ensuring that the dashboard is both functional and visually appealing.
Exploring Key Features of Square Dashboard
The Square Dashboard is packed with features that can transform how you manage your business.
Sales Overview
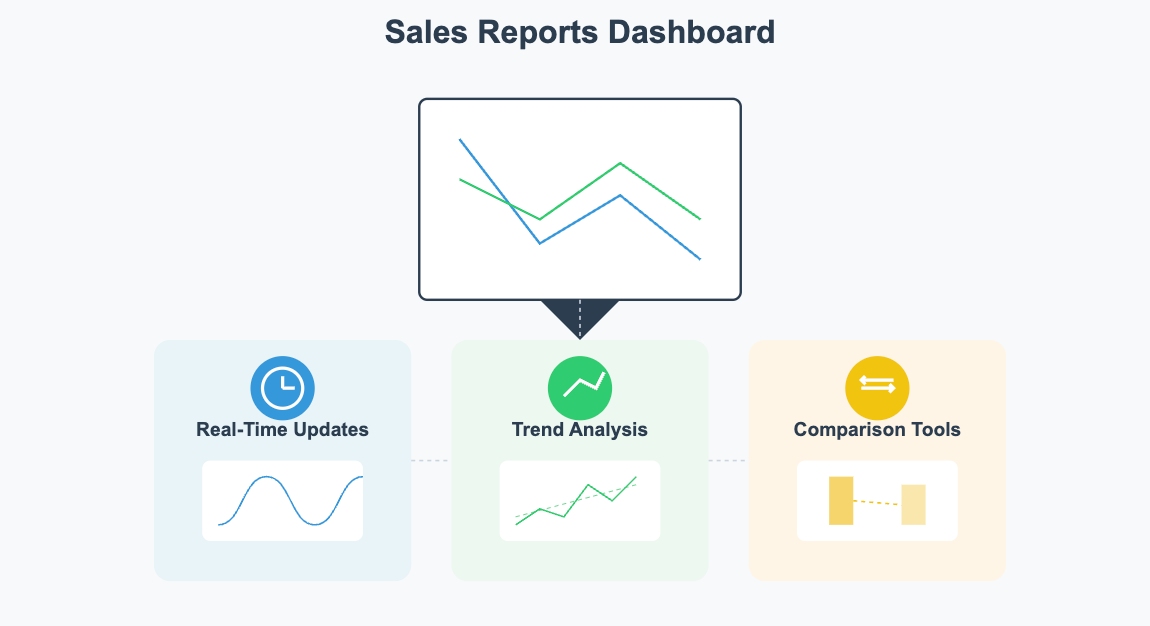
The Sales Overview feature is a powerful tool for tracking your business performance:
Real-Time Data: Monitor sales as they happen. This real-time insight allows you to respond quickly to changes in your business environment.
Trend Analysis: Identify patterns in your sales data. By understanding these trends, you can make strategic decisions to boost your revenue.
Comparison Tools: Compare sales across different time periods. This helps you understand seasonal variations and plan accordingly.
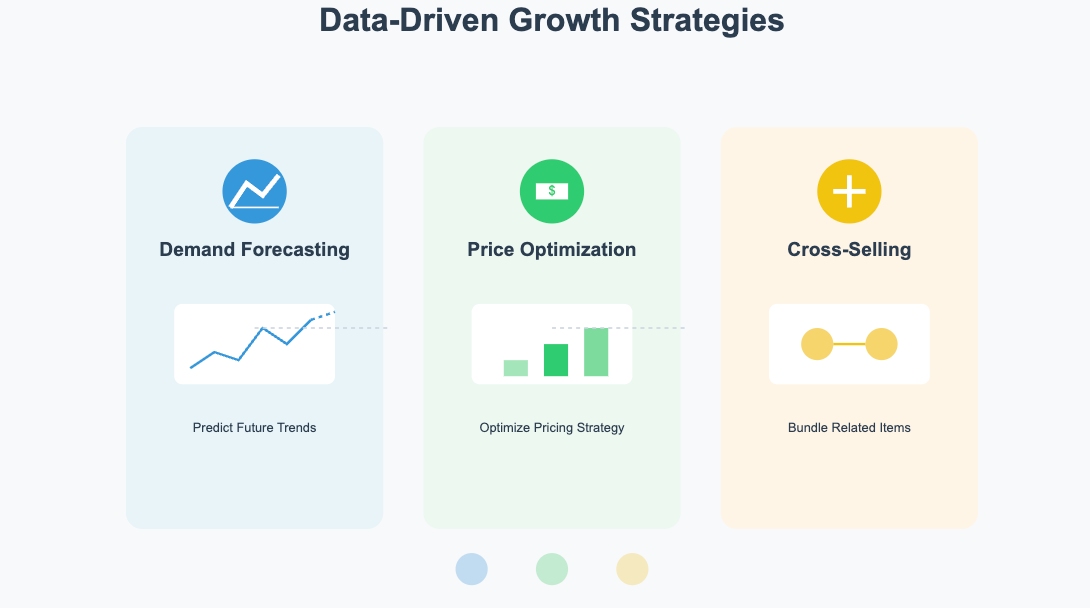
Turn your sales data into actionable growth strategies:
Demand Forecasting: Use historical sales data to predict future demand. For example, if your data shows a 40% sales spike every Friday evening, adjust your inventory and staffing accordingly.
Price Optimization: Analyze sales patterns to identify price sensitivity. If certain items consistently sell better during promotions, consider adjusting their regular pricing or creating strategic bundles.
Cross-Selling Opportunities: Review transaction data to identify frequently paired items. Use these insights to create profitable product combinations or adjust store layouts to boost cross-sales.
Practical Applications of Sales Data
Peak Hours Analysis: Use the real-time sales data to identify your busiest hours. This helps you optimize staff scheduling and ensure adequate coverage during peak times.
Inventory Planning: Cross-reference sales trends with inventory levels to predict when you'll need to restock popular items.
Promotional Strategy: Analyze which products sell best together to create effective bundle deals and promotions.
Inventory Management
Effective inventory management is crucial for any business. The Square Dashboard makes it easy:
Stock Levels: Keep an eye on your inventory levels. This ensures you never run out of popular items.
Alerts: Set up alerts for low stock levels. This proactive approach helps you avoid stockouts and maintain customer satisfaction.
Integration: Seamlessly integrate with other tools like FineReport for enhanced data visualization and reporting. This integration provides deeper insights into your inventory data, helping you make informed decisions.
By mastering these features, you can optimize your business operations and drive growth. The Square Dashboard is more than just a tool; it's your partner in success.
Customizing the Interface of Square Dashboard
Personalizing your Square Dashboard can make your business operations smoother and more efficient. Let's explore how you can tailor the dashboard to fit your needs.
Personalizing Your Dashboard
Your dashboard should reflect your business priorities. Here's how you can make it your own:
Adding Widgets
Widgets are like building blocks for your dashboard. They provide quick access to the information you need most.
Select Widgets: Choose from a variety of widgets that display sales, customer data, or inventory levels.
Drag and Drop: Arrange these widgets on your dashboard by simply dragging and dropping them into place.
Prioritize Information: Place the most important widgets at the top for easy access.
Adding widgets helps you focus on the data that matters most to your business.
Adjusting Display Settings
The appearance of your dashboard can impact how you interact with it.
Modify Colors: Change the color scheme to match your brand or personal preference.
Resize Widgets: Adjust the size of widgets to ensure they fit well on your screen.
Toggle Visibility: Show or hide certain widgets based on your current needs.
Adjusting display settings makes your dashboard not only functional but also visually appealing.
Setting User Permissions
Managing who can access what on your dashboard is crucial for maintaining security and efficiency.
Creating User Roles
User roles define what different team members can do on the dashboard.
Define Roles: Create roles such as Manager, Sales Associate, or Inventory Specialist.
Assign Tasks: Specify tasks each role can perform, like viewing reports or managing inventory.
Streamline Operations: Ensure everyone knows their responsibilities and has the tools they need.
Assigning Access Levels
Access levels control the extent of access each user has to the dashboard.
Set Permissions: Decide who can view, edit, or delete information.
Protect Sensitive Data: Restrict access to financial data or customer information to authorized personnel only.
Review Regularly: Periodically review and update access levels to adapt to changing roles.
Assigning access levels ensures that sensitive information remains secure and only accessible to those who need it.
By customizing your Square Dashboard, you create a workspace that aligns with your business goals and enhances productivity. Take the time to personalize it, and you'll find managing your business becomes a more seamless experience.
Optimizing Workflows with Custom Layouts
Role-Based Dashboards: Create specialized dashboard layouts for different roles:
Cashiers: Quick access to transaction tools and daily sales goals.
Managers: Prominence to inventory alerts and staff performance metrics.
Owners: Focus on long-term trends and financial health indicators.
Time-Saving Shortcuts: Position frequently used features prominently to reduce clicks and save time during busy periods.
Utilizing Reporting Tools for Square Dashboard
Unlock the power of data with the Square Dashboard'sreporting tools. These tools provide you with valuable insights into your business operations. Let's explore how you can access and analyze reports to make informed decisions.
Accessing Reports
Accessing reports on the Square Dashboard is straightforward. Here's how you can dive into the data:
Sales Reports
Sales reportsoffer a comprehensive view of your business performance. You can track sales trends and compare them over different periods. This helps you identify what's working and what needs improvement.
Real-Time Updates: Get instant updates on your sales figures. This allows you to respond quickly to changes in your business environment.
Trend Analysis: Spot patterns in your sales data. By understanding these trends, you can make strategic decisions to boost your revenue.
Comparison Tools: Compare sales across different time frames. This helps you understand seasonal variations and plan accordingly.
Customer Insights
Understanding your customers is key to growing your business. Through detailed customer feedback analysis and comprehensive customer behavior tracking, the Square Dashboard provides actionable customer insights. The Square Dashboard provides detailed customer insights.
Customer Profiles: View detailed profiles of your customers. This includes their purchase history and preferences.
Engagement Tracking: Track how customers interact with your business. This helps you tailor your marketing efforts to meet their needs.
Feedback Analysis: Analyze customer feedback to improve your products and services. This ensures you meet customer expectations and enhance satisfaction.
Here also have some practical Tips for Improving Customer Satisfaction:
VIP Customer Management:
Set up automatic tagging for frequent buyers
Configure exclusive VIP discounts and perks
Implement birthday reward automation
Track VIP customer lifetime value
Churn Prevention Strategy:
Identify customers with declining purchase frequency
Set up automated retention marketing triggers
Deploy personalized win-back campaigns
Monitor retention metrics
Customer Feedback Loop
Collect and analyze review data
Set up rapid response protocols for negative feedback
Track improvement initiatives
Implement automated satisfaction surveys
Leveraging Customer Data for Growth
Customer Segmentation: Use purchase history to segment customers into groups (e.g., frequent buyers, high-value customers, occasional visitors) and create targeted marketing campaigns.
Loyalty Program Management: Track customer spending patterns to design reward tiers that encourage repeat business.
Personalized Marketing: Use customer preferences data to send customized promotions and recommendations.
Analyzing Data
Analyzing data is crucial for making informed business decisions. The Square Dashboard offers tools to help you interpret metrics and make data-driven decisions.
Interpreting Metrics
Metrics provide a snapshot of your business performance. Understanding these metrics is essential for making informed decisions.
Key Performance Indicators (KPIs): Focus on KPIs that matter most to your business. This helps you track progress towards your goals.
Data Visualization: Use charts and graphs to visualize your data. This makes it easier to spot trends and patterns.
Custom Reports: Create custom reports to analyze specific aspects of your business. This allows you to dive deeper into the data and uncover hidden insights.
Making Data-Driven Decisions
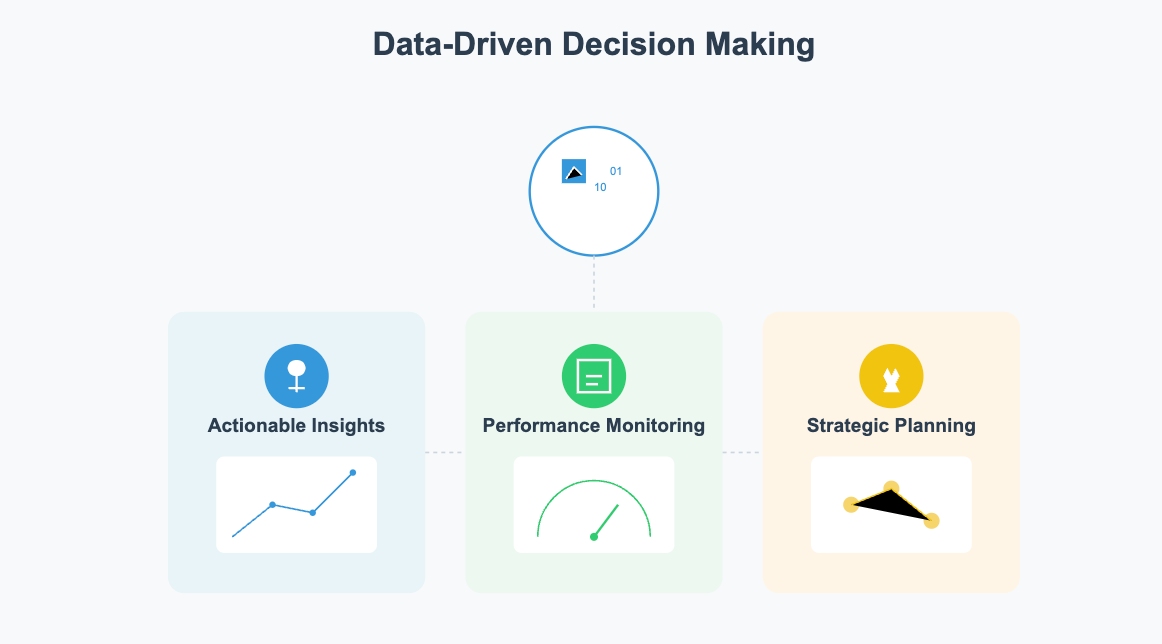
Data-driven decisions are based on facts, not assumptions. By leveraging real-time business intelligence and comprehensive sales trend analysis, the Square Dashboard equips you with the tools to make informed choices.
Actionable Insights: Use data to identify opportunities for growth. This helps you make strategic decisions that drive your business forward.
Performance Monitoring: Keep an eye on your business performance. This ensures you stay on track and achieve your goals.
Strategic Planning: Use data to inform your strategic planning. This helps you allocate resources effectively and maximize your return on investment.
Here's how to translate data insights into business growth:
Menu Engineering: For restaurants, use sales and margin data to identify your menu's stars (high profit, high popularity) and dogs (low profit, low popularity). Redesign your menu to highlight profitable items and consider removing or revamping underperforming ones.
Dynamic Pricing Strategy: Implement time-based pricing by analyzing peak hours and slow periods. For example, if data shows slower traffic between 2-5 PM, consider happy hour specials during these times.
Inventory Investment Optimization: Use sales velocity data to optimize your inventory investment. For items with high turnover, set up automatic reordering to maintain optimal stock levels while freeing up capital from slow-moving inventory.
Practical Applications of Reports
Seasonal Planning: Use year-over-year comparisons to:
Adjust inventory levels for seasonal peaks
Plan staffing needs during high-demand periods
Set realistic revenue targets based on historical data
Product Performance: Analyze item-level reports to:
Identify underperforming products that may need promotion
Spotlight top sellers for prominent display
Optimize pricing based on margin analysis
By utilizing the reporting tools on the Square Dashboard, you can gain valuable insights into your business operations. This empowers you to make informed decisions and drive growth. Embrace these tools and take your business to the next level!
Integrating with Other Tools for Square Dashboard
Enhancing your business operations often involves integrating various tools and applications. The Square Dashboard offers seamless integration capabilities, allowing you to connect third-party apps and sync data across platforms. Let's explore how you can make the most of these features.
Connecting Third-Party Apps
Integrating third-party apps with your Square Dashboard can streamline your business processes and enhance functionality. Here's how you can get started:
Popular Integrations
Many businesses benefit from integrating popular apps with their Square Dashboard. These integrations can help you manage different aspects of your business more efficiently.
Accounting Software: Connect apps like QuickBooks or Xero to simplify your financial management. This integration allows for automatic syncing of sales data, reducing manual entry and errors.
E-commerce Platforms: Link your Square Dashboard with platforms like Shopify or WooCommerce. This connection ensures that your online sales data is automatically updated in your dashboard, providing a unified view of your sales channels.
Marketing Tools: Use integrations with Mailchimp or Constant Contact to enhance your marketing efforts. These tools help you create targeted campaigns based on customer data from your Square Dashboard.
Setting Up Integrations
Setting up integrations is straightforward. Follow these steps to connect your favorite apps:
Navigate to the App Marketplace: Access the Square App Marketplace from your dashboard.
Search for the App: Use the search bar to find the app you want to integrate.
Follow the Instructions: Each app will have specific instructions for integration. Follow these to connect the app to your Square Dashboard.
Authorize Access: Grant the necessary permissions for the app to access your data.
By integrating third-party apps, you can automate tasks and improve efficiency, allowing you to focus on growing your business.
Syncing Data Across Platforms
Ensuring data consistency across platforms is crucial for accurate reporting and decision-making. The Square Dashboard makes it easy to sync data seamlessly.
Ensuring Data Consistency
Consistent dataacross platforms ensures that you have a reliable source of truth for your business operations.
Automatic Updates: Enable automatic updates to ensure that changes in one platform reflect across all connected systems. This reduces the risk of discrepancies and ensures that everyone has access to the latest information.
Regular Audits: Conduct regular audits of your data to identify and resolve any inconsistencies. This proactive approach helps maintain data integrity and reliability.
Troubleshooting Sync Issues
Occasionally, you may encounter sync issues. Here's how to troubleshoot common problems:
Check Connections: Ensure that all integrations are properly connected and authorized. Reconnect any apps that may have lost their connection.
Review Permissions: Verify that the necessary permissions are granted for data access. Adjust settings if needed to allow seamless data flow.
Contact Support: If issues persist, reach out to the support teams of the respective apps or Square for assistance. They can provide guidance and solutions to resolve sync problems.
Integration Use Cases
Automated Marketing Workflows
Connect Square with email marketing tools
Set up purchase-triggered automated emails
Track marketing campaign ROI
Create segmented customer lists for targeted campaigns
Smart Inventory Management
Link with supplier systems
Configure automatic reorder thresholds
Optimize purchasing workflows
Set up multi-location inventory sync
Financial Reporting Automation
Sync data with accounting software
Generate automated monthly reports
Streamline tax reporting preparation
Set up custom financial dashboards
E-commerce Integration
Connect online store platforms
Sync inventory across channels
Unify customer data
Create omnichannel reporting views
By effectively syncing data across platforms, you can maintain accurate records and make informed decisions based on comprehensive insights.
Advanced Features and Tips of Square Dashboard
Unlocking the advanced features of the Square Dashboard can significantly enhance your business operations. These features allow you to automate tasks and bolster security, ensuring a seamless and secure experience.
Automating Tasks
Automation can save you time and reduce errors in your daily operations. Here's how you can set it up:
Setting Up Automation Rules
Identify Repetitive Tasks: Look for tasks that you perform regularly, such as sending invoices or updating inventory.
Access Automation Settings: Navigate to the automation section in your Square Dashboard.
Create Rules: Set rules for tasks you want to automate. For example, you can automate sending a thank-you email after a purchase.
Test and Adjust: Run a test to ensure the automation works as expected. Make adjustments if necessary.
Practical Automation Examples
Customer Communications:
Automatic thank-you emails after first purchase
Birthday rewards notifications
Review requests after significant purchases
Inventory Management:
Low stock alerts for key items
Automatic reorder notifications
Regular inventory audit reminders
Automating tasks helps you focus on more strategic aspects of your business, leaving routine tasks to the system.
Benefits of Automation
Efficiency: Automation speeds up processes, allowing you to accomplish more in less time.
Consistency: Automated tasks are performed consistently, reducing the risk of human error.
Focus: With routine tasks automated, you can concentrate on growing your business and serving your customers better.
Enhancing Security
Security is paramount when managing your business data. The Square Dashboard offers robust features to protect your information.
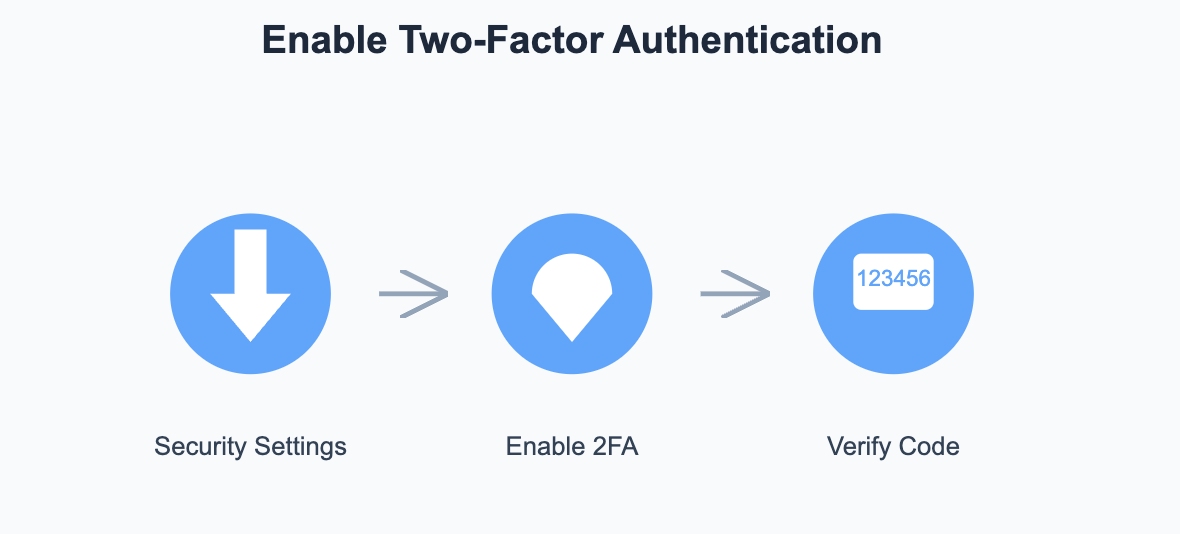
Enabling Two-Factor Authentication
Navigate to Security Settings: Go to the security section in your dashboard.
Enable Two-Factor Authentication (2FA): Turn on 2FA to add an extra layer of security. This requires a second form of verification, like a text message code, when logging in.
Follow Setup Instructions: Complete the setup by following the on-screen instructions.
Two-factor authentication significantly reduces the risk of unauthorized access to your account.
Monitoring Account Activity
Access Activity Logs: Check the activity logs in your Square Dashboard to monitor actions taken by you and your team.
Review Regularly: Regularly review these logs to spot any unusual activity.
Set Alerts: Configure alerts for specific actions, such as changes in user permissions or large transactions.
Monitoring account activity helps you stay informed about what's happening in your account, allowing you to act quickly if something seems off.
By leveraging these advanced features, you can streamline your operations and enhance the security of your business data. Tools like FineBI can further complement these efforts by providing advanced analytics and insights, helping you make informed decisions with confidence.
Troubleshooting Common Issues for Square Dashboard
Even the best tools can sometimes present challenges. When you encounter issues with the Square Dashboard, don't worry. Here are some common problems and how you can resolve them.
Resolving Login Problems
Logging in should be a breeze, but if you face difficulties, here's what you can do.
Password Recovery
Forgot Your Password? Click on the "Forgot Password?" link on the login page.
Check Your Email: Square will send a password reset link to your registered email. Open your inbox and find the email.
Reset Your Password: Click the link and follow the instructions to set a new password. Choose something secure and memorable.
If you can't find the email, check your spam or junk folder. Sometimes, emails end up there by mistake.
Account Lockouts
Too Many Attempts? If you've tried logging in too many times with the wrong password, Square might lock your account temporarily.
Wait It Out: Usually, the lockout lasts for a short period. Wait a few minutes before trying again.
Contact Support: If the issue persists, reach out to Square's support team. They can help unlock your account and get you back on track.
Keeping your login details secure is crucial. Consider using a password manager to store your credentials safely.
Addressing Performance Issues
Smooth performance is key to efficient operations. If the Square Dashboard isn't running as expected, try these solutions.
Slow Loading Times
Check Your Internet Connection: Ensure your internet is stable. A weak connection can slow down the dashboard.
Clear Browser Cache: Over time, your browser stores data that can affect performance. Clear your cache to improve speed.
Update Your Browser: Make sure you're using the latest version of your browser. Updates often include performance enhancements.
If the problem continues, try accessing the dashboard from a different device or network.
Error Messages
Read the Message: Error messages often provide clues about the issue. Take note of any codes or descriptions.
Restart Your Device: Sometimes, a simple restart can resolve unexpected errors.
Check for Updates: Ensure your Square Dashboard app is up-to-date. Updates can fix bugs and improve functionality.
If you still see error messages, contact Square support. They can offer specific guidance based on the error you're experiencing.
By following these troubleshooting steps, you can resolve common issues and keep your Square Dashboard running smoothly. Remember, help is always available if you need it.
You've now unlocked the potential of the Square Dashboard. By mastering its features, you can enhance your business efficiency and make informed decisions swiftly. Dive into the Sales Trend report and Reports tool to gain valuable insights into your sales trends and overall business health. These tools help you understand seasonal cycles and improve performance. Don't stop here—explore further resources and apply your newfound skills. Embrace the power of data analytics to drive your business forward. Your journey with the Square Dashboard is just beginning.
Click the banner below to experience FineBI for free and empower your enterprise to convert data into productivity!
Access a wealth of case studies, industry insights, and solution guides to accelerate digital transformation.
FAQ
How do I customize my Square Dashboard?
Customizing your Square Dashboard is straightforward. You can add or remove widgets to tailor the dashboard to your needs. Simply drag and drop widgets to rearrange them. Adjust display settings to match your preferences. This personalization ensures that your dashboard reflects your business priorities.
What should I do if I forget my password?
Forgetting your password happens to the best of us. Click on the Forgot Password? link on the login page. Square will send a password reset link to your registered email. Follow the instructions in the email to set a new password. Make sure it's secure and memorable.
How can I integrate third-party apps with my Square Dashboard?
Integrating third-party apps enhances your dashboard's functionality. Visit the Square App Marketplace from your dashboard. Search for the app you want to integrate. Follow the provided instructions to connect the app. Authorize access to ensure seamless data flow between platforms.
What steps can I take to improve dashboard performance?
Improving dashboard performance involves a few simple steps. Check your internet connection for stability. Clear your browser cache to enhance speed. Ensure your browser is up-to-date. If issues persist, try accessing the dashboard from a different device or network.
How do I set up user permissions?
Setting up user permissions is crucial for security. Define roles such as Manager or Sales Associate. Assign tasks each role can perform. Set permissions to control who can view, edit, or delete information. Regularly review and update access levels to adapt to changing roles.
What should I do if I encounter error messages?
Encountering error messages can be frustrating. First, read the message for clues about the issue. Restart your device to resolve unexpected errors. Check for updates to your Square Dashboard app. If problems persist, contact Square support for specific guidance.