Root cause analysis helps you find and fix the real reasons behind issues in your business. Using advanced tools like AI-powered dashboards or self-service BI platforms improves decision-making and keeps your workflow stable. These tools help you spot patterns, monitor performance, and reduce mistakes.
What Are Root Cause Analysis Tools?
Definition and Purpose
Root cause analysis tools help you find the real reason behind a problem, not just the symptoms. When you use these tools, you can fix issues at their source and prevent them from happening again. Many industries rely on these tools to improve quality, reduce downtime, and boost efficiency.
Here is a quick overview of what root cause analysis means and how experts define it:
Aspect
Description
Definition
Root cause analysis (RCA) is a method for identifying the root causes of faults or problems.
Techniques
Includes five whys, failure mode and effects analysis (FMEA), fault tree analysis, Ishikawa diagrams, and Pareto analysis.
Standards
Outlined in ISO/IEC 31010, applicable across various domains such as IT, manufacturing, and healthcare.
You will find that root cause analysis tools use these techniques to help you solve problems faster and more accurately. By following industry standards, you can trust the results and make better decisions for your business.
Tip: When you address the root cause, you save time and resources by avoiding repeated fixes for the same issue.
Common Use Cases in 2025
In 2025, you will see root cause analysis tools used in many fields. These tools help you tackle everything from manufacturing defects to software crashes. Here are some examples of how different industries use them:
Use Case
Problem Description
Tool Used
Root Cause
Manufacturing Defect
A factory sees an increase in defective parts.
5 Whys
A machine was misaligned after recent maintenance.
Software Downtime
An app frequently crashes during peak usage.
Pareto Chart
80% of crashes were traced to one outdated server.
Customer Complaint Spike
A sudden rise in negative customer reviews.
Fishbone Diagram
Miscommunication in shipping policies during a promotion.
Healthcare Equipment Failure
An imaging device intermittently fails.
Scatter Diagram
Power surges during late-night usage correlated with outages.
Assembly Delay
An automotive plant keeps falling behind schedule.
FMEA
Delay linked to one supplier's inconsistent delivery schedule.
You can see that root cause analysis tools help you solve a wide range of problems. Whether you work in manufacturing, IT, healthcare, or customer service, these tools give you the power to find and fix the real issues that slow you down.
Key Root Cause Analysis Techniques
When you want to solve problems in your business, you need to know which root cause analysis techniques work best. These methods help you break down complex issues and find the real reasons behind them. Let’s look at some of the most common root cause analysis techniques you can use.
Fishbone Diagram (Ishikawa)
You can use the Fishbone Diagram, also called the Ishikawa Diagram, to organize possible causes of a problem. This tool lets you map out causes visually, which helps your team see connections that might be missed. You start by writing the problem at the head of the “fish,” then branch out into categories like people, machines, methods, and materials. This approach encourages everyone to brainstorm and explore deeper issues.
The Fishbone Diagram helps you understand complex scenarios by grouping causes and showing how they relate. You get a clear picture of what might be causing the problem, which leads to better solutions.
Provides a visual map of causes and their subcategories.
Enhances understanding and communication among team members.
The 5 Whys technique is one of the most powerful rca techniques for quick problem-solving. You ask “why” five times in a row to dig beneath the surface. Each answer leads you closer to the root cause. You do not need advanced tools, so it works well in meetings or on the shop floor.
Advantage
Description
Efficiency
Resolves issues more quickly and with fewer resources.
Team collaboration
Promotes teamwork and communication by involving multiple team members.
Long-term solutions
Helps prevent the recurrence of issues, leading to sustainable improvements.
This method is simple and fast. You can use it for many types of problems.
Pareto Analysis
Pareto Analysis uses the 80/20 rule. You focus on the few causes that create most of the problems. This technique helps you prioritize your efforts and get the best results.
A Pareto analysis enables you to shift focus and prioritize problems effectively.
It identifies root causes, allowing you to concentrate on areas that yield the highest return on investment.
The Pareto Principle shows that a small number of causes lead to the majority of results.
You can use Pareto charts to see which issues need your attention first. This method boosts efficiency and profitability.
Fault Tree Analysis
Fault Tree Analysis is a structured way to look at how different events lead to a problem. You build a tree diagram that shows the logical relationship between events. This technique works well for complex systems, especially in safety-critical industries.
Strengths of Fault Tree Analysis
Provides rigorous, systematic analysis of failure scenarios
Well-suited for complex systems with multiple potential failure paths
Can incorporate quantitative probability assessments
Clearly shows the logical relationship between events
Especially valuable for safety-critical processes and risk assessment
You can use Fault Tree Analysis to find weak points and prevent future failures.
AI-Powered Techniques
AI-powered techniques are changing how you do root cause analysis in 2025. These tools use algorithms to scan millions of data points and spot patterns faster than humans. You get real-time insights and can fix problems before they grow.
AI algorithms automate pattern recognition and data analysis.
Real-time data correlation reduces the mean time to identify root causes from hours to under 5 minutes.
Predictive models can prevent 60-80% of potential incidents before they impact operations.
For example, you can use natural language processing to analyze customer complaints and find hidden trends. AI helps you uncover causes that manual methods might miss.
You now have a toolkit of common root cause analysis techniques. By using these methods, you can solve problems faster and make smarter decisions.
Why Use Root Cause Analysis Tools in Modern Business?
Benefits Over Manual Methods
You face many challenges when you try to solve problems with manual methods. Root cause analysis management software changes the way you work. You can use rca tools to reduce downtime, cut IT costs, and boost productivity. The table below shows how these tools help your business:
Benefit
Description
Reduced downtime
Leads to better digital experience and engagement.
Fewer help desk tickets
Results in lower IT costs.
Increased productivity
Improves end-user experience.
Root cause analysis tools let your team collaborate in real time, no matter where you are. You can brainstorm quickly and share data instantly. This reduces miscommunication and delays. RCA tools also help you manage large datasets. Manual analysis takes a lot of time and can lead to mistakes. Root cause analysis software automates the process, so you spend more time understanding the data and less time collecting it.
Modern businesses deal with complex data from many sources. Root cause analysis management software helps you break down these barriers. RCA tools like FineBI give you real-time reporting and seamless data integration. You can use the 5 Whys technique to quickly find the root causes of data problems. This method helps you focus on the real issues instead of just fixing symptoms.
FineBI supports cross-department collaboration. You can share dashboards and insights with your team. This makes your data analytics stronger and more robust. RCA tools target systemic problems, so you avoid wasting time on temporary fixes. You get sustainable solutions that improve your business over time.
You can use root cause analysis management software to connect data, analyze trends, and make better decisions. FineBI gives you the power to handle data complexity and drive your business forward.
10 Best Root Cause Analysis Tools for 2025
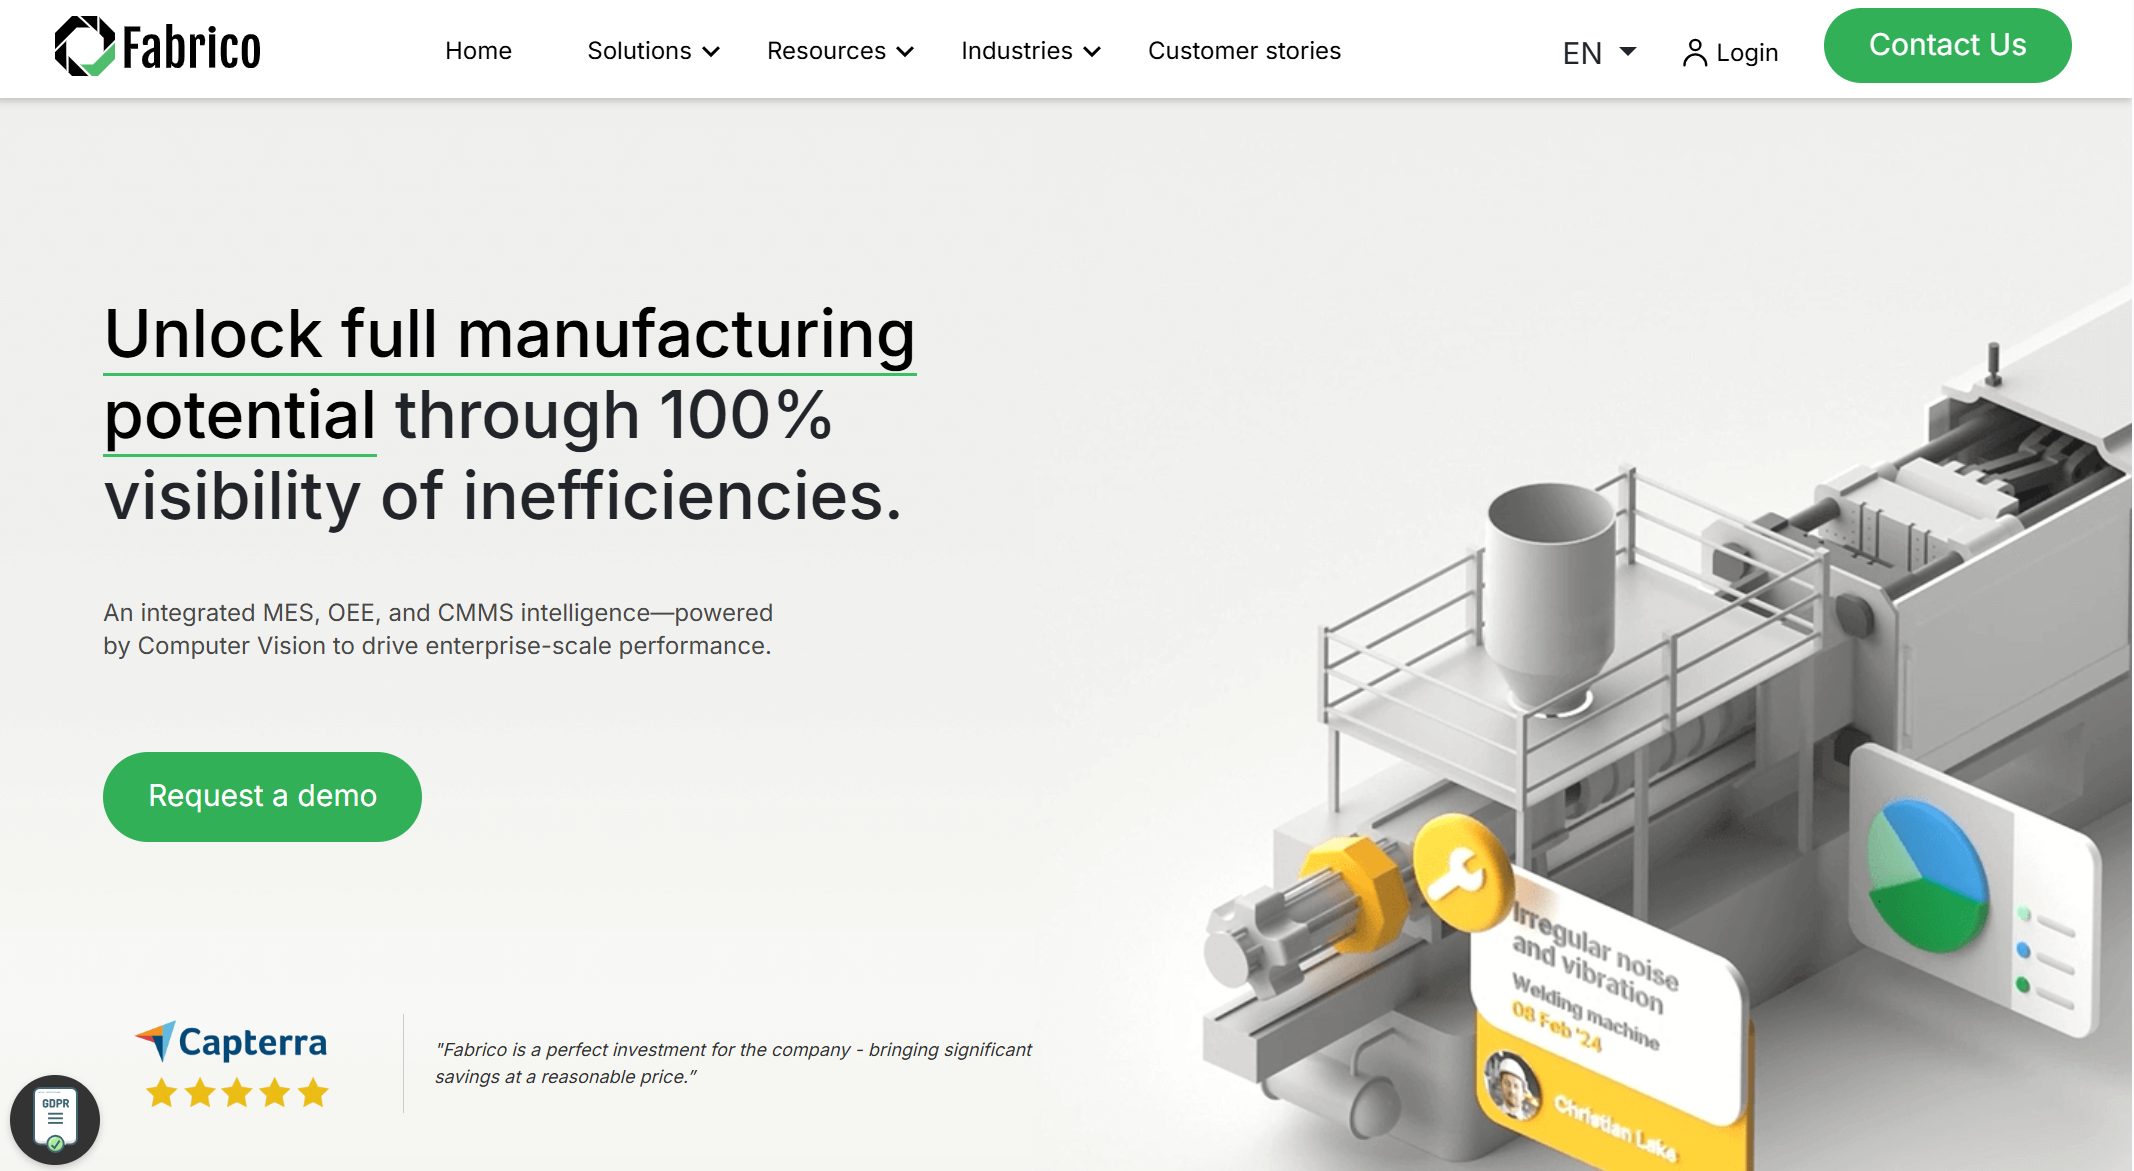
1.Fabrico
You can use Fabrico to improve efficiency on high-speed packaging lines. This tool captures the last 30 seconds of video before a micro-stop, so you see exactly what happened. You get digital changeover instructions on tablets, which help your team follow standard operating procedures. Fabrico identifies the station causing most micro-stops and triggers repair work orders through its native CMMS. If you manage a production line, Fabrico helps you focus on the real issues that slow you down.
Captures 30 seconds before a micro-stop for detailed review.
Digital Changeovers
Step-by-step SOPs for SKU changes, tracking actual vs. target time.
Bad Actor Identification
Pinpoints stations causing most micro-stops.
Native CMMS
Instantly triggers repair work orders.
Best For
High-speed packaging lines with frequent micro-stops.
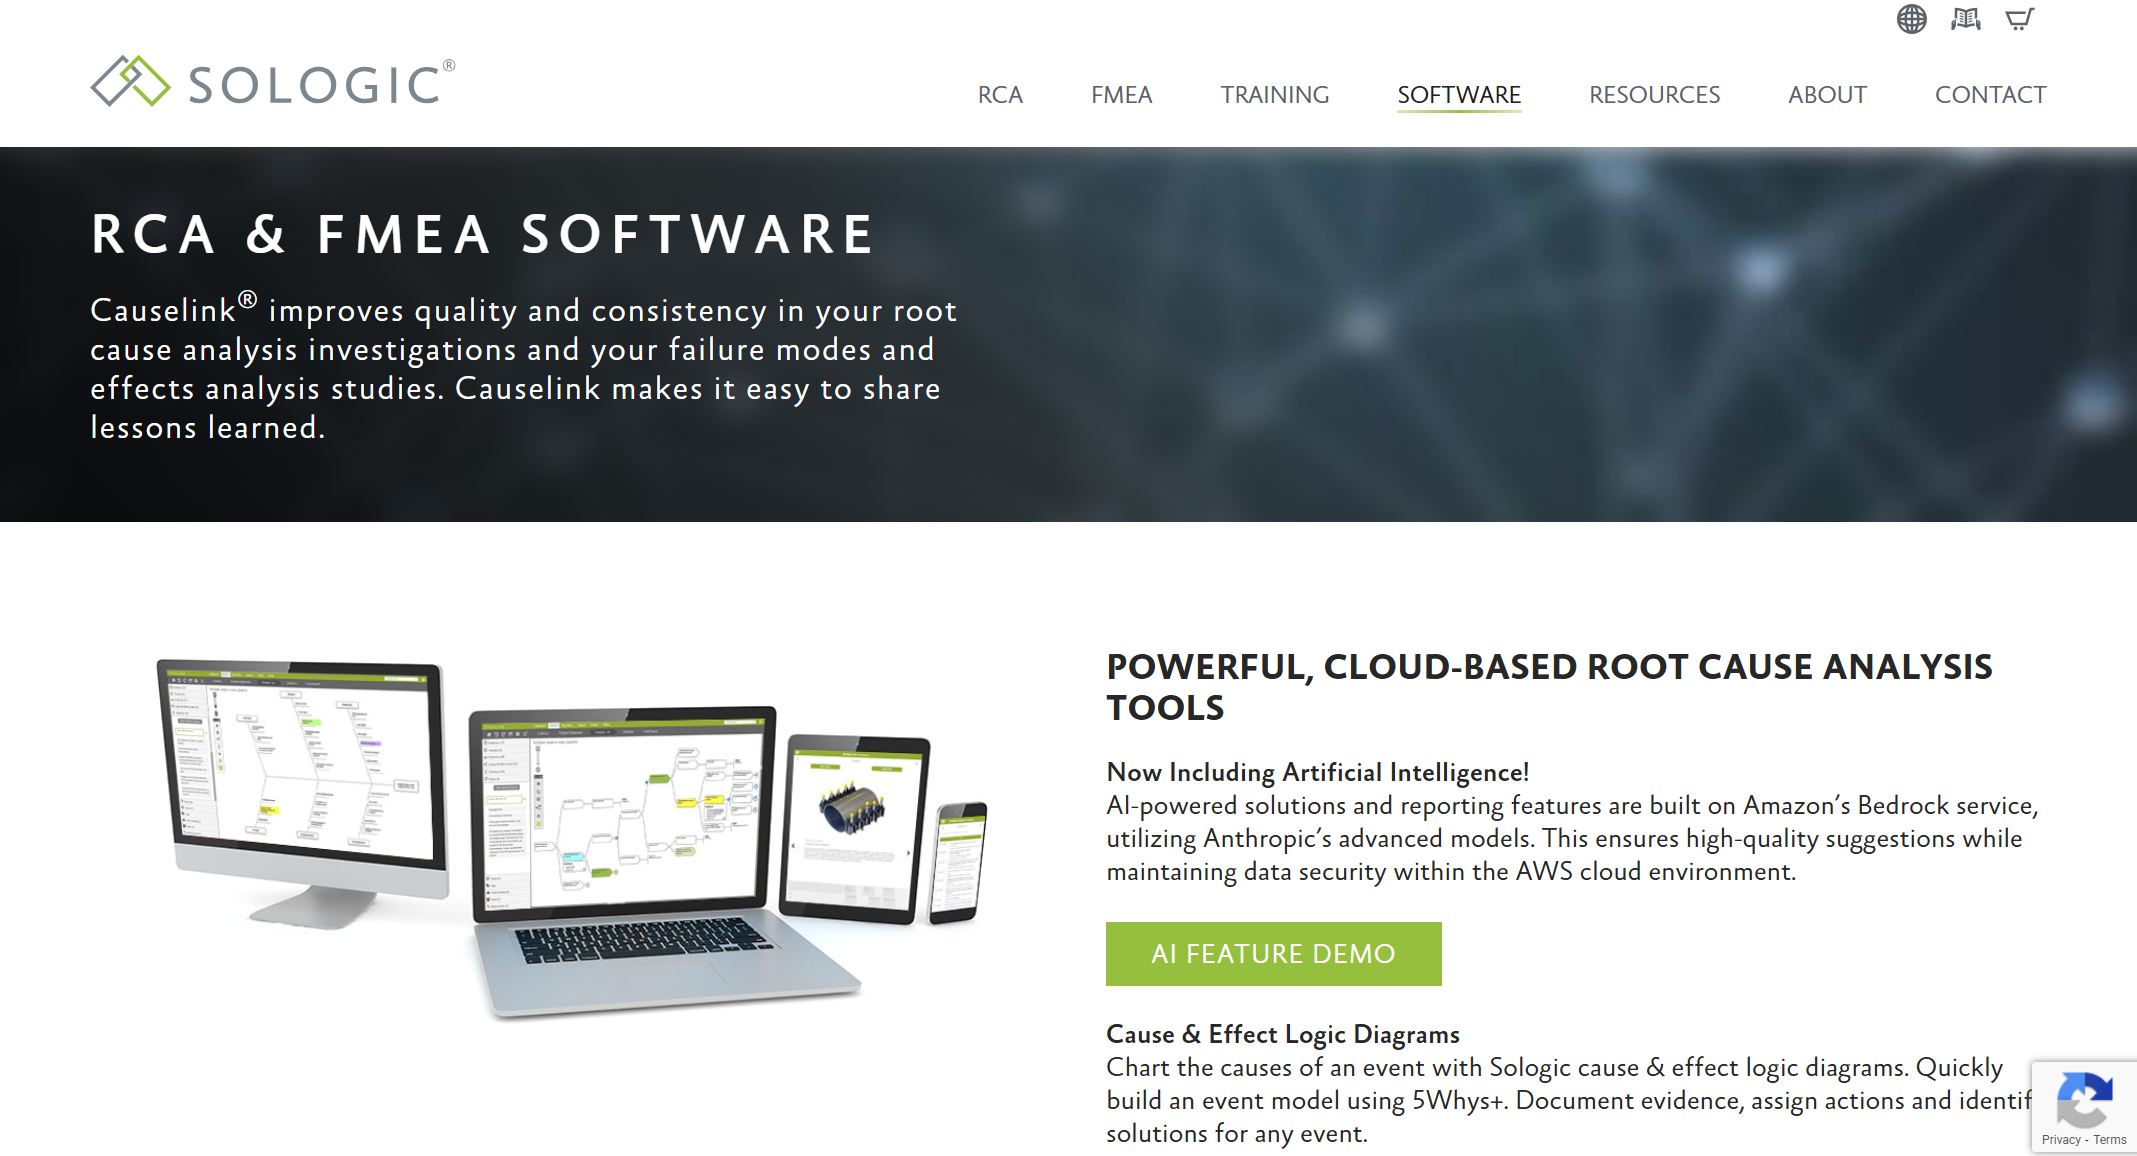
2.Sologic Causelink
Sologic Causelink stands out as one of the most advanced dedicated rca software options for enterprise teams. You can collaborate with your team to investigate incidents, identify root causes, and generate solutions. The platform helps you share lessons learned across your organization. Sologic Causelink supports multiple built-in techniques and offers virtual RCA training. You get a five-step method that guides you through complex investigations.
Sologic offers experienced investigators and facilitators to guide your organization through the RCA process, ensuring accurate and detailed investigations into major problems.
Enables team collaboration
Assists in identifying root causes
Facilitates solution generation
Promotes sharing of lessons learned
Designed for complex organizations
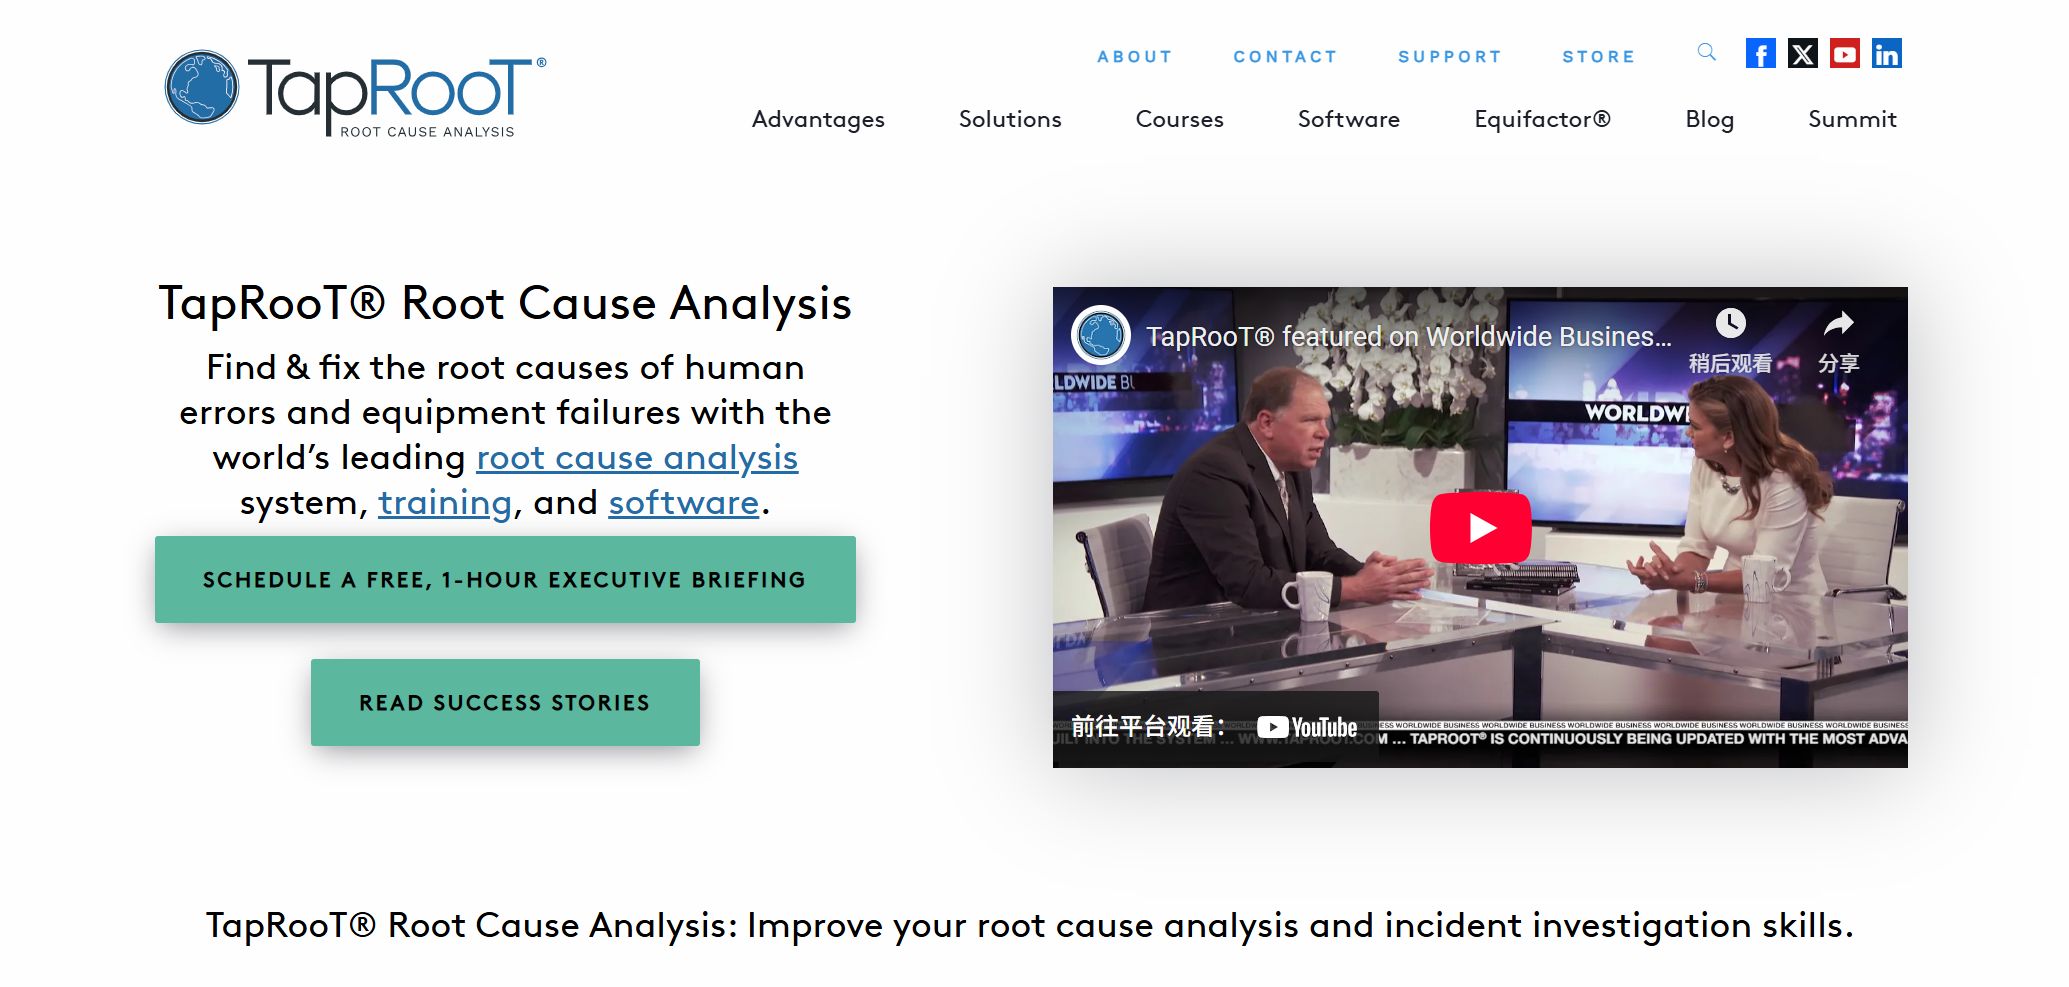
3.TapRooT
TapRooT gives you a structured approach to incident investigation. You start by understanding what happened before asking why it happened. The SnapCharT Diagram lets you visualize the incident, so you see the full picture. The Root Cause Tree Diagram guides you to multiple root causes, which is important because many incidents have more than one factor. TapRooT uses human factors expertise to help you avoid jumping to conclusions.
Root Cause Tree Diagram for finding multiple causes
This dedicated rca software works well for industries where safety and accuracy matter most.
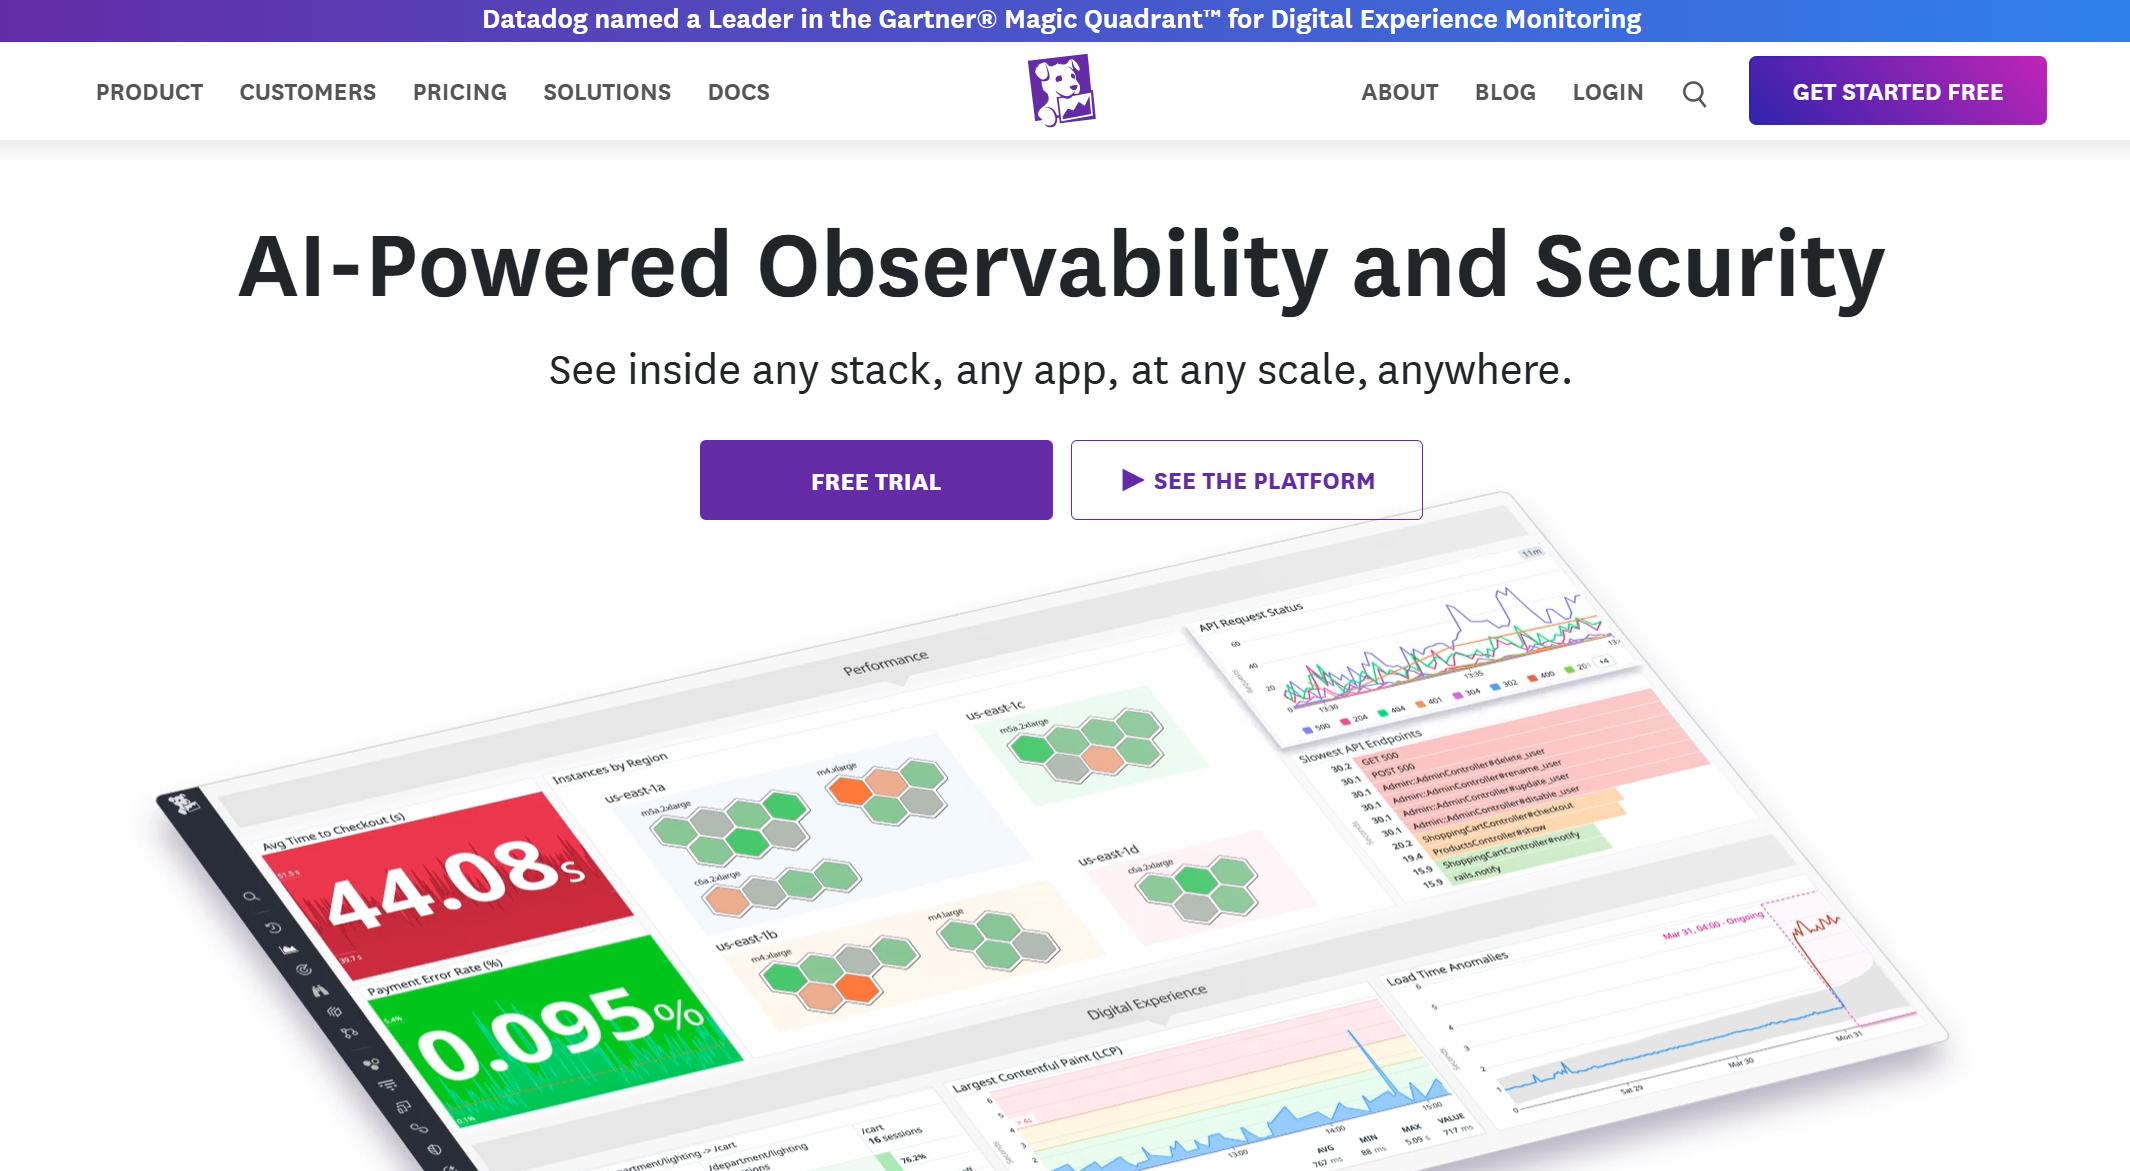
4.Datadog
Datadog combines real-time monitoring with root cause analysis software. You can trace requests through distributed applications and see where slowdowns or errors occur. Datadog provides trace visualizations, service health checks, and log-based alerting. You get real-time log management, which helps you collect and analyze logs quickly. Datadog lets you pinpoint issues down to individual transactions, making it a strong choice for IT operations.
Trace visualizations for identifying slow requests and errors
Service health checks and log-based alerting
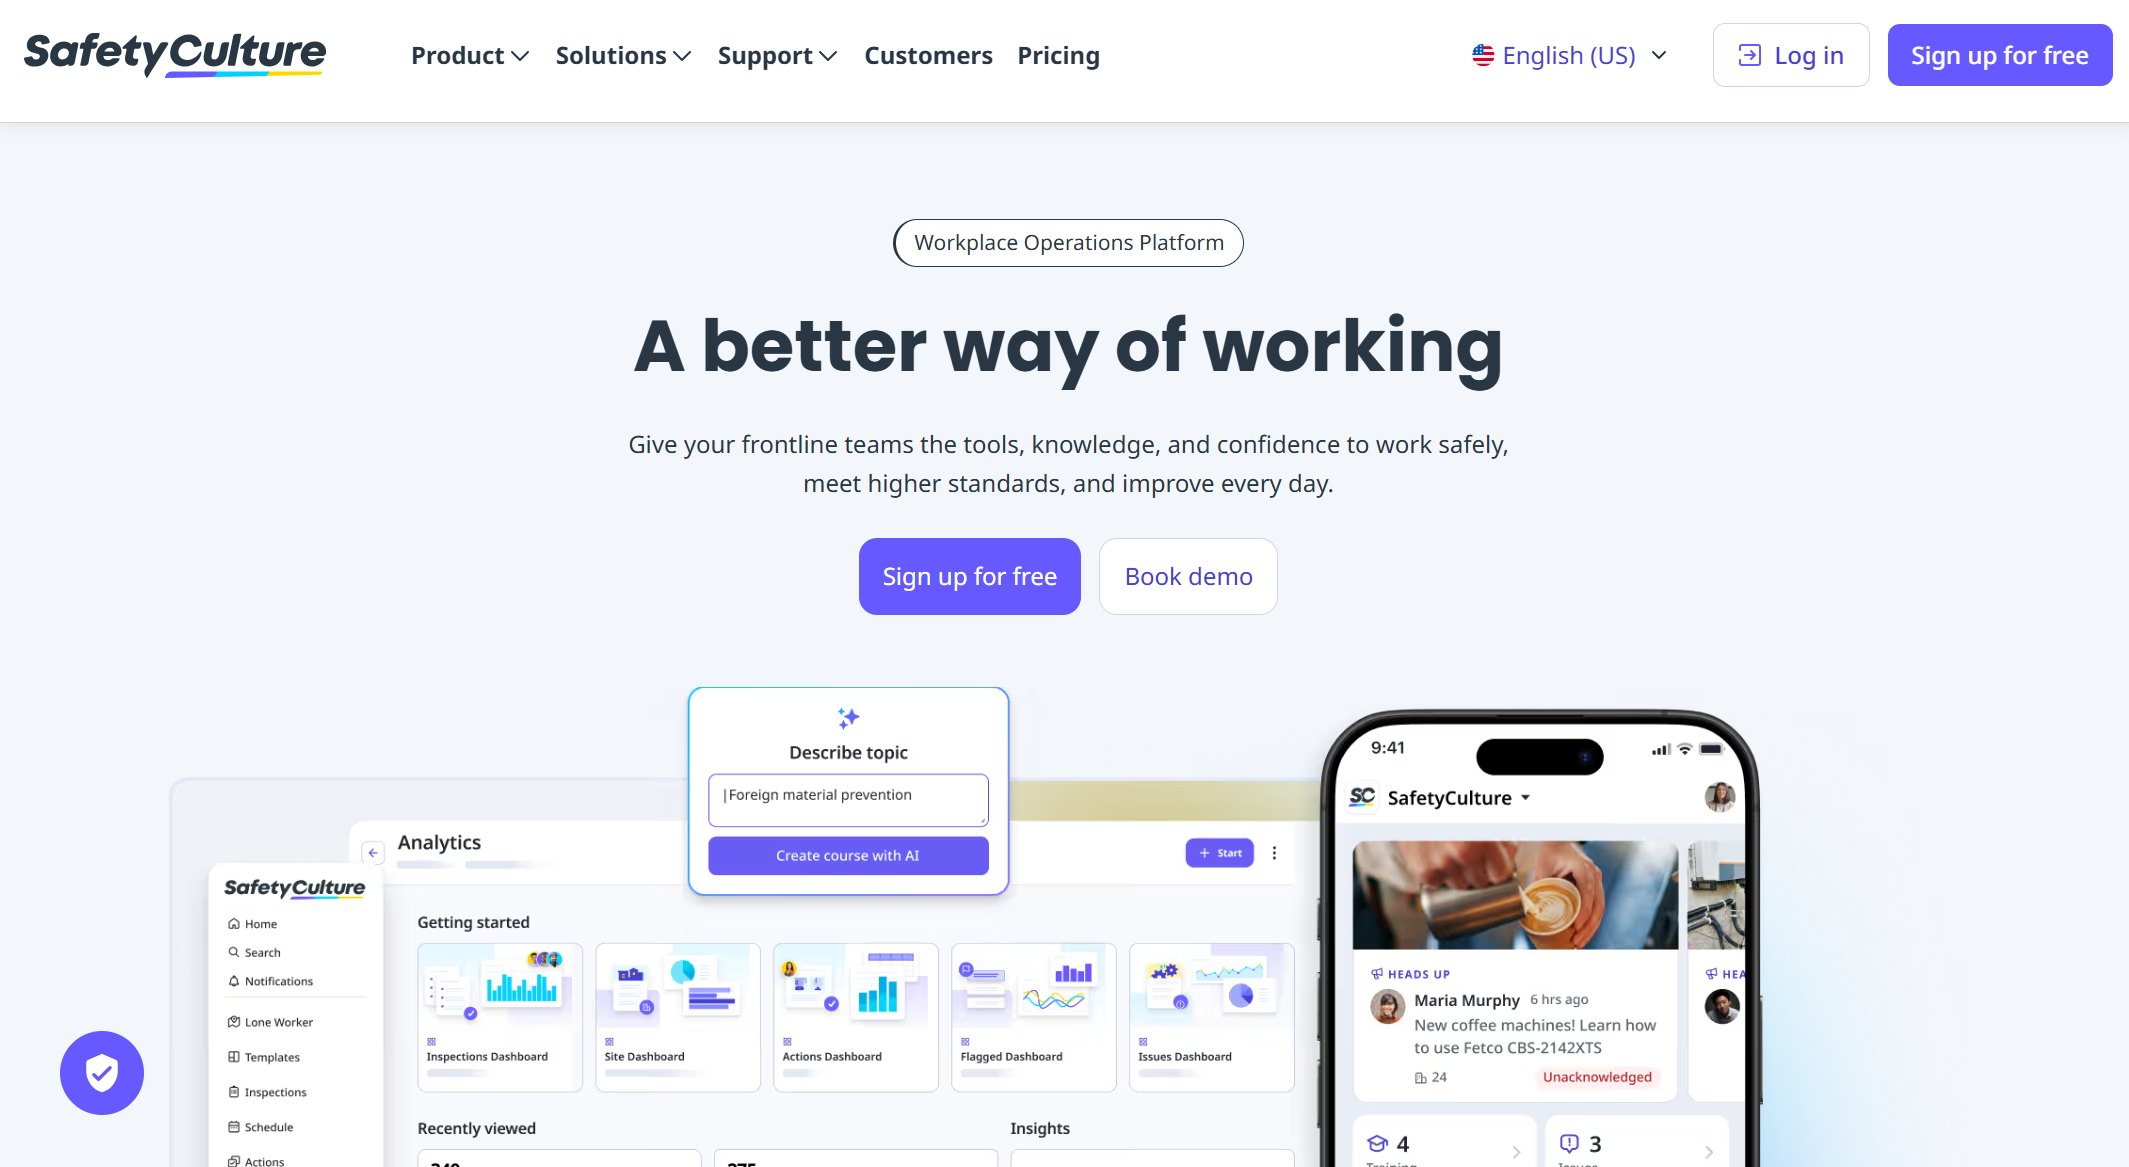
5.SafetyCulture
SafetyCulture is a mobile-first platform that supports root cause analysis in safety management. You can use the 5 Why method to dig into incidents and promote a culture of problem-solving. SafetyCulture allows you to explore unlimited whys, so you uncover all possible causes. The platform encourages continuous improvement and supports collaborative problem-solving.
Designed for operational safety and efficiency in various industries.
5 Why method
Promotes proactive safety management.
Unlimited whys
Enables comprehensive root cause analysis.
Encourages continuous improvement
Supports team collaboration
Helps you create actionable plans
6.Knowella
Knowella provides a modern approach to root cause analysis tools for manufacturing and operations teams. You can digitize your incident investigation process and standardize how your team documents findings. Knowella offers customizable workflows, digital forms, and real-time reporting. You get visual dashboards that help you track trends and monitor corrective actions. If you want to move away from paper-based processes, Knowella gives you the tools organizations commonly use for quality improvement.
Logz.io uses AI to automate root cause analysis in IT operations. You can troubleshoot and resolve incidents much faster. The platform correlates data, provides actionable recommendations, and integrates with ChatOps for real-time monitoring. Logz.io’s Observability IQ automates complex root cause analysis, so you interact directly with your data. You can trigger automated RCA on exceptions and alerts, which eliminates manual steps.
Automated investigation and root cause identification
Actionable recommendations for troubleshooting
Proactive event management
8.BigPanda
BigPanda leverages AI and machine learning to automate root cause detection in incident management. You can analyze incident data in real time and identify causal relationships. BigPanda integrates with systems like ServiceNow and JIRA, so you see change data in context. The platform’s AI outputs are highly accurate when you use clean, organized data. Many organizations have reduced incident duration by half after deploying BigPanda’s latest RCA features.
Machine learning and Generative AI for real-time analysis
Root Cause Detection
Identifies causal relationships, reduces mean time to resolution
Integration
Pre-integrated with ServiceNow, JIRA, and other change systems
Accuracy
Twice as accurate with clean, organized data
Customer Impact
50% reduction in incident duration for some customers
Real-time RCA for fast action
Enhanced incident analysis with Generative AI
9.FineBI
FineBI stands out as a dedicated rca software that empowers you to connect, analyze, and visualize data from multiple sources. You can use self-service dashboards to track KPIs, identify trends, and perform root cause analysis across your organization. FineBI supports real-time data integration, so you always work with the latest information. The platform’s drag-and-drop interface makes it easy for business users and analysts to create interactive dashboards without coding.
You can leverage advanced analytics, including AI-driven insights, to uncover hidden patterns and predict future outcomes. FineBI’s role-based access control ensures secure data sharing, which is essential for cross-department collaboration. If you work in manufacturing, you can use FineBI to monitor quality indicators, analyze defect rates, and identify the root causes of production issues. Many organizations choose FineBI as their dedicated rca software because it combines agility, governance, and advanced analytics in one platform.
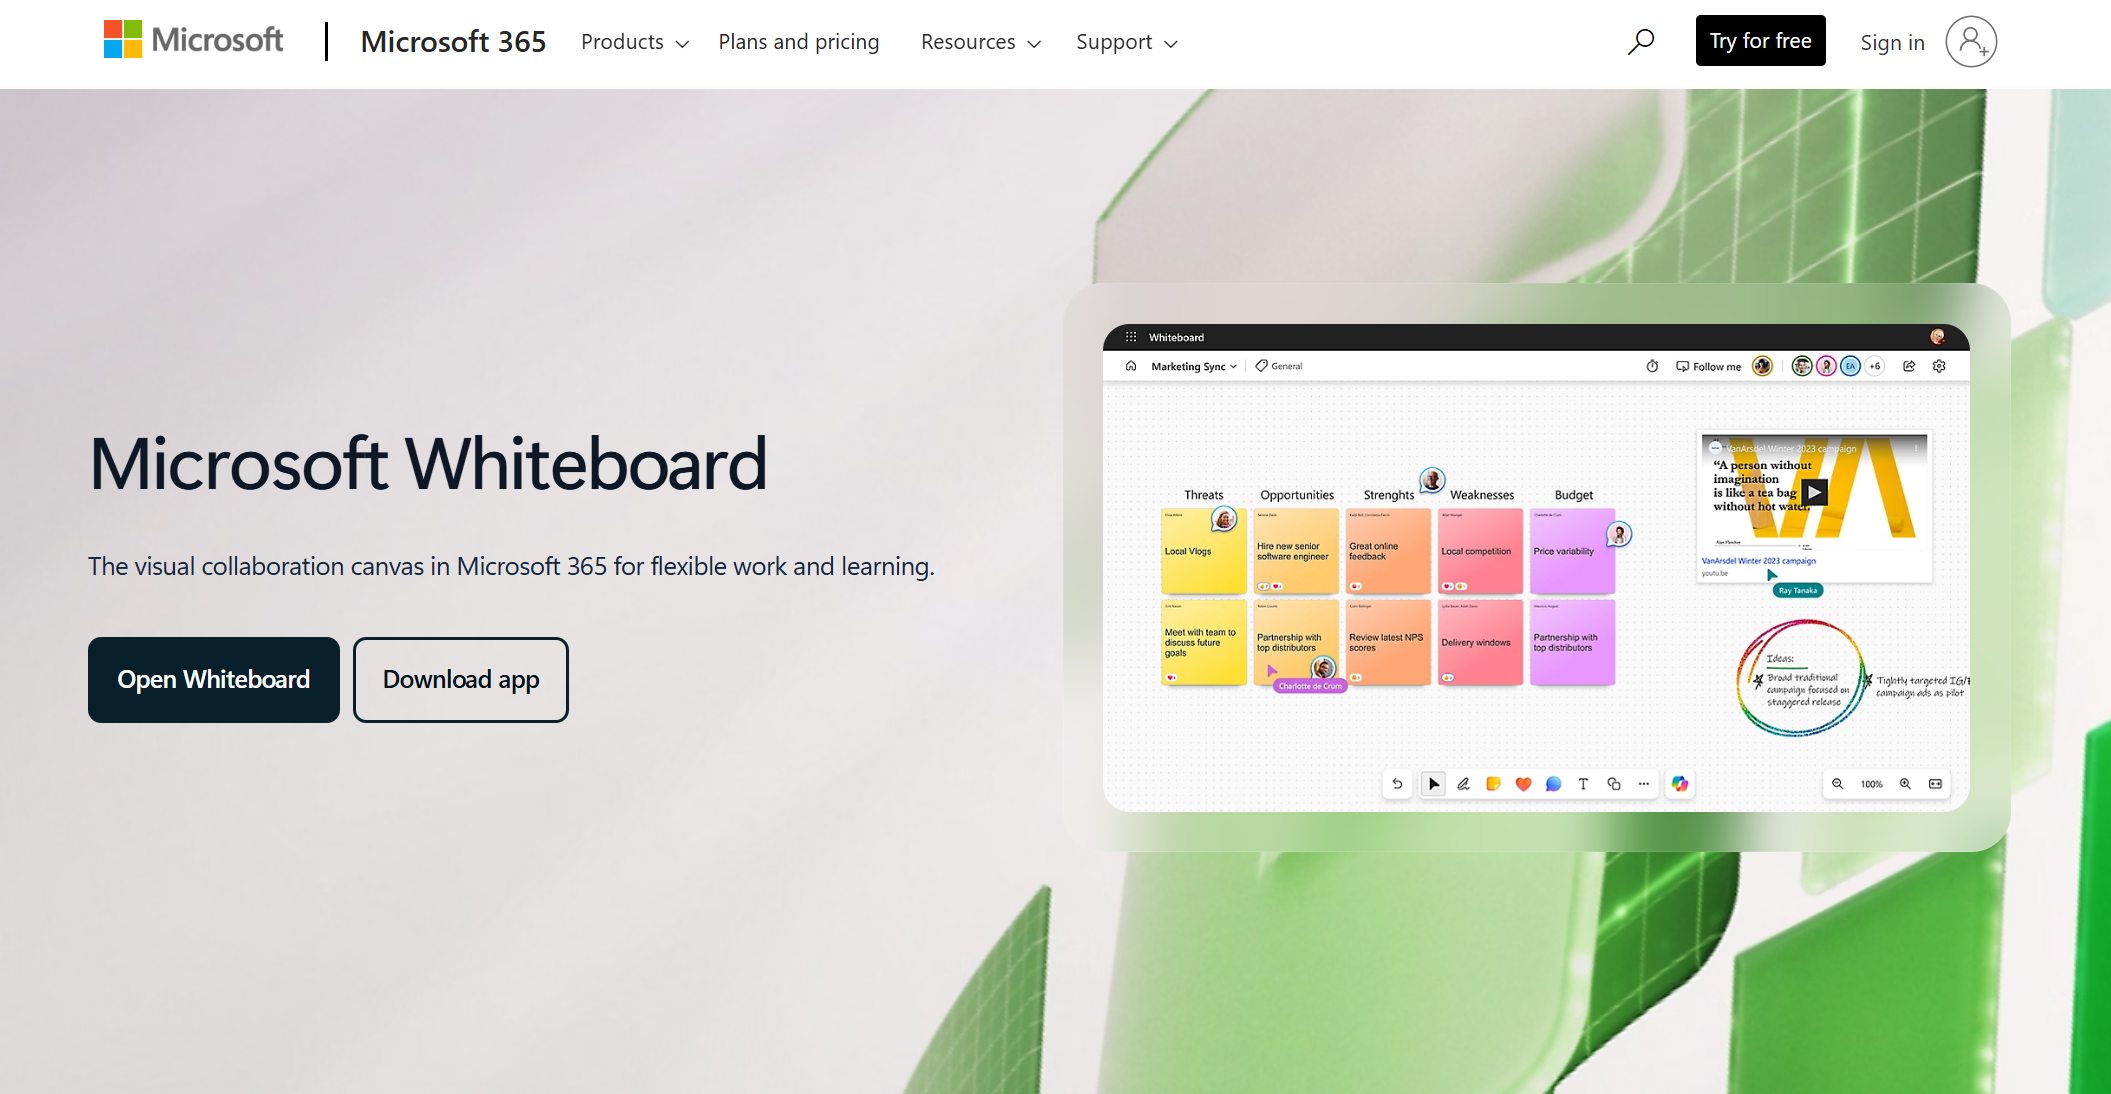
Whiteboard and sticky notes remain popular incident investigation tools for brainstorming and simple root cause analysis. You can use them to externalize your thoughts and engage your team in hands-on problem-solving. Physical sticky notes provide immediate visibility and tactile feedback, which helps you focus during meetings. However, they lack the scalability and real-time collaboration features of digital tools.
Limited scalability and organization compared to digital tools
Digital sticky notes offer searchable organization and enable real-time collaboration, which is essential for distributed teams. You can use both physical and digital sticky notes depending on your project needs.
Tip: For complex projects, consider combining whiteboards with digital root cause analysis tools to enhance accountability and speed.
You now have a comprehensive overview of the top root cause analysis tools for 2025. Each tool offers unique features to help you investigate incidents, identify root causes, and drive continuous improvement in your organization.
Key Features of Top Root Cause Analysis Tools
Data Integration and Visualization
You need tools that connect with your existing systems and bring all your data together. Leading root cause analysis software lets you examine customer interactions and operational data in one place. Machine learning adapts and refines insights over time. Visualization features help you see trends and root causes clearly. You can share reports with your team, making it easier to communicate findings and take action. A visual root cause analysis tool simplifies complex data, so you can focus on solving problems.
Automation and AI Capabilities
Modern tools use automation and AI to speed up investigations. You get complete process visibility, even across legacy systems. Some platforms work right away without extra IT projects. You can monitor thousands of employees and processes at once. Continuous monitoring helps you spot problems before they grow. Agentic AI recommends improvements and predicts the impact of changes. The table below shows the most valued automation and AI capabilities:
Capability
Description
Complete Process Visibility
Tracks work across all applications and captures human actions.
No Integration Required
Deploys quickly and starts providing insights within weeks.
Scales to Enterprise Operations
Handles global teams and complex processes.
Continuous Monitoring
Identifies process drift and enables proactive optimization.
Agentic AI Capabilities
Suggests improvements and predicts outcomes.
AI-powered Process Intelligence
Moves analysis from reactive to proactive, showing exact causes and solutions.
Collaboration and Governance
You benefit from centralized access to information. Everyone on your team sees the same data, which improves decision-making. Quality assurance teams can act quickly because they have the facts. These tools help you find recurring problems and guide your organization to improve processes. The table below highlights collaboration and governance features:
Feature
Description
Centralized Access
Ensures all team members use the same source of truth.
Informed Decision-Making
Helps teams make fast, accurate decisions.
Process Improvement
Identifies patterns and prevents future issues.
Industry-Specific Solutions (e.g., Manufacturing)
You can choose tools designed for your industry. In manufacturing, you use Pareto charts to see which problems happen most often. The 5W1H method helps you understand every part of a problem. Fishbone diagrams encourage your team to brainstorm causes. The 5xWhy technique digs deeper into issues. Healthcare teams rely on Failure Mode and Effects Analysis and Fault Tree Analysis to find and fix faulty processes. Scatter plots test correlations, while RCA2 ensures timely actions to prevent harm.
Pareto Chart: Visualizes problem frequency.
5W1H: Covers all aspects of a problem.
Fishbone Diagram: Encourages team brainstorming.
5xWhy: Investigates causes in detail.
Failure Mode and Effects Analysis: Finds and corrects faulty process parts.
Fault Tree Analysis: Diagrams potential causes.
Scatter Plot: Tests variable correlations.
RCA2: Promotes timely prevention.
Tip: When you use industry-specific tools, you solve problems faster and improve quality.
Comparing Root Cause Analysis Tools
Feature Matrix
You want to choose a root cause analysis tool that fits your needs. A feature matrix helps you compare popular methods and software. Each tool has strengths and weaknesses. For example, the 5 Whys method works quickly and feels intuitive, but it may oversimplify complex problems. Fishbone diagrams encourage brainstorming, though they need team agreement. AI-powered RCA tools scale well and handle large data sets, but they require high-quality data and digital maturity.
FineBI stands out for its ability to integrate data from over 60 sources, support AI-powered analysis, and provide interactive dashboards. You can use it for both simple and complex investigations, especially in manufacturing and enterprise environments.
Pricing Overview
Pricing models for root cause analysis tools vary. Some offer free trials or free versions. Others charge per user or by team. For example, SafetyCulture starts at $19 per user per month. Datadog starts at $15 per user per month. Sologic Causelink offers an individual plan at $384 per year and a team plan at $6,250 per year.
Vendor
Pricing Details
Individual Plan
Starts at $384 per year
Team Plan
Starts at $6,250 per year
SafetyCulture
Free trial; Paid plans start at $19/user/month
Intelex
Free trial; Contact for pricing
EHS Insight
Free trial; Contact for pricing
Datadog
Free trial; Paid plans start at $15/user/month
Sologic Causelink
Free trial; Individual $384/year, Team $6,250/year
Tip: Always check for free trials before you commit. You can test features and see if the tool fits your workflow.
Best Use Cases by Industry
You should match the tool to your industry. Manufacturing teams often use FineBI for quality control, defect analysis, and process optimization. IT teams prefer Datadog or Logz.io for real-time monitoring and incident management. SafetyCulture works well in healthcare and field operations. Sologic Causelink and TapRooT suit large enterprises with complex investigation needs.
FineBI gives you advanced analytics, seamless data integration, and secure collaboration. You can use it to drive smarter decisions and improve quality across your organization.
You want a tool that fits your workflow and helps you solve problems faster. Start by looking for these important features:
Data Integration: Choose a tool that connects to all your data sources. This makes it easier to see the full picture.
Visualization: Pick software that turns data into charts and dashboards. Visuals help you spot trends and root causes quickly.
Automation and AI: Look for tools with automation. AI features can find patterns and suggest solutions before you notice a problem.
Collaboration: Make sure your team can share findings and work together in real time.
Security and Governance: Protect your data with role-based access and audit trails.
Industry Fit: Some tools work better in certain industries. For example, FineBI supports manufacturing quality control.
Tip: Test the tool with a free trial. You can see if it matches your needs before you buy.
Matching Tools to Business Needs
You should match the tool to your business goals and challenges. Use the table below to guide your choice:
Business Need
Best Tool Type
Example Solution
Quality Control in Manufacturing
BI Platform with RCA features
FineBI
IT Incident Management
AI-powered RCA software
Datadog, Logz.io
Safety and Compliance
Mobile-first RCA tool
SafetyCulture
Simple Brainstorming
Physical/Digital Whiteboard
Sticky Notes
Enterprise Collaboration
Dedicated RCA platform
Sologic Causelink
You should ask these questions:
Does the tool support your data sources?
Can your team use it without much training?
Does it scale as your business grows?
You make a smarter choice when you focus on your real needs. The right tool helps you find root causes, improve processes, and reach your goals.
You gain a clear advantage when you use advanced root cause analysis tools. These solutions help you solve problems faster and improve business performance. Consider your industry, data complexity, and teamwork needs before you choose a tool. Explore FineBI if you want integrated analytics and strong quality control, especially in manufacturing. Start a free trial or talk with your team to find the best fit.
Access a wealth of case studies, industry insights, and solution guides to accelerate digital transformation.
FAQ
What is root cause analysis?
Root cause analysis helps you find the main reason behind a problem. You use it to fix issues at their source and prevent them from happening again.
How do root cause analysis tools improve business efficiency?
You use these tools to spot patterns, reduce mistakes, and solve problems faster. They help you save time and resources by focusing on the real issues.
Can you use root cause analysis tools in any industry?
Yes. You can apply these tools in manufacturing, IT, healthcare, and customer service. They help you solve problems and improve quality in many fields.
What features should you look for in a root cause analysis tool?
Look for data integration, visualization, automation, collaboration, and security. These features help you analyze data, share insights, and protect information.