PR teams are under pressure to prove more than activity. Leadership wants to know whether media coverage improved visibility, influenced audience behavior, reduced risk, supported pipeline, or strengthened brand trust. That is why pr analytics reporting needs a repeatable framework, not a collection of screenshots and disconnected metrics.
A strong framework helps communications teams move from “here is what we did” to “here is what changed, why it matters, and what to do next.” It also becomes far more powerful when reporting is paired with an AI assistant. With FineReport + Dora, teams can ask for a report summary in chat, generate structured narratives from trusted report assets, receive scheduled briefings, and push exceptions to the right owner.
 Click To Try The Dashboard
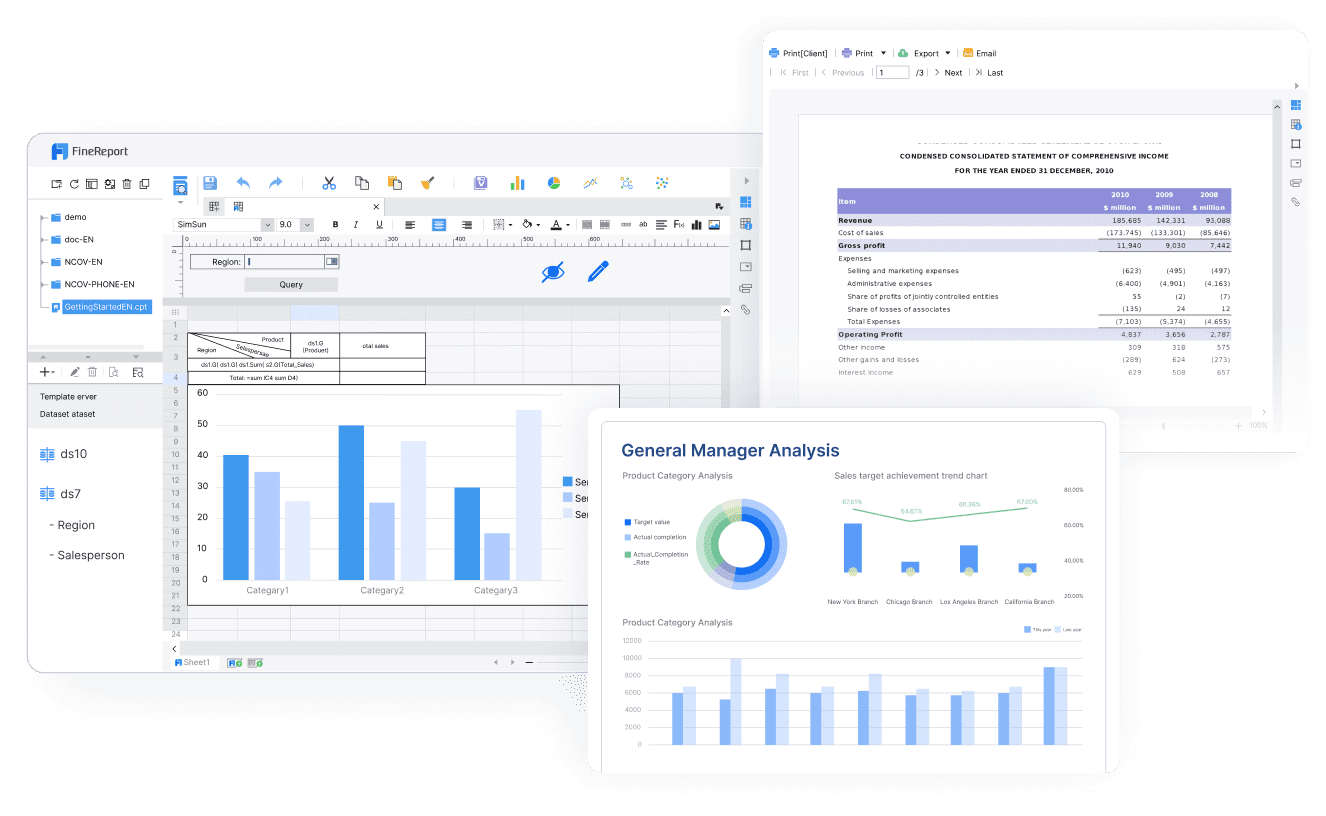
All reports in this article are built with FineReport
What a PR Analytics Reporting Framework Is and Why It Matters
A PR analytics reporting framework is a structured way to define what communications teams track, how they measure performance, how often they report, and how they explain results to decision-makers.
In practice, the framework should answer five questions:
- What are we trying to achieve?
- What signals show progress?
- What trusted data sources support the analysis?
- How do we separate activity from outcomes and business impact?
- How do we present results in a way executives can act on?
Without a framework, reporting often becomes inconsistent. Different teams use different definitions, campaign summaries change format every month, and executives receive metrics with little context. That weakens accountability and makes budget discussions harder.
A consistent framework improves:
- Decision-making: leaders can quickly spot trends, risks, and opportunities
- Accountability: communications teams can report performance against defined goals
- Budget justification: PR investment is easier to defend when reporting ties to business outcomes
- Cross-functional alignment: marketing, digital, brand, and executive teams can work from shared metrics
- Operational efficiency: standard report templates reduce manual work and improve reporting quality
The biggest mindset shift is understanding the difference between activity reporting and outcome-focused measurement.
- Activity reporting shows what the team did, such as press releases issued, pitches sent, or media briefings held.
- Outcome-focused measurement shows what happened because of those efforts, such as quality coverage, traffic lift, improved sentiment, executive visibility, or stronger branded search demand.
Both matter, but they should not be confused. Activity is necessary context. Outcomes are what executives use to assess value.

What to Track in PR Analytics Reporting
The right metrics depend on the business, audience, and campaign goals, but most PR reporting should cover three levels: visibility, audience response, and business or reputation indicators.
Coverage and Visibility Metrics
These metrics help teams understand whether PR is generating meaningful exposure in the right places.
Definition: The number of articles, mentions, interviews, or placements secured across target media channels.
Business value: Shows campaign output and market visibility.
AI use: Dora can summarize placement volume by period, compare coverage by campaign, and explain unusual spikes or declines in a structured report summary.
Media placements alone are not enough, but they remain a basic indicator of execution. The better question is whether the placements happened in publications that influence target stakeholders.
Share of voice
Definition: The percentage of relevant media conversation your brand owns compared with competitors.
Business value: Indicates competitive visibility and whether your message is gaining market attention.
AI use: Dora can pull share-of-voice trends from a FineReport PR cockpit, identify top competitors gaining traction, and generate a concise executive narrative.
Share of voice is especially useful in product launches, crisis periods, and category education campaigns. It helps answer whether the brand is winning attention, not just appearing occasionally.
Reach
Definition: The estimated size of the audience exposed to earned media coverage.
Business value: Provides directional scale for visibility.
AI use: Dora can include reach changes in a scheduled weekly briefing and flag when reach rises but engagement remains weak.
Reach should be interpreted carefully. It estimates potential audience size, not actual influence or action. That is why it works best when paired with engagement and quality signals.
Publication quality
Definition: An assessment of whether coverage appeared in target-tier publications, priority vertical outlets, or channels that matter to investors, buyers, regulators, or talent.
Business value: Helps distinguish meaningful visibility from low-value volume.
AI use: Dora can classify coverage by publication tier, outlet type, and strategic relevance based on governed business rules.
A smaller number of placements in highly relevant outlets may be far more valuable than a high count of low-impact mentions.
Message pull-through
Definition: The extent to which core brand messages, positioning statements, or executive talking points appear in coverage.
Business value: Shows whether the market is hearing the narrative the company wants to communicate.
AI use: Dora can review report outputs, detect message adoption patterns, and summarize which messages are landing versus being ignored.
For executive reporting, message pull-through is often more meaningful than raw mention count. It connects communications work to strategic positioning.
Engagement and Audience Response Metrics
Once visibility is established, the next step is measuring what audiences did in response.
Website traffic from coverage
Definition: Visits to owned web properties driven by media placements, tracked through referral sources, campaign links, or analytics tools.
Business value: Shows whether PR is moving audiences from awareness to active interest.
AI use: Dora can retrieve referral traffic metrics from FineReport dashboards and explain which placements generated the strongest response.
This is one of the most practical bridges between PR and digital performance. It helps teams identify which outlets, headlines, or topics actually drive action.
Referral behavior
Definition: The quality of sessions generated by PR-driven traffic, including time on page, bounce rate, pages per session, and next-step behavior.
Business value: Clarifies whether visitors are engaged or merely curious.
AI use: Dora can compare high-volume referrals with high-quality referrals and summarize where PR traffic is most valuable.
Not all traffic is equal. A smaller number of highly engaged visitors often matters more than a large number of low-intent clicks.
Content engagement
Definition: How audiences interact with owned content after arriving from earned media, such as downloading a report, watching a video, reading multiple pages, or signing up for a webinar.
Business value: Indicates whether PR is helping content consumption and demand development.
AI use: Dora can connect PR-sourced visits with downstream content engagement and produce chart-based explanations for campaign reviews.
This is particularly useful for B2B organizations that rely on thought leadership and category education.
Branded search lift
Definition: An increase in searches for your company, executives, products, or key campaigns after PR activity.
Business value: Suggests improved awareness and market interest.
AI use: Dora can highlight correlations between coverage periods and branded search trends in recurring briefings.
Branded search is a helpful supporting signal because strong PR often increases curiosity even when users do not click directly from an article.
Business and Reputation Indicators
Executive teams usually care most about whether PR supports business goals and protects or strengthens reputation.
Leads and conversions
Definition: Form fills, demo requests, subscriptions, or other measurable conversions influenced by PR exposure or PR-driven traffic.
Business value: Connects earned media to pipeline and revenue-related activity.
AI use: Dora can summarize conversion contribution by campaign, channel, or publication source using governed attribution logic.
This area requires careful attribution. PR rarely acts alone, but it can still be measured as a contributor in the customer journey.
Sentiment trends
Definition: Directional analysis of positive, neutral, and negative coverage or audience response over time.
Business value: Helps identify reputation improvement, emerging risk, or narrative deterioration.
AI use: Dora can monitor exception thresholds, identify sentiment shifts, and trigger alerts through a Risk Alert Officer workflow.
Sentiment should never be treated as perfect truth, but it is useful when reviewed alongside context and manual validation.
Executive visibility
Definition: How often senior leaders appear in relevant media, thought leadership discussions, or high-value industry conversations.
Business value: Supports authority, investor confidence, category leadership, and employer brand.
AI use: Dora can build scheduled executive visibility summaries and prepare concise pre-meeting briefings.
For many organizations, executive presence is a major PR goal. Reporting should show both volume and quality of that visibility.
Brand trust signals
Definition: Indicators that suggest improved credibility, such as favorable tone in key outlets, increased analyst attention, stronger inbound partnership interest, or positive stakeholder response.
Business value: Supports long-term brand value and resilience.
AI use: Dora can combine trust-related metrics into a management briefing and surface warning signals that deserve follow-up.
Trust is harder to measure than traffic, but it often matters more at the executive level. A good framework includes directional indicators, not just hard conversion metrics.
Tracking metrics is not enough. The framework must also define measurement discipline, data trust, and interpretation rules.
Set Goals, Baselines, and Reporting Periods
Before building a report, define what success means.
Define campaign objectives
PR goals should be specific to the scenario. For example:
- Increase share of voice in a priority market
- Improve executive visibility ahead of fundraising
- Drive traffic to a research report
- Support product launch awareness
- Reduce negative narrative concentration during a sensitive period
Each objective should map to a small group of primary metrics and a wider set of supporting indicators.
A baseline gives context to every result. If branded search increased 15%, is that significant? Only if you know what normal performance looks like.
Baseline dimensions may include:
- Prior quarter performance
- Same period last year
- Pre-campaign average
- Competitor benchmark
- Target goal
Choose reporting cadences that match decision needs
Different audiences need different reporting rhythms:
- Weekly: fast operational visibility, campaign monitoring, issue detection
- Monthly: management review, trend analysis, budget and resource adjustments
- Quarterly or campaign-end: strategic effectiveness and planning decisions
A good pr analytics reporting framework avoids both extremes: reporting too often without insight, or reporting so rarely that action comes too late.
Use Reliable Data Sources and Attribution Methods
Accuracy improves when PR teams combine multiple trusted systems instead of relying on one dashboard.
Common data sources to combine
- Media monitoring platforms
- Web analytics platforms
- Social listening tools
- CRM or marketing automation systems
- Campaign tracking links and UTMs
- Brand search trend data
- Internal executive activity or event logs
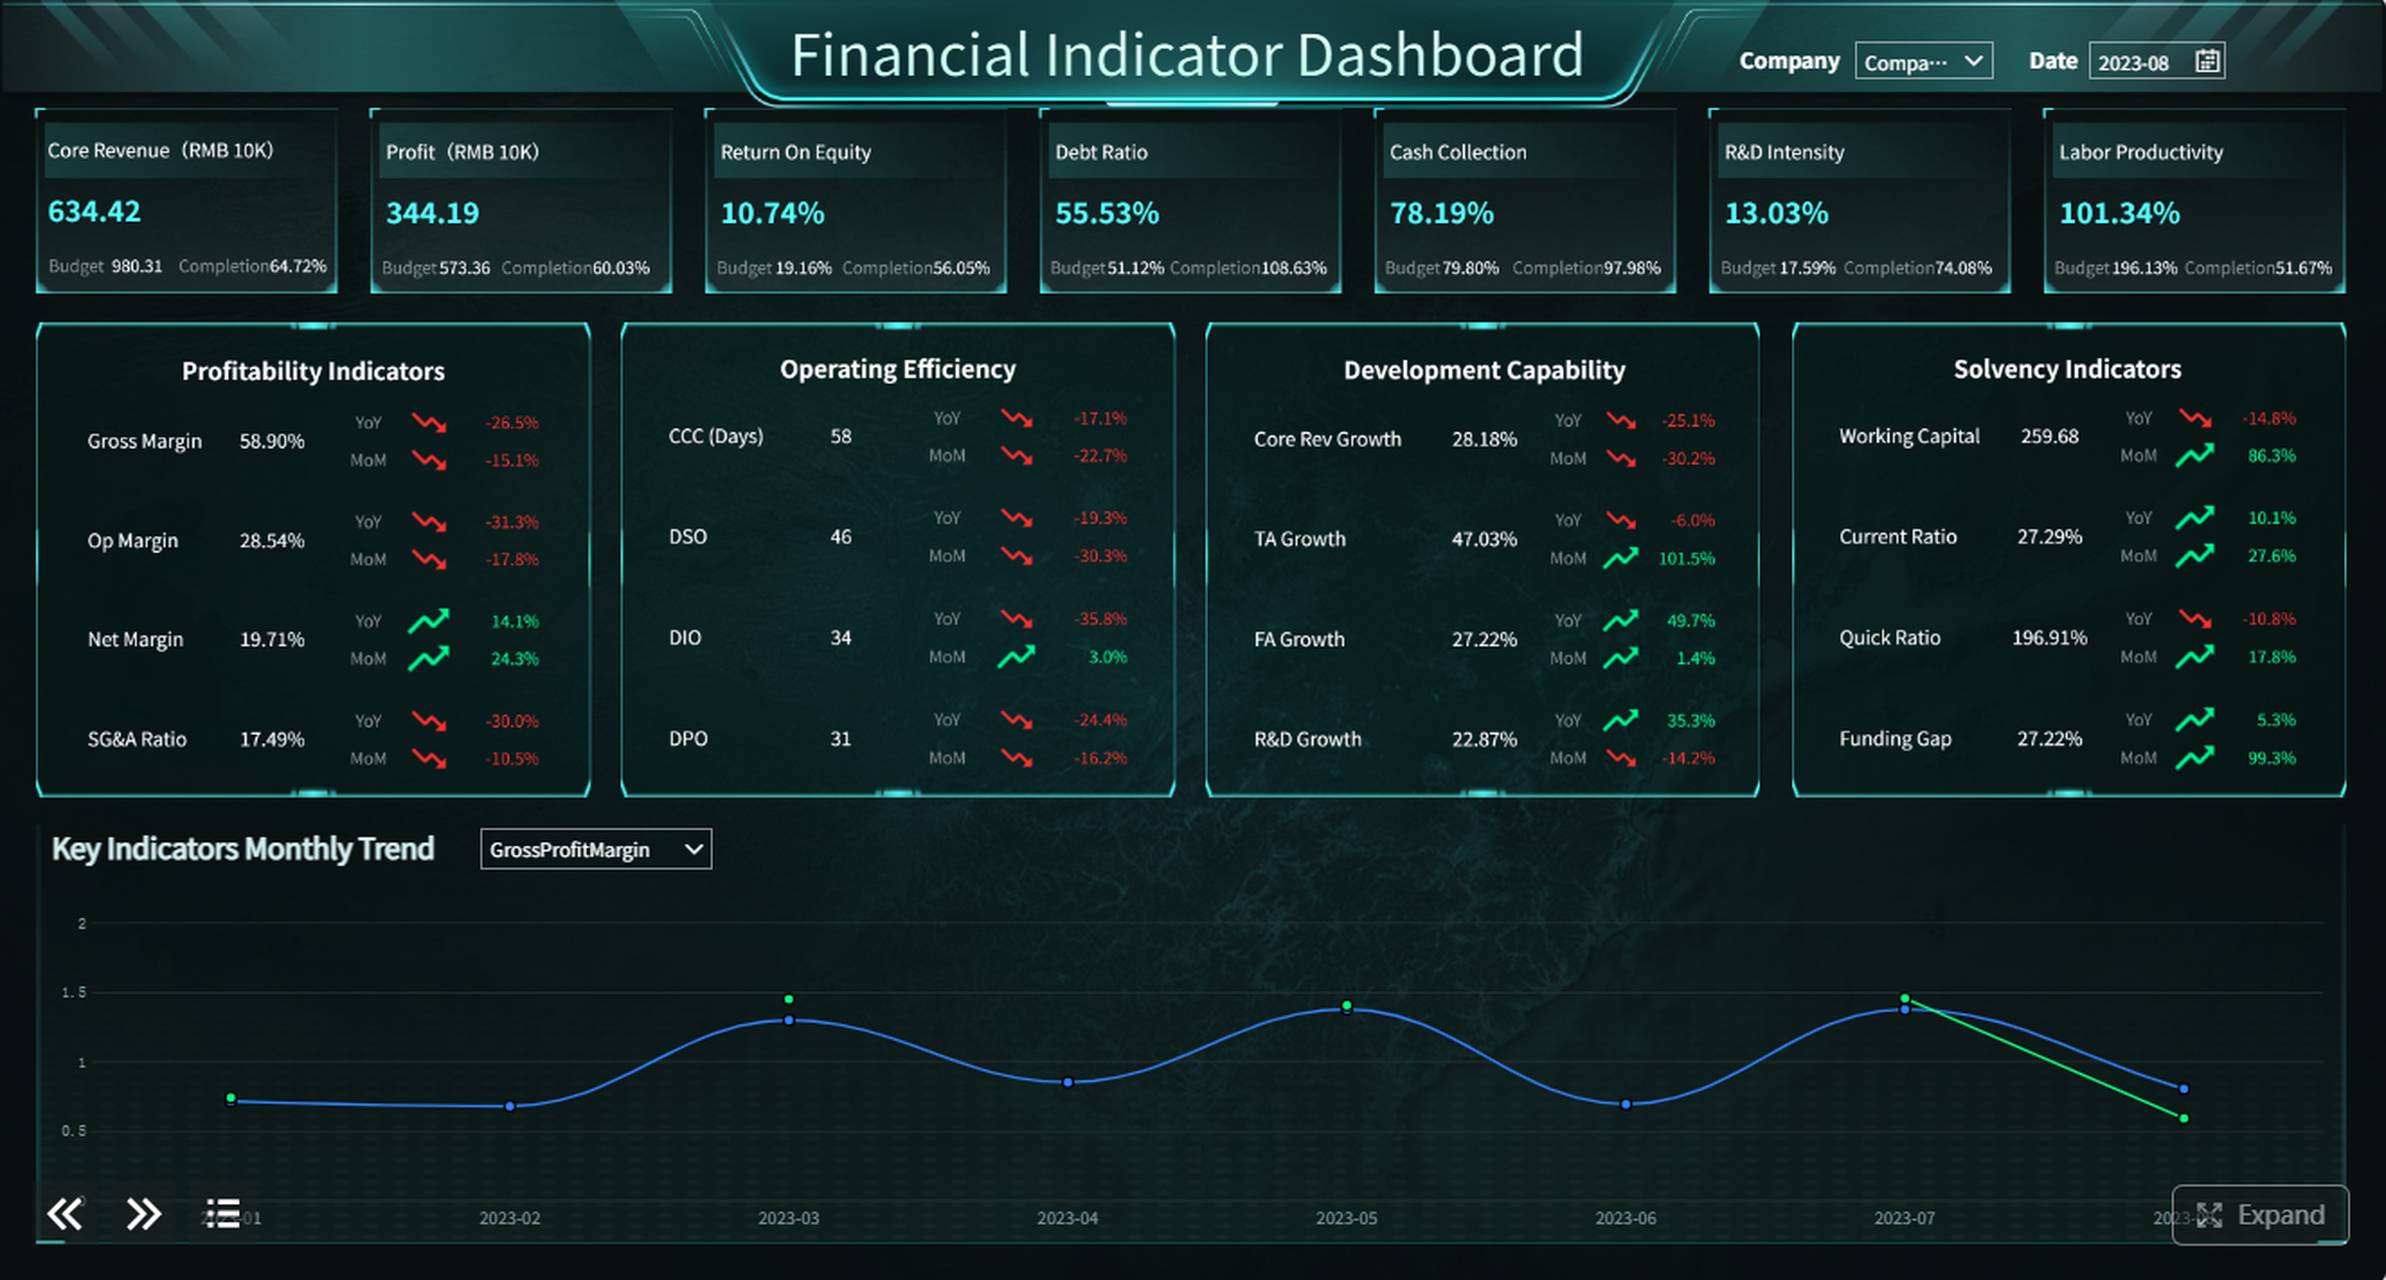
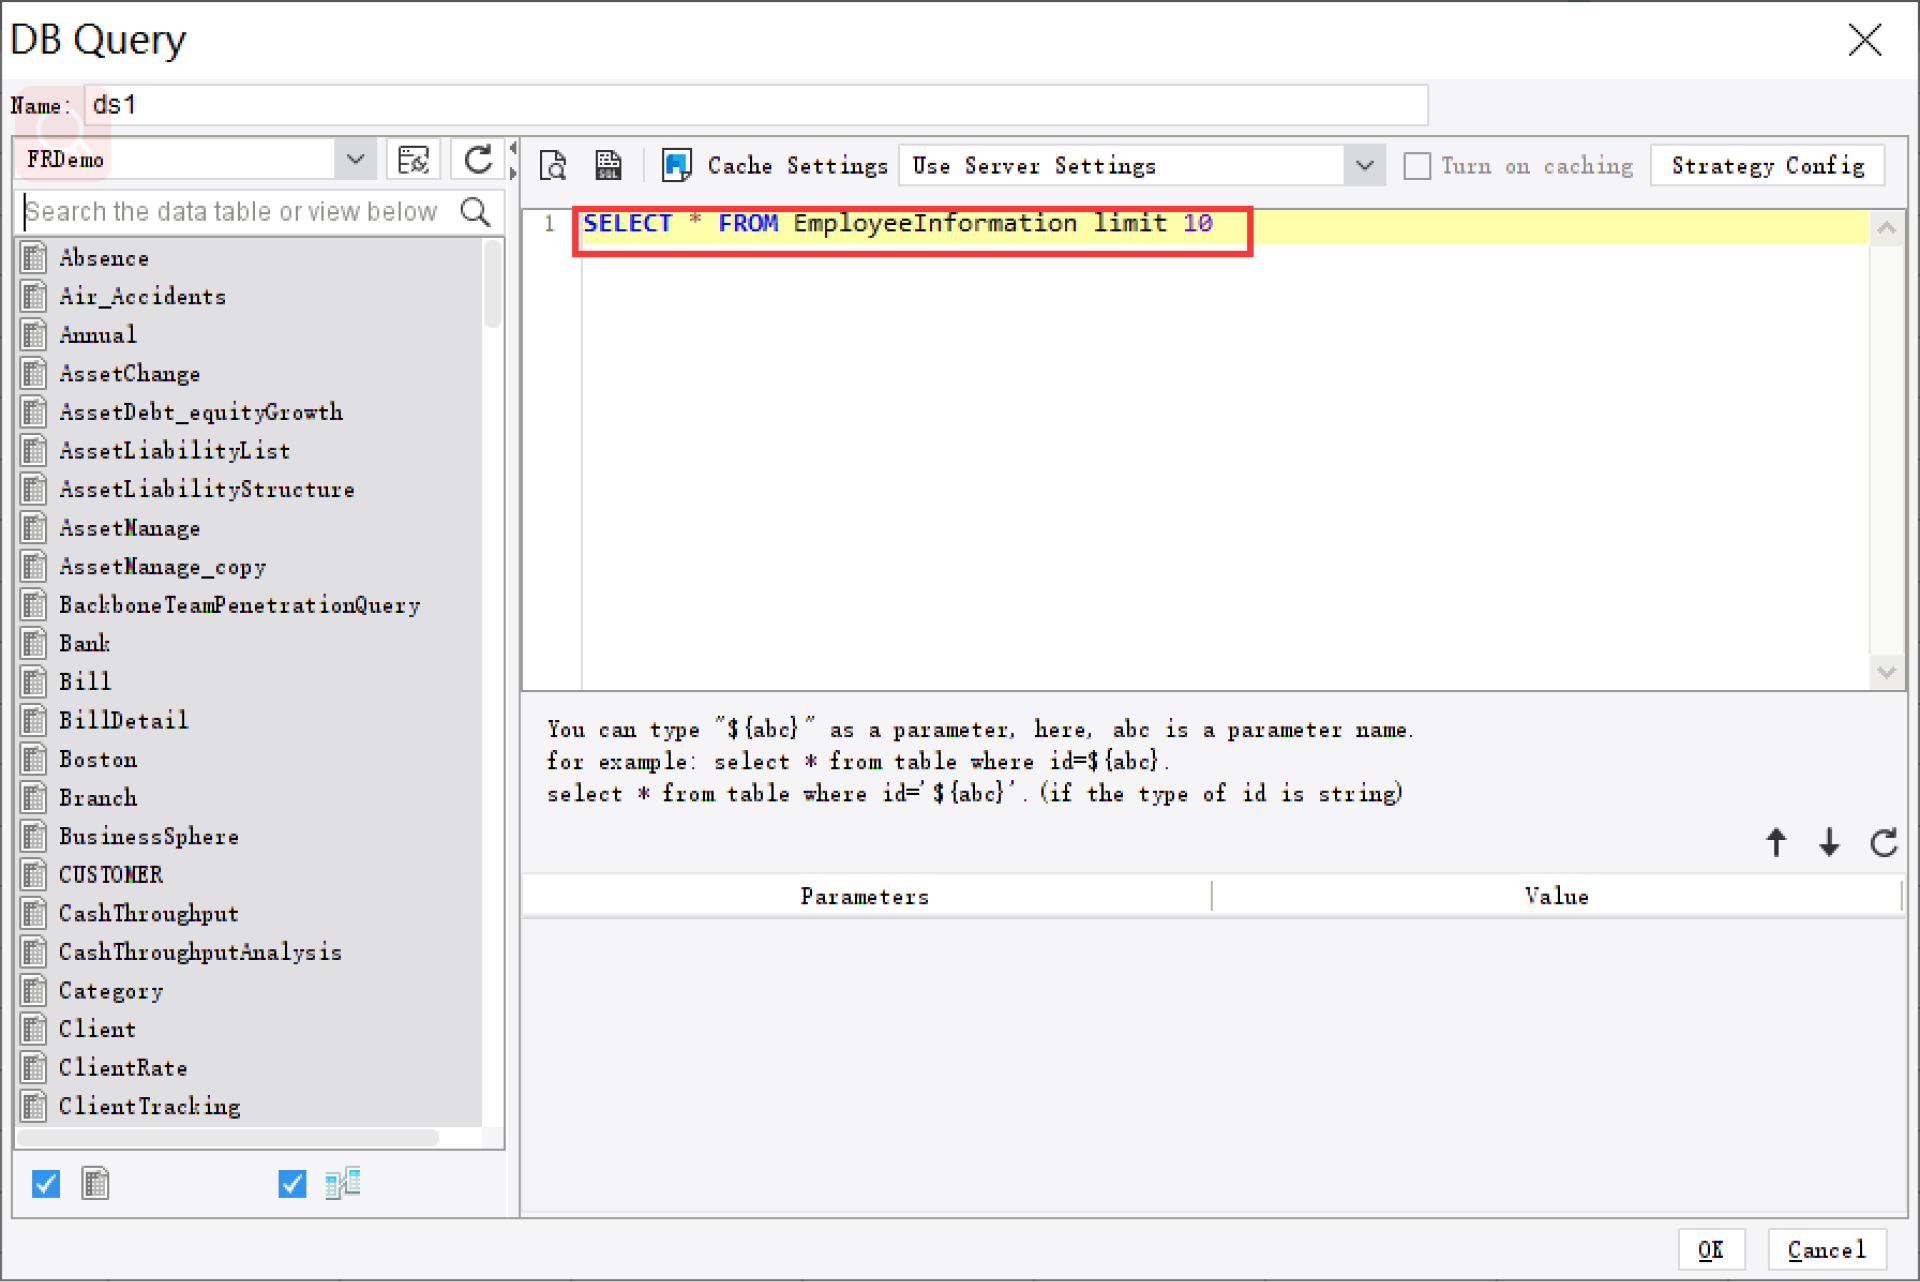
FineReport is well suited to bring these reporting assets together into a governed PR reporting cockpit. Instead of distributing fragmented files, teams can standardize metrics, filters, report templates, and executive views in one reporting layer.
Improve attribution confidence
PR attribution is never perfect, but it can be made more reliable through structured methods:
- Use tracking links wherever possible
- Tag campaign landing pages consistently
- Align CRM fields with campaign naming
- Distinguish direct traffic spikes from referral traffic
- Review assisted conversions, not just last-touch conversions
- Compare exposed periods with baseline periods
What matters is not pretending attribution is perfect. It is building a transparent method that leadership trusts.
Separate Outputs, Outcomes, and Impact
This is one of the most important disciplines in communications measurement.
Outputs
These are the things the PR team produced or secured.
Examples:
- Press releases issued
- Media pitches sent
- Interviews arranged
- Placements secured
- Executive bylines published
Outputs show activity and execution capacity.
Outcomes
These are the audience responses to the outputs.
Examples:
- Share of voice growth
- Referral traffic from coverage
- Branded search increase
- Improved message pull-through
- Stronger engagement with linked content
Outcomes show whether communications activity influenced attention or behavior.
Impact
These are the business or strategic changes leadership cares about.
Examples:
- Higher lead volume from PR-supported campaigns
- Improved reputation trend
- Reduced negative narrative exposure
- Better investor or analyst visibility
- Stronger trust in executive messaging
Impact is usually influenced by more than PR alone, but PR can still be measured as a meaningful contributor.
How to Build Executive-Friendly PR Reports
Most PR reports fail with executives for a simple reason: they are designed for specialists, not decision-makers. Leaders want business relevance, concise interpretation, and clear next steps.
Focus on the Metrics Leaders Actually Care About
Executives usually do not need every operational detail. They need a selective view of performance tied to business context.
Prioritize:
- Progress against goals
- Trend direction
- Competitive position
- Major risks or anomalies
- Opportunities to amplify what is working
- Implications for budget, reputation, or growth
For example, instead of listing 40 placements, report that:
- Tier-1 media coverage increased compared with last month
- Share of voice improved against two core competitors
- Traffic from earned media rose, but conversion quality was mixed
- One negative narrative is accelerating and needs response alignment
That is a leadership-ready summary.
Turn Data into a Clear Narrative
A strong report should answer four executive questions:
- What happened?
- Why did it happen?
- What does it mean for the business?
- What should happen next?
This narrative structure makes PR data easier to absorb and act on.
A practical format is:
- What happened: “Executive visibility increased 28% this month due to conference coverage and two bylined articles.”
- Why it happened: “The thought leadership campaign aligned with industry event timing and secured placements in priority trade media.”
- What it means: “The brand gained stronger presence in a high-value buyer audience, supporting category authority.”
- Next step: “Replicate this format around next quarter’s product announcement and expand spokesperson preparation.”
This is where structured reporting templates become valuable. FineReport can standardize the scorecards, comparison views, commentary blocks, and management layouts, while Dora can help generate the first draft of the narrative from governed report assets.
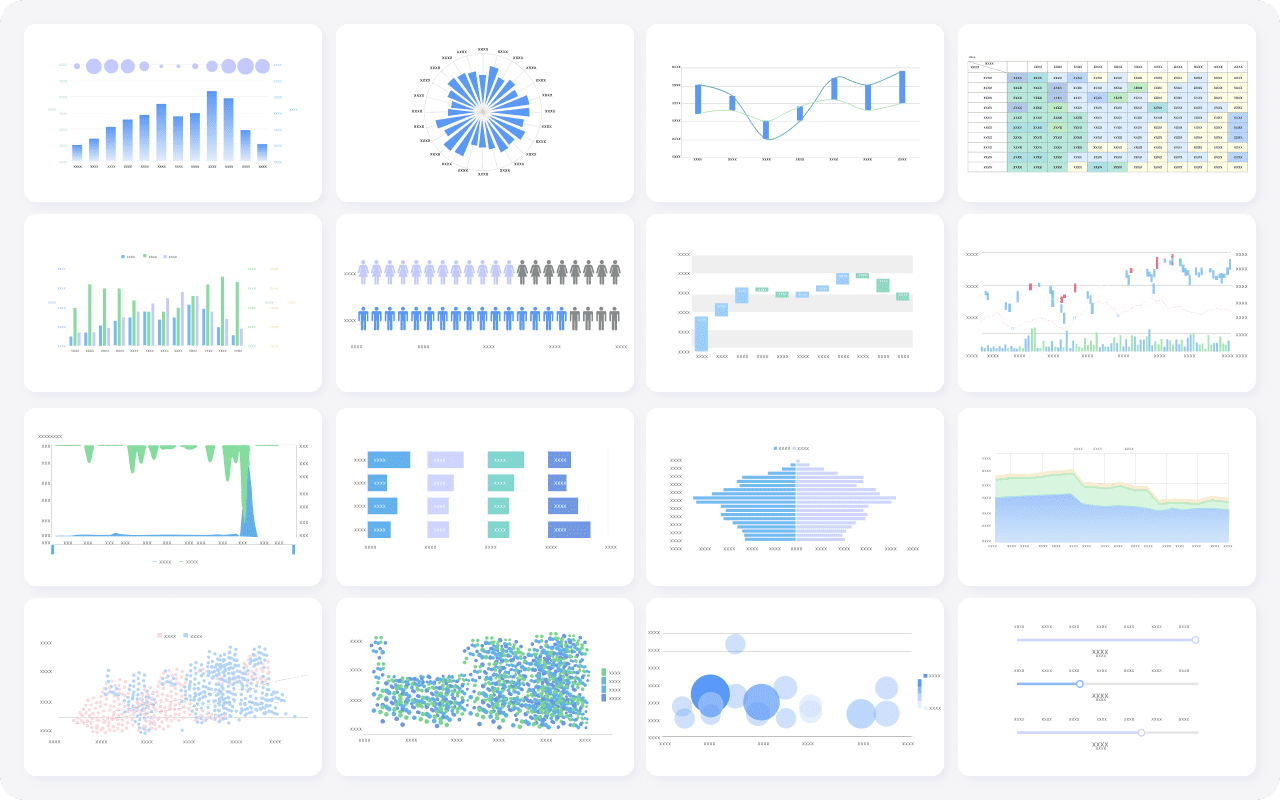
Use Visuals and Benchmarks to Simplify Interpretation
Executives respond best to fast interpretation.
Useful visual elements include:
- Scorecards for top KPIs
- Period-over-period trend charts
- Goal attainment indicators
- Competitor comparison tables
- Coverage quality heat maps
- Exception lists for major risks
- Short commentary beside each visual
FineReport is particularly effective for building executive-friendly PR cockpits because it supports formatted reports, management dashboards, and operational views that can combine both quantitative metrics and decision-ready commentary.
How an AI Data Agent Automates Report Consumption
A common reporting bottleneck is not building the report once. It is the repeated work of reviewing it, summarizing it, answering follow-up questions, and pushing the right insight to the right stakeholder on time.
This is where Dora, FanRuan’s enterprise Data Agent platform, creates practical value on top of FineReport.
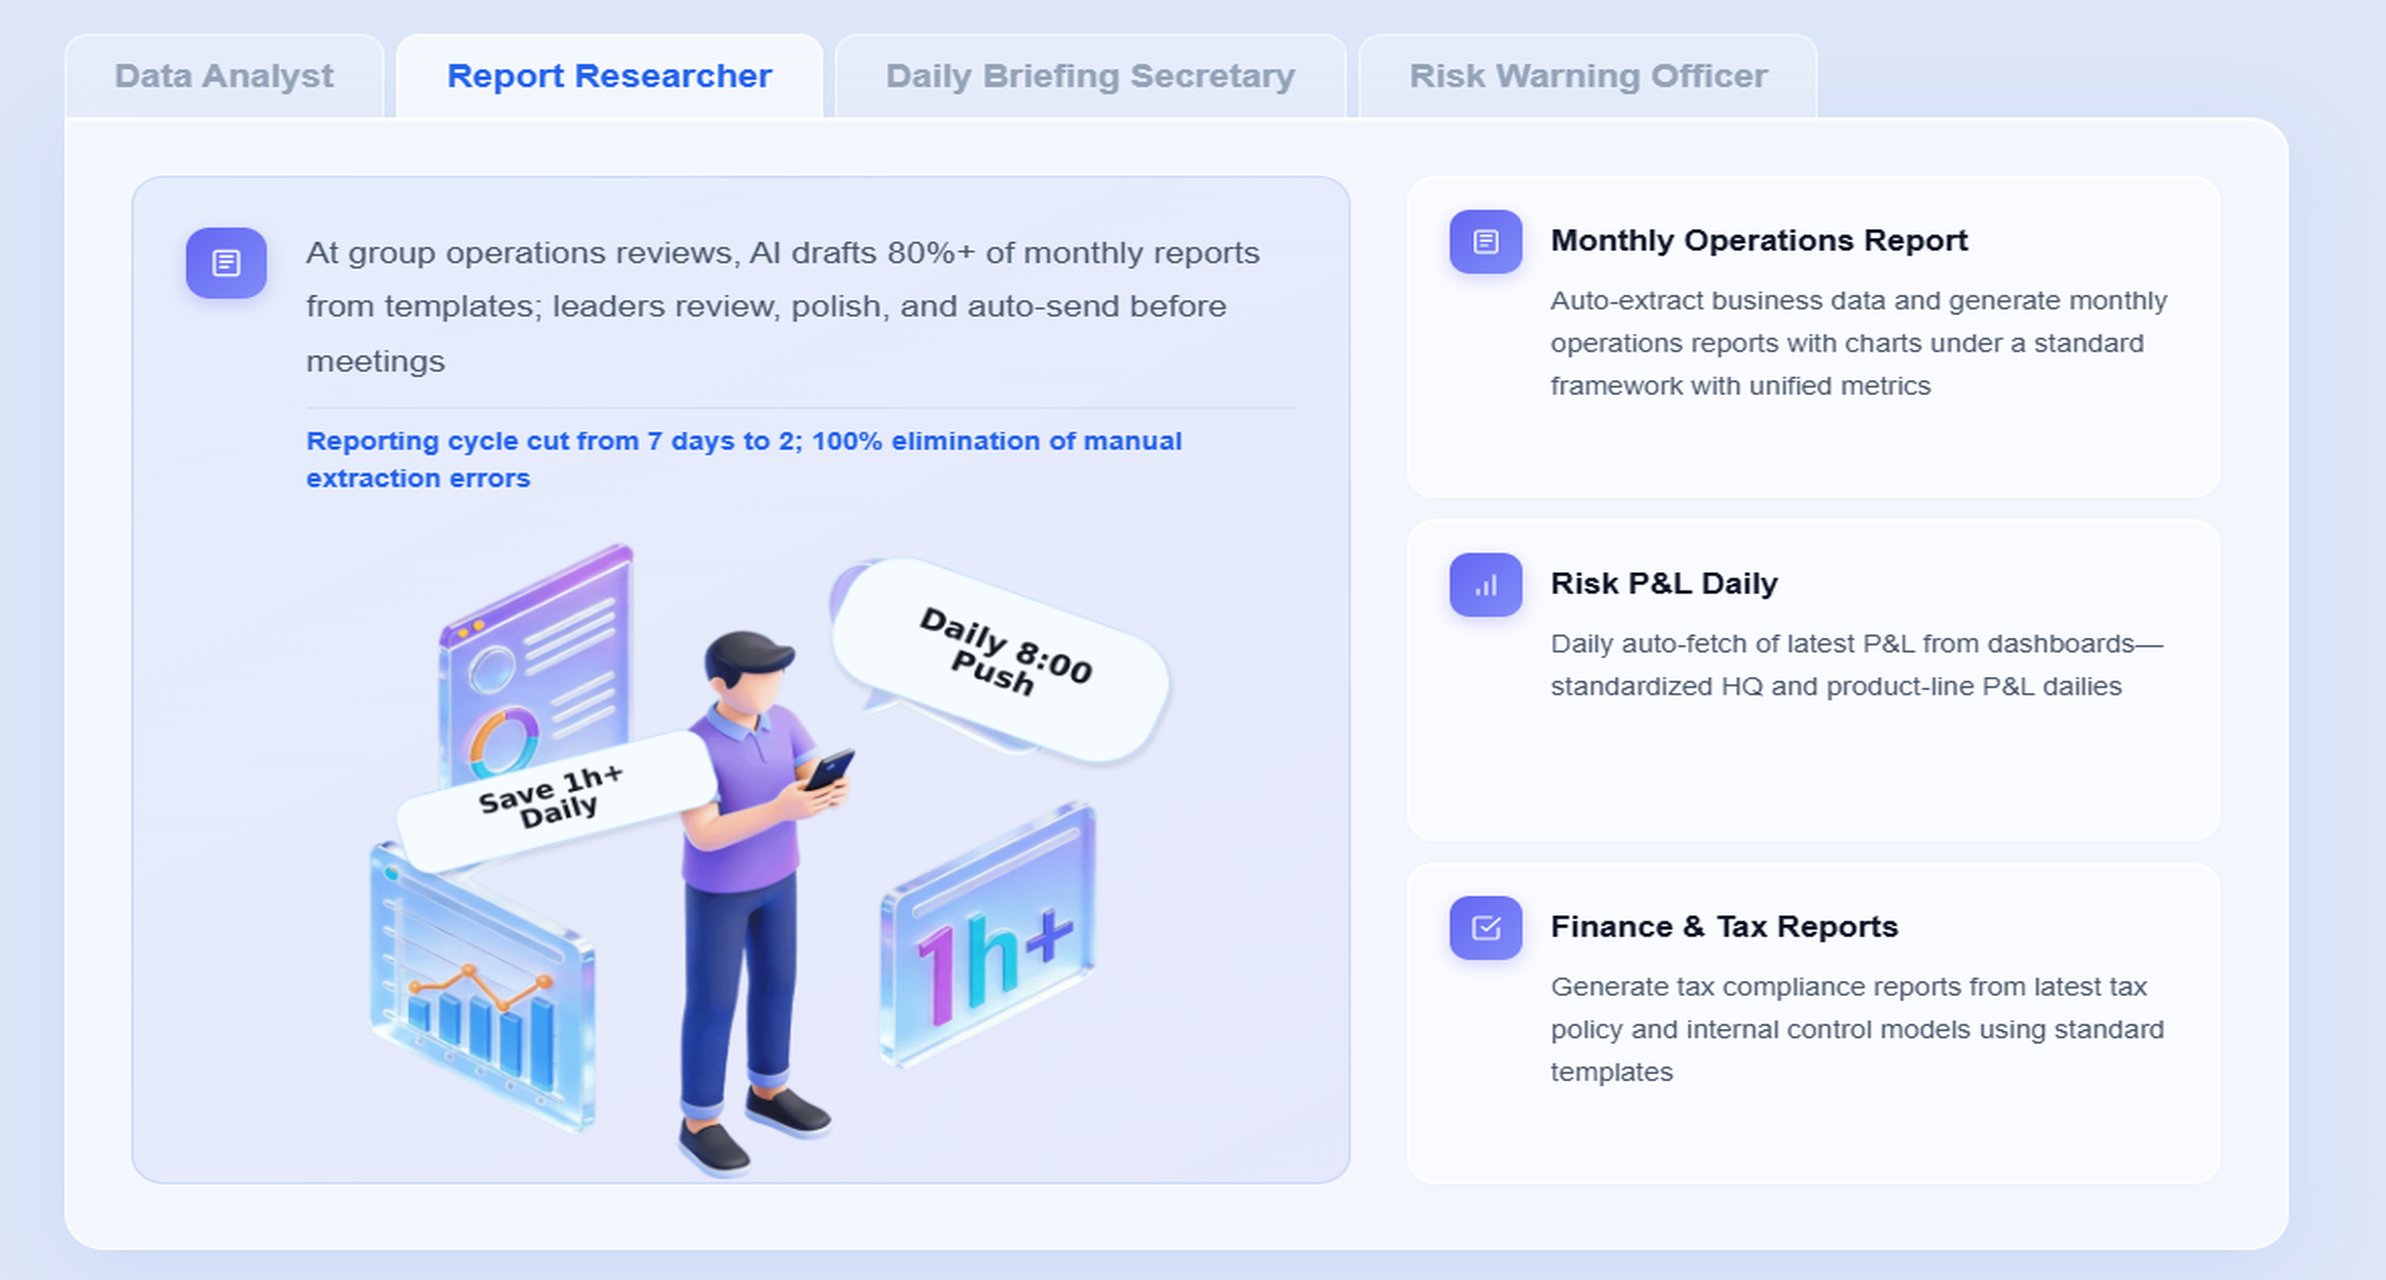
For PR analytics reporting, the most relevant digital employees are:
- Report Researcher: turns report outputs into structured management summaries
- Daily Briefing Secretary: sends scheduled PR and reputation briefings to leaders
- Data Analyst digital employee: answers natural-language questions about metrics, trends, and drivers
- Risk Alert Officer: monitors negative coverage spikes, sentiment shifts, or missed thresholds and pushes alerts for follow-up
FineReport provides the trusted reporting and semantic foundation. It standardizes KPI definitions, report templates, filters, access permissions, and the PR reporting cockpit. Dora works on top of that foundation to help users consume reports faster through governed AI workflows.
A concrete chat example
A communications director could ask:
“Summarize this month’s PR analytics reporting dashboard, highlight any decline in share of voice, explain which coverage drove the most website traffic, and list the reputation risks that need executive attention.”
Instead of manually reviewing multiple report tabs and rewriting findings in email, Dora can use the trusted FineReport assets to return a structured answer.
A practical AI workflow for PR analytics reporting
-
Retrieve trusted FineReport report or cockpit data
Dora accesses the governed PR dashboard, executive report, or campaign reporting template already built in FineReport.
-
Understand KPI definitions, filters, and business rules
It uses the semantic layer for terms such as share of voice, publication tier, branded search lift, referral traffic, campaign period, and sentiment threshold.
-
Generate a structured report summary through chat
Dora creates an executive-friendly narrative that explains major changes, key drivers, publication quality, and business implications.
-
Detect exceptions and abnormal changes
If negative coverage rises, traffic quality drops, or a campaign misses target thresholds, Dora can surface these issues as exceptions.
-
Push summaries and alerts to responsible users
A Daily Briefing Secretary can send scheduled weekly PR summaries to executives, while a Risk Alert Officer can notify communications or brand leads about emerging issues.
-
Create follow-up records and recurring review summaries
Dora can support recurring management review by preparing daily, weekly, or monthly briefing outputs linked back to the FineReport source reports.
Why this works in an enterprise setting
This approach is more practical than relying on raw prompts against disconnected tools.
- FineReport provides governed reports, templates, KPI rules, and permissions.
- Dora adds the AI assistant layer for query, summary, push, alert, and follow-up.
- The result is a more controllable Agentic BI workflow for PR reporting.
This matters because executive reporting requires consistency. If every metric is defined differently, if permissions are unclear, or if the AI has no trusted semantic structure, the summaries will not be reliable enough for management use.
Dora is also not a generic chatbot. It is an enterprise Data Agent designed for scenario execution. That means communications teams can use controlled Skills and governed workflows to reduce operating friction, improve response speed, and support more stable reporting processes than prompt-only agent approaches.
Practical use cases include:
- Weekly executive PR briefings
- Campaign-end summary generation
- Reputation risk monitoring and alert push
- Ad hoc natural-language questions over PR reporting assets
- Meeting preparation for communications leaders and executives
For business users, this means timely answers without hunting through multiple reports. For IT and data teams, it means they can focus on data connection, semantic design, KPI governance, permissions, and reusable Skills instead of manually packaging every report request.
Common Reporting Mistakes to Avoid
Even mature teams often weaken their reporting impact through avoidable mistakes.
Reporting too many disconnected metrics without context
A long list of numbers is not a framework. If metrics are not tied to goals, trends, or decisions, the report becomes noise.
Instead, group metrics by purpose:
- visibility
- audience response
- business or reputation impact
Then explain how they relate.
Overemphasizing vanity metrics
Large potential reach or mention volume may look impressive but often does not answer executive questions.
Vanity metrics become more useful only when paired with:
- outlet quality
- message pull-through
- referral traffic
- conversion contribution
- competitive comparison
Failing to explain limitations and attribution gaps
Transparent reporting builds trust. If sentiment classification has limitations, say so. If conversions are influenced by multiple channels, say so. If an external event distorted coverage volume, include that context.
Credibility matters more than artificial precision.
Sending reports that lack recommendations
A report should not stop at observation. It should guide action.
Every executive-ready report should include recommendations such as:
- double down on a high-performing narrative
- improve campaign tracking links
- address a rising reputation risk
- increase spokesperson support in a specific region
- shift resources toward high-quality outlets with stronger traffic performance
A Simple PR Analytics Reporting Framework You Can Reuse
The best framework is one your team can repeat consistently and refine over time. A practical structure for weekly, monthly, and campaign-end reports is below.
1. Objectives
Start with the purpose of the reporting period.
Examples:
- Increase visibility in target trade media
- Support product launch awareness
- Improve executive visibility
- Monitor reputation during a high-risk period
- Drive traffic to a strategic content asset
This keeps the report anchored in business context.
2. Key metrics
Organize the report into a compact KPI scorecard.
A useful structure is:
- Coverage and visibility: placements, share of voice, publication quality, message pull-through
- Audience response: referral traffic, engagement quality, branded search lift
- Business and reputation: leads, conversions, sentiment trend, executive visibility, trust indicators
Each KPI should include:
- current period result
- comparison with prior period or target
- concise interpretation
- next action if needed
3. Insights
Summarize the most important findings.
Good insight statements are short and specific:
- “Share of voice rose due to stronger trade coverage, but top-tier national visibility remained flat.”
- “One analyst mention drove high-quality referral traffic and above-average content engagement.”
- “Negative sentiment rose because of a pricing narrative that requires executive messaging alignment.”
4. Executive summary
This is the leadership view. Keep it concise and decision-oriented.
A strong executive summary should cover:
- what happened
- why it mattered
- the biggest risk or opportunity
- what action is recommended
This section is a strong candidate for Dora’s Report Researcher or Daily Briefing Secretary workflow, because it often requires recurring structured summarization from trusted FineReport assets.
5. Recommended actions
Every report should close with action, not only observation.
Examples:
- Prioritize outreach to two high-value publications that convert better than broader coverage
- Refine message architecture where pull-through is weak
- Add UTM discipline to improve campaign attribution
- Trigger a Risk Alert Officer workflow for negative sentiment thresholds
- Prepare an executive thought leadership push based on topics with the highest audience response
6. Refine the framework over time
Your framework should evolve as stakeholder needs change.
Review the framework regularly by asking:
- Which metrics are leaders actually using?
- Which metrics create confusion or low value?
- Are KPI definitions still aligned across teams?
- Which recurring summaries could Dora automate?
- Do report templates still support current campaign priorities?
The most mature PR reporting teams treat reporting as an operating system, not a monthly task.
Actionable Best Practices
To make pr analytics reporting work in a real enterprise environment, follow a few practical implementation rules.
1. Standardize KPI definitions and report templates
Define terms such as share of voice, publication tier, sentiment category, executive visibility, and PR-sourced traffic in one governed model. This gives FineReport a stable reporting foundation and gives Dora trusted business context for AI summaries.
2. Start with high-value recurring reports first
Do not try to automate every PR report at once. Start with executive monthly summaries, campaign-end reports, or reputation monitoring briefings. These scenarios