You face a clear choice when selecting business intelligence tools. Power BI works best for organizations that rely on Microsoft ecosystems, while Tableau stands out for advanced visualization and data exploration. If you need self-service, integration, and real time data analysis, FineBI offers a modern approach. Consider the latest market share statistics in the power bi vs tableau comparison: Power BI leads with 30.2%, Tableau holds 16.99%. The right platform helps you connect data, build an entire dashboard, and generate insights that drive decisions.
Power BI vs Tableau Quick Comparison
Feature Comparison Table
You want a clear view of how Power BI, Tableau, and FineBI stack up. The following feature comparison table highlights the most important aspects for your decision-making process. You can see how each platform approaches integration, visualization, pricing, scalability, and AI capabilities.
Feature
Power BI
Tableau
FineBI
Integration
Seamless with Microsoft 365, Azure, and hundreds of connectors.
Connects to diverse sources, strong API support.
60+ connectors, integrates with big data, APIs, and FineDataLink for real time data.
Visualization
Hundreds of native chart types, custom visuals from AppSource.
Tip: FineBI stands out for self-service analytics and integration with complex data environments. You can leverage FineDataLink for unified data management and real time data synchronization.
Key Differences Overview
You need to understand the key differences between Power BI, Tableau, and FineBI before making your choice. The power bi vs tableau comparison reveals distinct strengths for each platform.
Power BI overview: You benefit from tight integration with Microsoft tools. The platform offers rapid deployment, especially if your organization already uses Microsoft 365 or Azure. You get AI-driven features like natural language querying and automated insights. The pricing model is straightforward, making it accessible for small businesses and scalable for enterprises.
Tableau overview: You gain advanced visualization and dashboard storytelling. Tableau excels in custom visualizations and interactive design. You can connect to a wide range of data sources, but deployment may take longer due to customization needs. The platform’s passionate community provides rich documentation and support.
FineBI: You experience true self-service analytics. FineBI empowers you to connect to diverse data sources, including big data platforms and APIs. You can build an entire dashboard with drag-and-drop simplicity. The platform supports real time data analysis and predictive modeling. FineBI’s high-performance engine handles large user bases and massive data sets. You also get enterprise-grade governance with role-based access and audit logs.
When you compare features, Power BI offers better AI capabilities for open-ended questions and mixed insights. Tableau provides superior mobile dashboarding and advanced visualization options. FineBI delivers a unified experience for self-service, integration, and real time data analysis.
Note: If your priority is exploration and advanced dashboard storytelling, Tableau is a strong choice. If you want seamless integration with Microsoft and rapid deployment, Power BI is ideal. For organizations seeking self-service, integration, and scalable governance, FineBI is the modern alternative.
You should focus on your business needs and the type of data analysis you want to perform. The feature comparison helps you quickly identify which platform aligns with your requirements for integration, visualization, scalability, and AI-powered insights.
Ease of Use Comparison
User Interface
You want a user-friendly interface that makes data analysis simple. Power BI gives you a clean layout with familiar Microsoft design. You can find tools and menus quickly. Tableau offers a visually rich workspace. You drag and drop data fields to build your entire dashboard. FineBI focuses on self-service and user-friendly design. You get clear guidance for each step, from connecting data to creating visualizations. The interface in FineBI supports exploration and helps you uncover insights without technical barriers.
Tip: If you value a user-friendly experience and need to build dashboards fast, FineBI and Power BI stand out. Tableau provides more advanced controls for users who want deep customization.
Learning Curve
You need to start analyzing data without spending weeks in training. Power BI works well if you already use Microsoft products. You learn the basics quickly and move to advanced features as you gain confidence. Tableau requires more time to master. You explore many visualization options and advanced analytics tools. FineBI makes onboarding easy for new users. You follow step-by-step workflows and use drag-and-drop features. The platform supports both beginners and experienced analysts. You can perform data analysis and build dashboards with minimal effort.
Onboarding Experience
You want to get started with data analysis right away. Power BI integrates with Microsoft accounts, so you sign in and begin importing data. Tableau provides tutorials and sample projects to help you learn. You experiment with data and create your first dashboard. FineBI offers guided onboarding. You connect to data sources, process data, and publish dashboards with clear instructions. The platform supports self-service and helps you collaborate with your team. You share insights and explore data together.
Note: FineBI’s onboarding process is user-friendly and supports large teams. You can scale your data analysis and dashboard creation as your needs grow.
Visualization Capabilities: Tableau, Power BI, and FineBI
Chart Types and Customization
You want a data visualization tool that offers a wide range of visualizations and customization options. Power BI, Tableau, and FineBI each deliver strong data visualization capabilities. With Power BI, you can use gauge charts to track progress, key influencers charts to identify major contributors, and KPIs for quick performance checks. You also get line charts, maps, R script visuals, ribbon charts, scatter charts, slicers for filtering, and smart narrative visuals that highlight trends. Tableau provides advanced chart types and lets you customize every detail, making it ideal for deep data exploration. FineBI supports over 40 chart types, including narrative reports and custom visuals through Vega/Vega-Lite, giving you flexibility for self-service data analysis.
Tip: FineBI’s drag-and-drop interface makes it easy to build and customize dashboards, even if you have limited experience with data visualization tools.
Interactivity and Storytelling
You need interactive dashboards that help you tell a story with your data. Tableau excels at transforming complex data into a narrative format. You can use story points, dashboards, and visuals to guide your audience through key insights. Annotations and captions add context, while interactivity lets users explore data further. Power BI offers engaging reports with a drag-and-drop canvas, AI-powered visuals, and instant report generation. You can use natural language Q&A to get visual answers quickly. FineBI supports interactive dashboards, allowing you to filter, drill down, and link components for deeper data exploration. These data visualization features help you create reports that are accessible and engaging for everyone.
Drag-and-drop canvas and interactive visualizations
AI-powered visuals
Uncover hidden patterns and anomalies
Instant reports
Generate stunning visuals quickly
Natural language Q&A
Get answers to complex questions instantly
Built-in accessibility
Keyboard navigation and screen-reader compatibility
Real-Time Dashboards
You want real-time dashboards that keep your data up to date. FineBI supports real-time analysis, multidimensional analysis, and connects to a wide range of data sources. Tableau offers dynamic interaction diagrams and built-in analysis charts for quick data exploration. Power BI connects seamlessly to Excel, letting you build personalized data dashboards that update automatically. These data visualization tools ensure you always have the latest insights for decision-making.
Tool
Capabilities
FineBI
Real-time analysis, multidimensional analysis, rich data source connections
Seamless Excel connection, personalized data dashboards
real-time dashboard created by FineBI
Note: When you choose a data visualization tool, focus on the visualization capabilities, interactivity, and real-time features that match your business needs.
Pricing and Value
Cost Structure
You want to maximize your investment in a data visualization tool. Power BI gives you a flexible pricing model. You pay about $10 per user each month for Pro, which works well for small teams. Premium options scale for larger organizations. Tableau costs more, with Creator licenses starting near $70 per user each month. You may face extra charges as your team grows. FineBI offers a cost-effective solution for large deployments. You get flexible pricing that adapts to your business needs. This approach helps you control costs as your data analysis requirements expand.
Tip: If you manage a small business or a startup, Power BI provides a lower total cost of ownership. You can start with a few users and scale up as your data grows. Tableau suits organizations that prioritize advanced visualizations and interactive dashboards, but you should budget for higher licensing fees.
Value for Business Sizes
You need a platform that delivers value for your business size. Power BI benefits small, medium, and large organizations with its cost-effectiveness and seamless integration with Microsoft tools. You get enhanced AI insights, predictive analytics, and real-time data processing. Tableau offers strong data visualization features and supports deep exploration, but you may need extra customization for integration and AI capabilities. FineBI stands out for self-service analytics, supporting over 10,000 users and handling massive data sets. You can connect to diverse data sources and build interactive dashboards with ease.
Robust data modeling capabilities for effective processing and visualization.
Requires extracted datasets for performance optimization, complicating modeling.
Security and Compliance
Enterprise-grade security features integrated with Microsoft Azure.
Offers security features but lacks deep integration with a security framework.
Real-Time Data Analytics
Real-time processing capabilities for instant monitoring and insights.
Needs additional setup for similar functionalities.
FineBI delivers scalable value for organizations of any size. You can empower business users with self-service data analysis and interactive dashboards. The platform supports real-time insights, advanced visualizations, and seamless exploration. You gain enterprise-grade governance and flexible deployment options, making FineBI a strong choice for growing businesses.
Integration and Data Connectivity
Data Sources Comparison
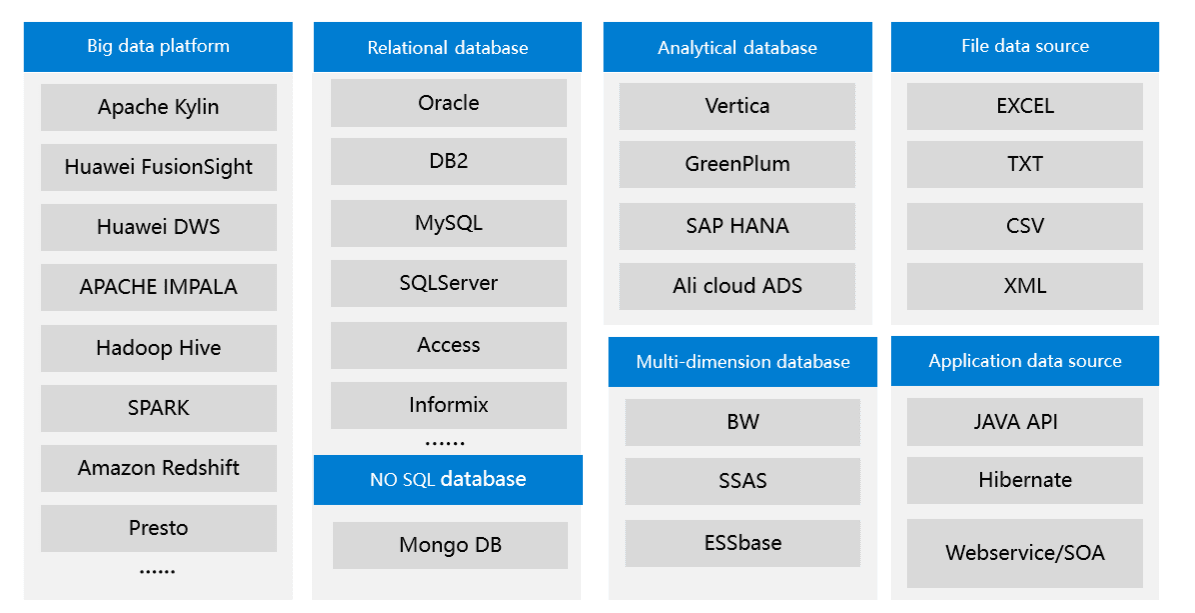
You need a platform that connects to all your important data. Power BI, Tableau, and FineBI each offer different strengths when it comes to integration. Power BI provides deep integration with Microsoft products. You can connect to SQL-based and No-SQL data sources using ODBC connectors. Tableau gives you native connectors and ODBC drivers for a wide range of sources. FineBI stands out by supporting over 100 data sources, including big data platforms, cloud warehouses, and APIs. This flexibility ensures you can bring together information from every part of your business for better data analysis.
FineBI supports over 100 data sources
Tool
Integration with Microsoft Products
Third-Party Data Connectors
SQL-based Data Sources
No-SQL Data Sources
Power BI
Deep integration with Microsoft
ODBC connectors
Yes
Yes (via ODBC)
Tableau
Native connectors available
ODBC drivers
Yes
Yes (via ODBC)
FineBI
N/A
N/A
N/A
N/A
Tip: If you work with many different systems, FineBI’s broad compatibility makes it easy to unify your data for visualizations and insights.
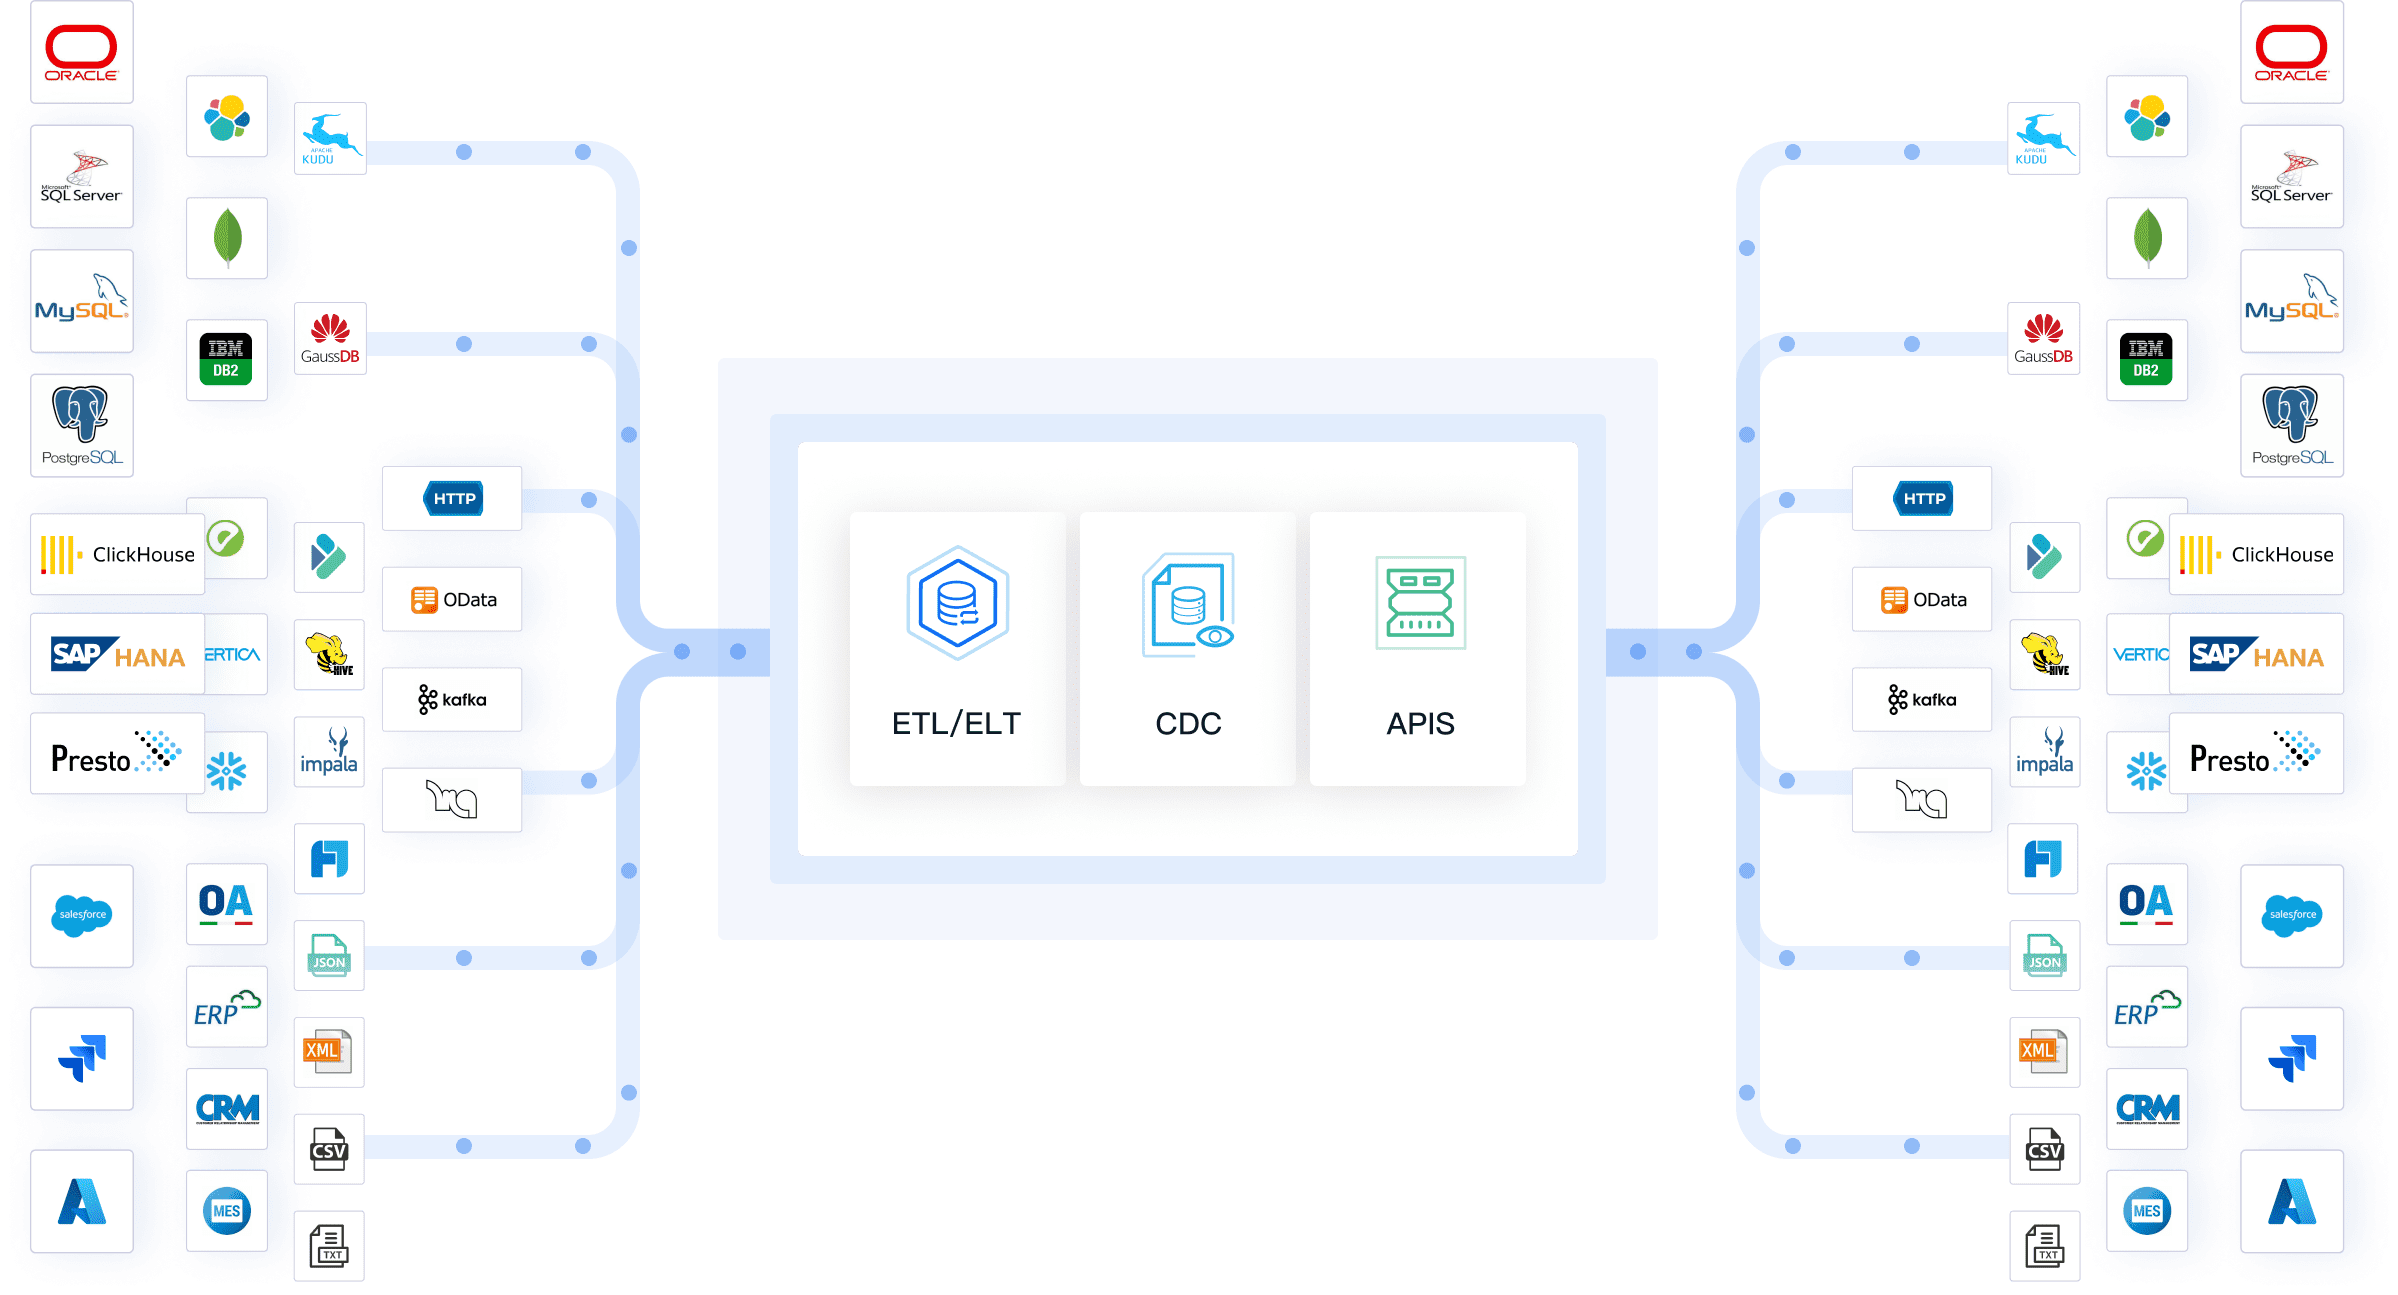
Integration with Microsoft, APIs, and FineDataLink
You want seamless workflows and real-time data movement. Power BI excels if you use Microsoft 365 or Azure. You can automate data refreshes and build interactive dashboards with minimal effort. Tableau supports a wide range of APIs and third-party connectors, which helps you pull in data from many sources. FineBI takes integration further with FineDataLink. This feature lets you synchronize, transform, and manage data across multiple platforms in real time. You can connect to APIs, schedule updates, and even build custom connectors for unique business needs.
Note: FineDataLink enables you to streamline complex data pipelines and maintain high-quality data for your visualizations.
FineBI Integration Strengths
You gain unique advantages with FineBI. The platform supports integration with over 100 sources, which goes beyond what Power BI and Tableau offer. FineBI provides open API access, so you can connect to any system and automate data flows. You also get data writeback capabilities, allowing you to update source systems directly from your dashboards. These features make FineBI a powerful choice for organizations that need flexible, scalable, and self-service data integration.
When you need to support advanced data visualization, exploration, and interactive dashboards, FineBI’s integration strengths help you deliver actionable insights across your organization.
Scalability and Performance
Handling Large Data Sets
You need a platform that manages large volumes of data without slowing down your workflow. Power BI uses in-memory technology to process millions of rows quickly. You can import data from multiple sources and create visualizations that update in real time. Tableau also handles big data efficiently. You optimize backgrounder extract refresh and subscription jobs to manage workloads. This approach ensures your data visualization tool remains responsive, even with complex queries.
FineBI stands out for real-time data processing and in-memory computing. You can process and update data instantly, which is essential for organizations that rely on timely insights. The platform’s integrated ETL tools help you prepare data for analysis, so you spend less time waiting and more time on exploration. FineBI’s high-performance engine supports interactive dashboards for thousands of users, making it ideal for enterprise-level data analysis.
Tip: If you want to empower your team with fast, scalable visualizations, choose a platform that combines in-memory computing with elastic cloud deployment.
Enterprise Deployment
You want a solution that grows with your business. Power BI scales easily within Microsoft-centric enterprises. You deploy on the cloud or on-premises, depending on your security needs. Tableau offers flexibility for enterprise deployment. You configure the platform to meet specific requirements and integrate with your existing architecture. Resource management features let you optimize extract refreshes and manage subscriptions efficiently.
FineBI provides elastic cloud deployment, so you start small and expand as your needs grow. You access insights anytime, anywhere, with strong mobile support. The platform’s robust data modeling features and self-service analytics ensure you maintain control as your organization scales. FineBI’s architecture supports real-time data processing, which keeps your visualizations up to date and your teams aligned.
You gain the most value when your data visualization platform supports both large-scale data analysis and flexible enterprise deployment. Power BI, Tableau, and FineBI each deliver features that help you scale your data strategy and drive better business outcomes.
AI and Advanced Analytics
Built-in AI Features
You want advanced AI features that make your data analysis smarter and faster. Power BI leads with deep integration into Azure Machine Learning. You can create, train, and deploy machine learning models directly inside Power BI. The platform also supports text analytics for sentiment analysis, language detection, and key phrase extraction. Vision features let you analyze images and videos for deeper insights. Automated machine learning (AutoML) helps you build predictive models without needing expert knowledge. Power BI also uses Azure OpenAI for natural language processing, so you can generate automated insights with ease. Dataflows automate extraction, transformation, and loading, using built-in machine learning algorithms.
Tableau gives you AI-augmented visuals and strong predictive analytics. You can use Explain Data to uncover reasons behind outliers or trends. Tableau’s Ask Data feature lets you type questions in plain language and get instant visualizations. The platform supports integration with Python and R for custom machine learning models. You can enhance your data visualization tool with AI-powered recommendations and automated explanations.
FineBI brings AI-driven interactive dashboards to your organization. You use conversational analytics to ask questions and get answers in real time. The platform supports predictive modeling and automated data interpretation. You can explore data with self-service tools and uncover hidden trends. FineBI’s AI features help you build visualizations that drive better decisions.
Tip: You can use these features to automate routine tasks, generate new insights, and make your visualizations more powerful.
Predictive Analytics
You need predictive analytics to stay ahead in your industry. Power BI uses historical data and machine learning to forecast trends and risks. You can visualize future sales, inventory needs, or customer behavior with just a few clicks. Tableau lets you add trend lines, forecasts, and clustering to your visualizations. You can use R or Python scripts for advanced modeling. FineBI empowers you to build predictive models and simulate scenarios without coding. You can use interactive dashboards to test different strategies and see the impact instantly.
With these platforms, you turn raw data into actionable insights. You make smarter decisions and respond quickly to changes in your business environment. Each tool supports exploration, self-service, and advanced analytics, so you can choose the best fit for your needs.
Deployment and Accessibility
Cloud and On-Premises Options
You want flexibility when deploying a data visualization tool. Power BI, Tableau, and FineBI each offer different deployment models. You can choose cloud or on-premises options based on your organization’s needs. Power BI supports both cloud and on-premises deployment, which lets you scale your data analysis and visualizations as your business grows. FineBI also provides cloud and on-premises choices, giving you control over your data and infrastructure. Tableau’s deployment options are more limited, so you may face restrictions if you need hybrid solutions.
Tip: You can select the deployment model that matches your security requirements and business goals. FineBI and Power BI give you the freedom to manage your data and visualizations in the environment you prefer.
Mobile and Web Access
You need to access interactive dashboards and insights from anywhere. Power BI, Tableau, and FineBI each support mobile and web access, but their features differ. Power BI’s mobile app requires you to authenticate with a Microsoft account. If you use a Gmail account, you cannot log in to the mobile app. Guest users can view reports in a web browser, but login issues may occur on mobile devices due to domain restrictions. Tableau provides mobile access for data visualization and exploration, letting you interact with visualizations on the go. FineBI delivers responsive dashboards across devices, so you can perform self-service data analysis and share insights with your team from any location.
Power BI mobile app requires Microsoft account authentication.
Gmail accounts cannot log in to Power BI mobile app.
Guest users can view Power BI reports in a web browser but may face login issues on mobile.
Tableau supports mobile access for data visualization and exploration.
FineBI offers responsive dashboards and seamless mobile access for self-service and interactive dashboards.
Note: You can rely on FineBI and Tableau for smooth mobile access and exploration. Power BI works best if your organization uses Microsoft accounts for authentication.
Collaboration and Sharing: Power BI, Tableau, and FineBI
Team Collaboration
You need strong collaboration tools to drive effective data analysis and decision-making. Power BI, Tableau, and FineBI each offer unique features for team-based projects. Power BI stands out with real-time collaboration. You can discuss and manipulate data together during analysis. Workspaces in Power BI let your team co-create and manage content in a shared environment. Integration with Microsoft Teams means you can access data and visualizations directly in your communication channels. You add comments on reports, which helps your team focus discussions and clarify insights. Power BI also supports custom visuals, so your team can tailor visualizations to specific needs. Role-based security ensures only the right people access sensitive data.
FineBI takes a different approach. You collaborate by editing analysis subjects together. This feature supports teamwork and self-service exploration. Multiple users can work on the same data visualization tool, making it easy to refine dashboards and share findings. FineBI’s design encourages you to build interactive dashboards as a group, supporting both business users and analysts.
Tableau provides a collaborative workspace for your team. You share data sources, dashboards, and visualizations. You can annotate and comment on visualizations, which helps your team understand the story behind the data. Tableau’s environment supports exploration and sharing, making it a strong choice for organizations that value teamwork in data projects.
Feature
Power BI
FineBI
Tableau
Real-Time Collaboration
Yes, allows real-time discussions and data manipulation during analysis.
N/A
N/A
Workspaces
Yes, shared environments for co-creation and management of content.
N/A
N/A
Integration with Communication
Yes, integrates with Microsoft Teams for seamless data access.
N/A
N/A
Commenting and Discussion
Yes, allows comments directly on reports for focused discussions.
N/A
N/A
Custom Visuals
Yes, enables creation of tailored visuals for team needs.
N/A
N/A
Security and Governance
Yes, offers role-based security for data protection.
N/A
N/A
Collaboration on Analysis Subjects
N/A
Yes
N/A
Tip: Choose a platform that matches your team’s workflow and communication style. Power BI works well for Microsoft-centric teams. FineBI supports collaborative self-service. Tableau excels in visual storytelling and annotation.
Sharing Reports
You want easy and secure sharing of reports and dashboards. Power BI gives you several options for sharing. You can grant everyone access by creating an 'All Users' group in Azure Active Directory. You publish reports to the web, making them accessible to anyone without authentication. You also share apps with your entire organization, so all users can view included dashboards and reports. Power BI lets you share from My Workspace or other workspaces, assign roles, and package dashboards into apps for distribution.
Tableau supports sharing through Tableau Server or Tableau Online. You publish dashboards and visualizations for your team or organization. You control permissions to ensure only the right people see sensitive data. Tableau’s sharing features help you distribute insights quickly and securely.
FineBI makes sharing simple. You publish interactive dashboards and reports for your team or the whole company. You set permissions to control who can view or edit content. FineBI’s sharing features support real-time updates, so everyone sees the latest data. You can collaborate on dashboards and share insights across departments, supporting a culture of data-driven decision-making.
Note: Sharing is essential for maximizing the value of your data visualization tool. Power BI, Tableau, and FineBI each provide flexible options for sharing visualizations, dashboards, and insights with your team.
Pros and Cons Summary
Power BI Strengths and Weaknesses
You gain several advantages when you choose Power BI as your data visualization tool. The platform offers a user-friendly interface, making it easy for you to start building visualizations and exploring data. You benefit from strong data source support and real-time data access, which helps you uncover insights quickly. Power BI stands out for affordability and advanced analytics capabilities, supporting your data analysis and reporting needs.
However, you may face challenges with complex data modeling. Mastering DAX and SQL is often necessary, which can slow down your workflow if you are new to these languages. The free version of Power BI has limited features, so you need a paid subscription for advanced tools. The combination of features can feel overwhelming for beginners. You might also encounter dataset size constraints and limited compatibility with non-Windows platforms. The licensing structure can be confusing, especially as your organization grows.
User-friendly interface
Strong data analytics capabilities
Extensive data source support
Real-time data access
Strong security features
Affordability
Advanced analytics capabilities
You may experience complexity, a steep learning curve, and dataset size limitations.
Tableau Strengths and Weaknesses
Tableau delivers powerful data visualization and exploration features. You benefit from robust community support and a user-friendly interface that makes it easy to create interactive dashboards. Advanced data visualization options allow you to tell compelling stories with your data. Tableau helps you uncover trends and patterns through deep exploration.
Strengths
Weaknesses
Robust community support
High costs
Advanced data visualization
Steep learning curve for advanced features
User-friendly interface
Limitations in mobile functionality
Limitations in scheduling capabilities
You may find the costs high, especially for larger organizations. Advanced features require IT knowledge, which can make the learning curve steep. Tableau has limitations in mobile functionality and scheduling capabilities, which may affect your workflow if you need flexibility.
FineBI Strengths
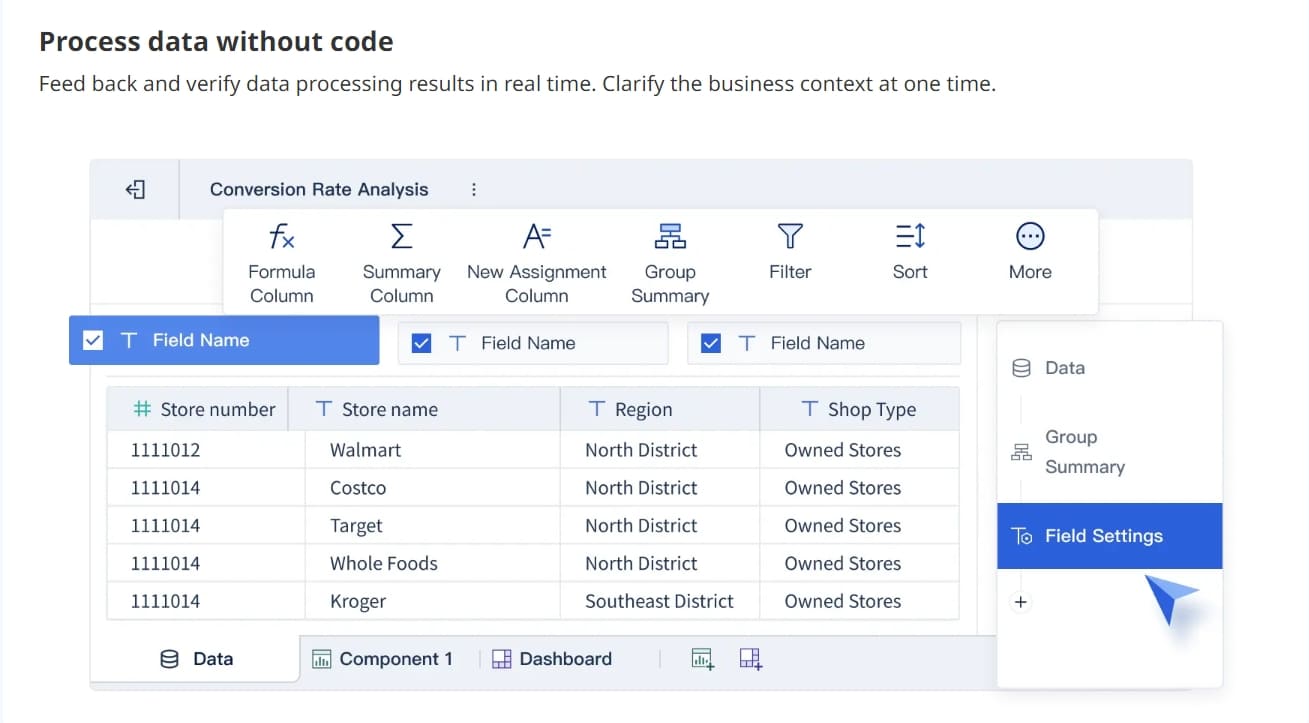
FineBI empowers you with self-service capabilities and interactive dashboards. You can perform dynamic data analysis and create reports with a user-friendly drag-and-drop interface. FineBI supports a wide range of visualization types, helping you interpret data from multiple sources. The platform enables real-time data analysis, so you always have up-to-date insights.
You gain flexibility in data analysis, the ability to visualize large datasets, and tools to identify trends, opportunities, and risks. FineBI makes it easy for you to explore data and share insights across your organization.
Use Case Recommendations and FanRuan Stories
Best for Small Businesses
You want a data visualization tool that balances cost, ease of use, and essential features. Power BI gives you a low entry price and a familiar interface if you already use Microsoft products. You can quickly set up visualizations and share reports with your team. Tableau offers advanced visualizations, but the higher cost may not fit every small business budget. Many small teams choose platforms like Zoho Analytics or Cyfe for their affordability and simplicity. Zoho Analytics provides an AI assistant and easy team collaboration. Cyfe lets you deploy quickly and monitor performance in real time. FineBI stands out if you need self-service analytics and interactive dashboards without a steep learning curve. You can empower your team to explore data and gain insights right away.
Platform
Cost
Ease of Use
Key Features
Power BI
Affordable
User-friendly
Microsoft integration, quick visualizations
Tableau
Higher
Advanced
Deep exploration, custom visualizations
FineBI
Flexible
Simple
Self-service, interactive dashboards, real time
Best for Enterprises
You need a platform that scales with your organization and integrates with complex systems. Power BI works well for enterprises that rely on Microsoft 365 or Azure. You can manage large data sets and deploy across departments. Tableau supports efficient handling of big data and connects to many sources. Platforms like ThoughtSpot, Domo, and Qlik Cloud Analytics also offer strong scalability and integration. FineBI delivers high-performance visualizations and supports over 10,000 users. You can unify data from multiple sources and maintain enterprise-level governance. FineBI’s integration with FineDataLink ensures real-time data management and seamless exploration across your business.
Platform
Scalability
Integration
Power BI
Enterprise-ready
Microsoft stack, 120+ connectors
Tableau
Large data sets
Wide data source integration
FineBI
10,000+ users
100+ sources, FineDataLink, APIs
Best for Data Analysts
You want advanced tools for deep data analysis and exploration. Tableau gives you powerful visualizations and flexible dashboards. You can use clustering, forecasting, and custom calculations. Power BI offers robust analytics with DAX and integration with Azure Machine Learning. FineBI provides a self-service environment where you can connect to big data platforms, process data visually, and build predictive models. You can use drag-and-drop features to create interactive dashboards and uncover trends without coding. FineBI’s AI-driven tools help you interpret data and share insights with your team.
Best for Business Users
You need a platform that makes data analysis accessible to everyone. Power BI’s familiar interface helps you start quickly if you use Microsoft tools. Tableau supports intuitive drag-and-drop dashboard creation. FineBI excels in self-service analytics. You can connect to data, build visualizations, and share interactive dashboards without technical skills. FineBI’s guided workflows and responsive design let you access insights on any device. You can collaborate with colleagues and make decisions based on real-time data.
You see the impact of FineBI in real-world scenarios. UnionPay Data Services used FineBI to unify fragmented data and improve operational efficiency by 5%. The company increased customer value identification accuracy to 90%. FineBI enabled precise marketing and customer segmentation, driving higher engagement and revenue. In manufacturing, FineBI supports lean production by integrating real-time data from multiple systems. You can monitor quality, costs, and equipment status with interactive dashboards. In finance, FineBI streamlines reporting and analysis, making complex data accessible for managers and executives. These stories show how FineBI empowers organizations to turn data into actionable insights and drive business growth.
Note: You can choose the right platform by matching your business needs with the strengths of Power BI, Tableau, or FineBI. For self-service, integration, and scalable governance, FineBI delivers a modern solution for any industry.
You now have a clear view of the power bi vs tableau debate. Power BI suits organizations that prioritize Microsoft integration and rapid deployment. Tableau excels in advanced visualization and interactive dashboards. Both platforms handle data analysis and sharing well. FineBI stands out if you need self-service analytics, seamless integration, and enterprise governance for your data. You should evaluate your business needs, data complexity, and team skills before making a final choice. Consider FineBI for scalable, real-time data solutions.
Access a wealth of case studies, industry insights, and solution guides to accelerate digital transformation.
FAQ
What is the main difference between Power BI, Tableau, and FineBI?
You get seamless Microsoft integration with Power BI. Tableau gives you advanced visualization and storytelling. FineBI empowers you with self-service analytics, real-time data, and broad integration for any business size.
Can you use FineBI without technical skills?
You can. FineBI offers a drag-and-drop interface and guided workflows. You build dashboards, connect data, and analyze results without coding. The platform supports both beginners and advanced users.
Which platform handles real-time data best?
You get real-time insights on all three. FineBI stands out with FineDataLink for seamless, real-time integration.