Paginated reports let you create print-ready documents with exact layouts and precise formatting. You control every detail, so your data looks clear on every page. This accuracy matters in business intelligence. When you use solutions like FanRuan and FineReport, you can design reports that help teams share information quickly.

You use paginated reports to create documents with a fixed layout. These reports let you control every detail, from headers and footers to page numbers. In business intelligence, paginated reports help you organize large amounts of data into clear, structured formats. You can generate invoices, financial statements, and compliance documents that look professional every time.
FanRuan and FineReport stand out as top solutions for paginated reports. They give you tools to design reports that meet strict business standards. You can rely on these platforms to deliver accurate, print-ready documents for your team.
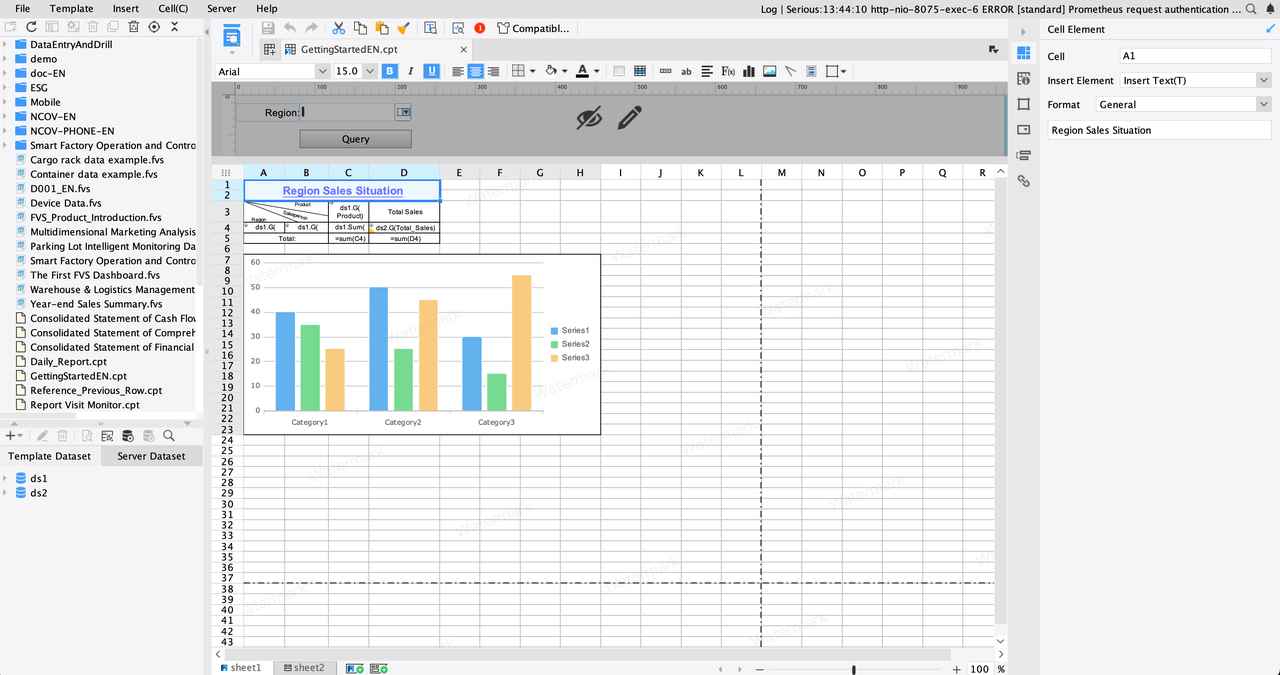
Paginated reports play a key role in today's data-driven world. They help you turn complex data into actionable insights. This approach changes how you analyze and share information across your organization.
Here is a table showing the core purposes of paginated reports in business intelligence:
| Core Purpose | Description |
|---|---|
| Detailed Formatting | You control layout, headers, footers, and pagination for every page. |
| Structured Document Generation | You create fixed documents like invoices and statements with ease. |
| Pixel-Perfect Reports | Your reports keep their format across pages, ready for print or digital sharing. |
Paginated reports offer several features that make them valuable for business intelligence. You can customize every part of your report, making sure it looks professional and meets your needs. You can export reports in formats like PDF and Excel, which makes sharing easy. These reports handle large datasets, so you can include all the details your business requires.
Here are some key features you will find in paginated reports:
FineReport gives you all these features and more. You can design reports with drag-and-drop tools, connect to many data sources, and automate report delivery. This flexibility helps you meet the demands of modern business reporting.
Print-ready formatting sets paginated reports apart from other reporting formats. You get a fixed layout that looks the same on every page, whether you print or view it digitally. This consistency is important for formal documents and presentations.
Compare paginated reports to other formats:
| Characteristic | Paginated Reports | Interactive Reports | Ad Hoc Reports |
|---|---|---|---|
| Layout | Fixed layout for printing | Dynamic layout for user interaction | No predefined layout |
| Purpose | Consistent format for distribution | Real-time analysis and exploration | Answers specific questions |
| Data Handling | Handles large datasets, multi-page | Flexible for exploration | Real-time, smaller datasets |
You benefit from organized information and improved readability. Paginated reports structure content into manageable sections, making it easier for you to follow. Marked sections and page numbers help you find what you need quickly. You can focus on one page at a time, which improves understanding and retention.
FanRuan and FineReport ensure your reports meet high standards for print and digital use. You get reliable formatting, accurate data presentation, and efficient review processes. These advantages make paginated reports a smart choice for any business that values clarity and professionalism.
When you design paginated reports, you work with a set of technical components that shape how your data appears. Each report uses a structured layout, which helps you organize information clearly across multiple pages. You can place tables, charts, and images exactly where you want them. This control ensures your reports look professional and easy to read.
Here is a table that breaks down the main components you use in paginated reports:
| Component Type | Description |
|---|---|
| Report Items | Layout elements linked to your data, such as tables, charts, and images. |
| Page Layout | Lets you position report items on the design surface for complex and organized designs. |
| Report Sections | Includes page headers, footers, and the report body, with options for visibility and interactivity. |
| Renderers | Different types of renderers for exporting reports, such as data, soft page-break, and hard page-break renderers. |
You can use these components to create reports that fit your business needs. FineReport gives you a drag-and-drop interface, so you can build layouts without writing code. You can add headers and footers to every page, making your reports easy to navigate. You can also use sections to highlight important information or add interactivity.
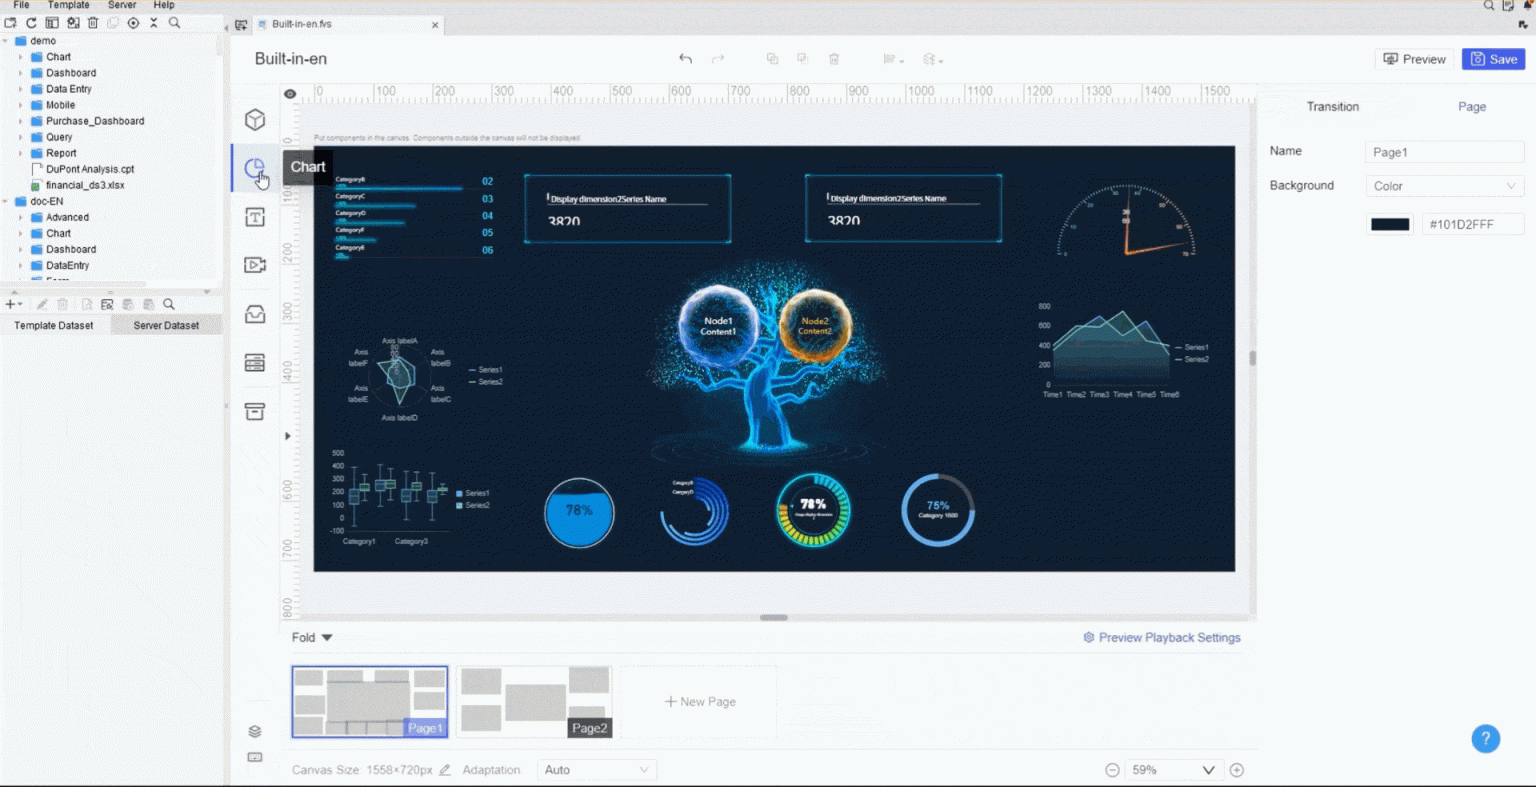
Tip: A well-structured layout helps your audience find key information quickly. Consistent headers and footers on each page improve navigation and make your reports look polished.
Paginated reports excel at managing large and complex datasets. You can process and display millions of rows without losing performance or clarity. This makes them ideal for enterprise reporting, where you often need to present detailed information across many pages.
You get several advantages when you use paginated reports for data handling:
FineReport stands out in this area. You can manage data across multiple sheets, which helps you organize information for different departments or projects. You can save and submit data from several sheets at once. This feature is especially useful when you work with large datasets and need to keep everything organized. You can also modify data in separate sheets and submit them together, which streamlines your workflow.
Here is a comparison of how paginated reports handle data versus other reporting formats:
| Feature | Paginated Reports | Other Reporting Formats |
|---|---|---|
| Data Handling | Can process and display millions of rows | May focus on real-time data exploration |
| Layout Control | Provides precise formatting and layout control | Often less control over layout |
| Print-Ready | Designed for generating detailed, print-ready documents | Typically not optimized for printing |
| Navigation | Data can be displayed across multiple pages | May not support multi-page navigation |
You can see that paginated reports give you more control and flexibility, especially when you need to handle large amounts of data.
One of the main strengths of paginated reports is their ability to organize content across many pages. You can break up large datasets into manageable sections, making your reports easier to read and understand. Each page can have its own header, footer, and page number, which helps your audience follow along.
To get the best results with multi-page output, you should follow some best practices:
FineReport makes it easy to manage multi-page output. You can design reports that automatically split data across pages, so you never have to worry about missing information. You can also export your reports in multiple formats, ensuring they look great whether you print them or share them digitally.
Note: When you follow these best practices, you create reports that are easy to read, fast to load, and reliable for both print and digital use. Your audience will appreciate the clarity and organization on every page.
Paginated reports give you the tools to present complex data in a clear, organized way. You can handle large datasets, control every detail of your layout, and deliver professional reports across many pages. With solutions like FineReport, you can meet the demands of enterprise reporting and make sure your information reaches the right people in the right format.
When you create paginated reports, you gain complete control over every detail of your document. You decide the exact placement of tables, charts, and images. You set page sizes, margins, and orientation. This level of control helps you produce print-ready documents that look professional every time.
Paginated reports stand out because they let you design fixed layouts. You can make sure each page looks the same, whether you print or share it digitally. This is different from interactive reports, which change based on user actions and do not always look good when printed.
| Criteria | Paginated Reports (e.g., FineReport, SQL Server Reporting Services) | Interactive Reports (e.g., Power BI Reports) |
|---|---|---|
| Purpose | Create print-ready documents with precise formatting | Explore data in real time |
| Format & Layout | Fixed layout, full control over pagination and appearance | Dynamic layout, adjusts with user actions |
| Print Optimization | Designed for consistent print output | Not optimized for printing |
| Formatting Control | Control every aspect, including page size and margins | Less control, focus on data presentation |
You benefit from this precision when you need to meet strict business standards. You can design invoices, statements, and compliance documents that always look the way you want.
Tip: Use pixel-perfect control to ensure your reports match your company’s branding and regulatory requirements.
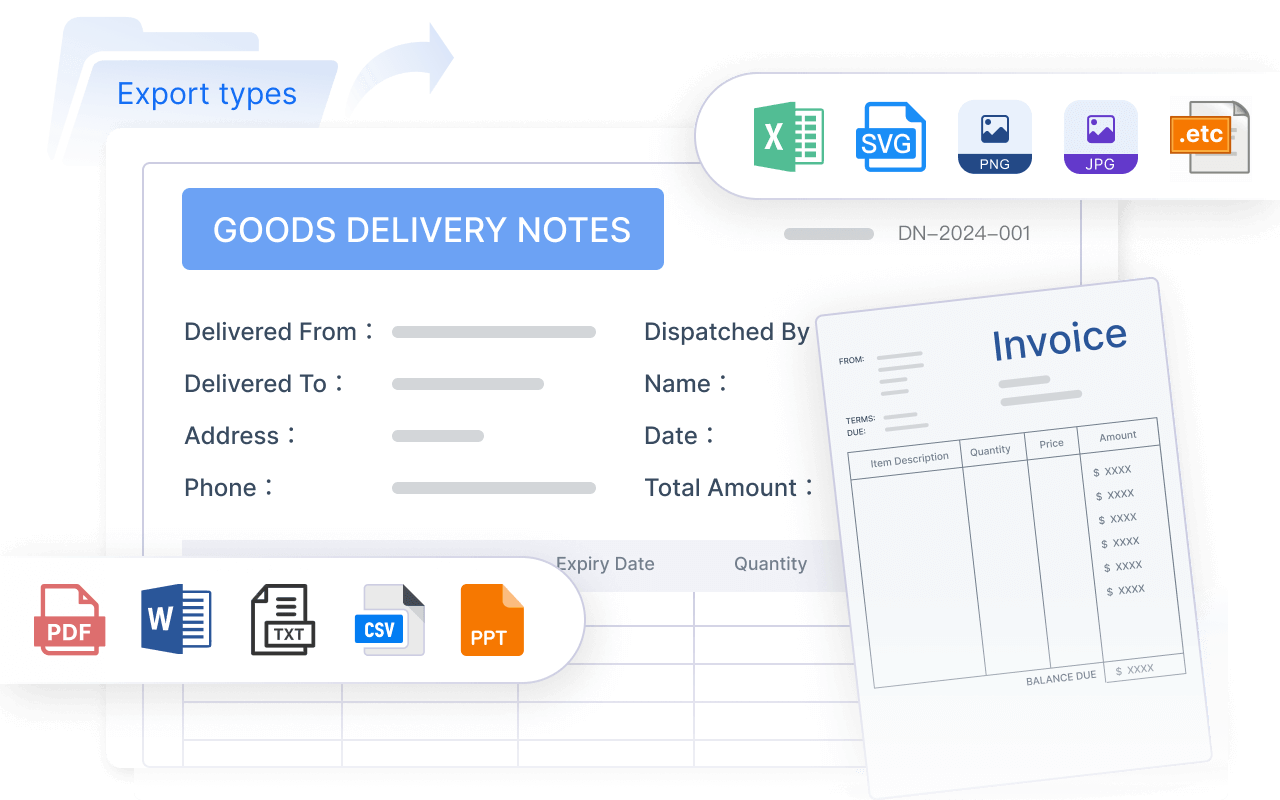
You can export paginated reports in many formats. This flexibility makes it easy to share your work with others. FineReport lets you export paginated reports as PDF, Excel, Word, and HTML files. You can choose the format that fits your needs.
Exporting reports helps you distribute information quickly. You can send print-ready documents to managers, clients, or partners. You can also save reports for future reference or compliance checks.
Here are some common export options you will find:
You can automate the export process, so your team always gets the latest reports on time.
Paginated reports help you manage large datasets with ease. You can display thousands or even millions of rows without losing clarity. FineReport and similar tools organize your data across multiple pages, so you never feel overwhelmed.
You can use filters and parameters to show only the data you need. This keeps your reports fast and easy to read. You can also group and sort data to highlight important trends.
When you work with large data, you need reliable performance. FineReport uses advanced data connectors to handle information from many sources. You can connect to databases like SQL Server Reporting Services and process data efficiently.
Note: Always test your reports with real data to make sure they load quickly and display correctly.
Paginated reports give you the tools to create clear, organized, and print-ready documents. You control every detail, export in multiple formats, and handle large datasets with confidence.
Automation and scheduling make your reporting process much easier. You do not have to create or send reports by hand every time. With paginated reports, you can set up automatic tasks that save you time and reduce mistakes.
FineReport gives you powerful automation tools. You can schedule reports to run daily, weekly, monthly, or at any custom time. This means your team always gets the latest data without waiting for manual updates. You can also set up automatic delivery. FineReport can send reports by email, save them to a shared folder, or even push them to a mobile app.
Here are some key benefits of automation and scheduling in paginated reports:
Tip: Use scheduling to make sure your managers and team members always have the information they need for meetings or decision-making.
FineReport’s automation features go beyond simple scheduling. You can set up rules to trigger reports based on events, such as the end of a sales period or a change in inventory levels. You can also combine automation with data integration tools like FineDataLink. This lets you pull real-time data from many sources and include it in your scheduled reports.
Here is a table showing common automation options in FineReport:
| Automation Feature | What You Can Do |
|---|---|
| Scheduled Tasks | Run reports at set times (daily, weekly, etc.) |
| Email Distribution | Send reports automatically to chosen recipients |
| File Export | Save reports to folders in different formats |
| Mobile Push | Deliver reports to mobile devices instantly |
| Event-Based Triggers | Generate reports when specific events occur |
You can also monitor scheduled tasks in FineReport’s management platform. You see which reports have run, check for errors, and make changes if needed. This gives you full control over your reporting process.
Automating your paginated reports helps your business stay informed and agile. You make sure everyone has the right data at the right time. With FineReport, you turn reporting into a smooth, reliable process that supports your goals.
When you work with paginated reports, you often compare FineReport and power bi report builder. Both tools help you create detailed, print-ready documents. You use power bi report builder to design reports inside the Microsoft ecosystem. The interface feels familiar if you know Microsoft Office. You can build reports with tables, charts, and images. You also get strong reporting features, but you may need more setup time.
FineReport gives you a drag-and-drop interface. You create reports quickly, even if you do not have much technical experience. You can customize every part of your report and connect to many data sources. You also get powerful scheduling tools for reports and alerts. Power bi report builder offers customization, but FineReport makes it easier to adjust layouts and automate tasks.
Here is a table that shows how FineReport and power bi report builder compare:
| Feature | FineReport | Power BI Report Builder |
|---|---|---|
| User-friendliness | Drag-and-drop interface for easy report creation | Microsoft Office-like interface for familiarity |
| Customization | High level of customization for reports and dashboards | Offers customization but may be less intuitive |
| Data Source Compatibility | Supports various data sources and easy integration | Integrates well within Microsoft ecosystem |
| Scheduling and Alerting | Powerful scheduling tools for reports and alerts | Limited scheduling capabilities |
| Reporting Features | Comprehensive reporting capabilities | Strong reporting features but may require more setup |
You see that power bi report builder works well if you use Microsoft products. FineReport gives you more flexibility and control over your reports.
You get several unique advantages when you choose FineReport for paginated reports. You can design pixel-perfect documents with exact layouts. You control every detail, from page size to margins. You also automate report generation and delivery. FineReport supports many data sources, so you can connect to databases, files, and cloud platforms.
You use FineReport to handle large datasets. You organize data across multiple pages and keep your reports clear. You also set up scheduled tasks, so your team receives reports on time. FineReport lets you export reports in formats like PDF, Excel, Word, and HTML. You can share information easily and keep your business running smoothly.
Tip: FineReport helps you meet strict business standards for compliance and accuracy. You can rely on its advanced features to deliver reliable, print-ready documents.
You use paginated reports for many business intelligence tasks. You create financial statements, invoices, and monthly board reports. You also build quarterly investment summaries for clients. These reports need precise formatting and clear data presentation.
Power bi paginated reports focus on pixel-perfect rendering for printed or PDF outputs. You view these reports page-by-page, which makes them ideal for formal reporting needs. You use power bi report builder to create parameter-driven reports and pre-defined templates. You also use it for regulatory compliance and large datasets.
Here are some common use cases for paginated reports in business intelligence:
You see that both FineReport and power bi report builder help you create structured, professional documents. FineReport gives you more options for customization and automation. Power bi paginated reports work best if you need tight integration with Microsoft tools.
| Use Case | Description |
|---|---|
| Regulatory Compliance | Required for precise formatting and data presentation in reports. |
| Large Datasets | Suitable for structured display over multiple pages. |
| Parameter-Driven Reports | Custom reports tailored for specific users or scenarios. |
| Pre-defined Templates | Reports that must match specific layouts, such as financial statements or invoices. |
You choose the tool that fits your business needs. FineReport offers flexibility and advanced features. Power bi report builder provides strong integration with Microsoft products.
You can create paginated reports in FineReport by following a clear set of steps. This process helps you organize your data and present it in a professional format. Here is how you get started:
By following these steps, you make sure your reports are organized and easy to understand. You can create paginated reports that meet your business needs.
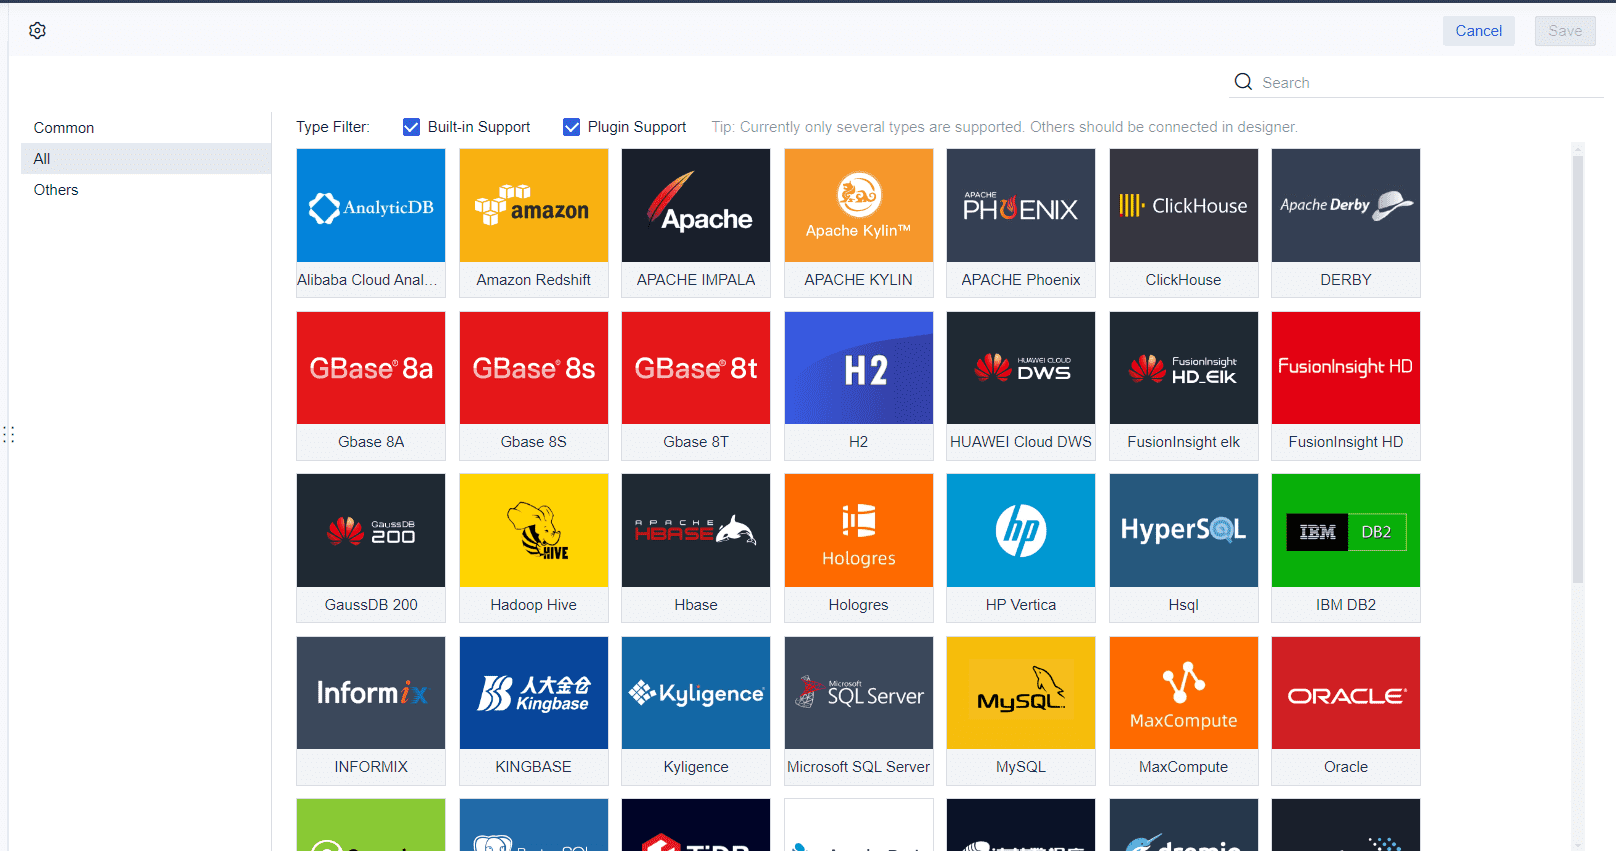
FineReport gives you powerful tools to connect with many data sources. You can use FineDataLink to integrate data from different systems. This makes it easier to create paginated reports with up-to-date information.
Here is how you set up data source integration:
You can connect to databases, cloud platforms, and file sources. This flexibility lets you create paginated reports using data from anywhere in your organization.
FineReport offers many customization options for your paginated reports. You can choose the report type and design mode that fits your needs. The table below shows some common options:
| Report Type | Usage Scenario | Design Mode | Features | Template Suffix |
|---|---|---|---|---|
| Normal Report | Gridded, complex | Excel-like, merge cells | Pagination, columns, grouping, dynamic cells | .cpt |
| Aggregation Report | Irregular, large layouts | Canvas-style, drag components | Cell expansion and separation | .cpt |
| Dashboard | Management, large-screen | Canvas-style, adaptive layout | Multi-screen, mobile adaptive, partial refresh | .frm |
You can merge cells, group data, and set up dynamic operations. You can also design dashboards for management teams or create reports for specific departments. FineReport lets you tailor every detail so you can create paginated reports that match your business goals.
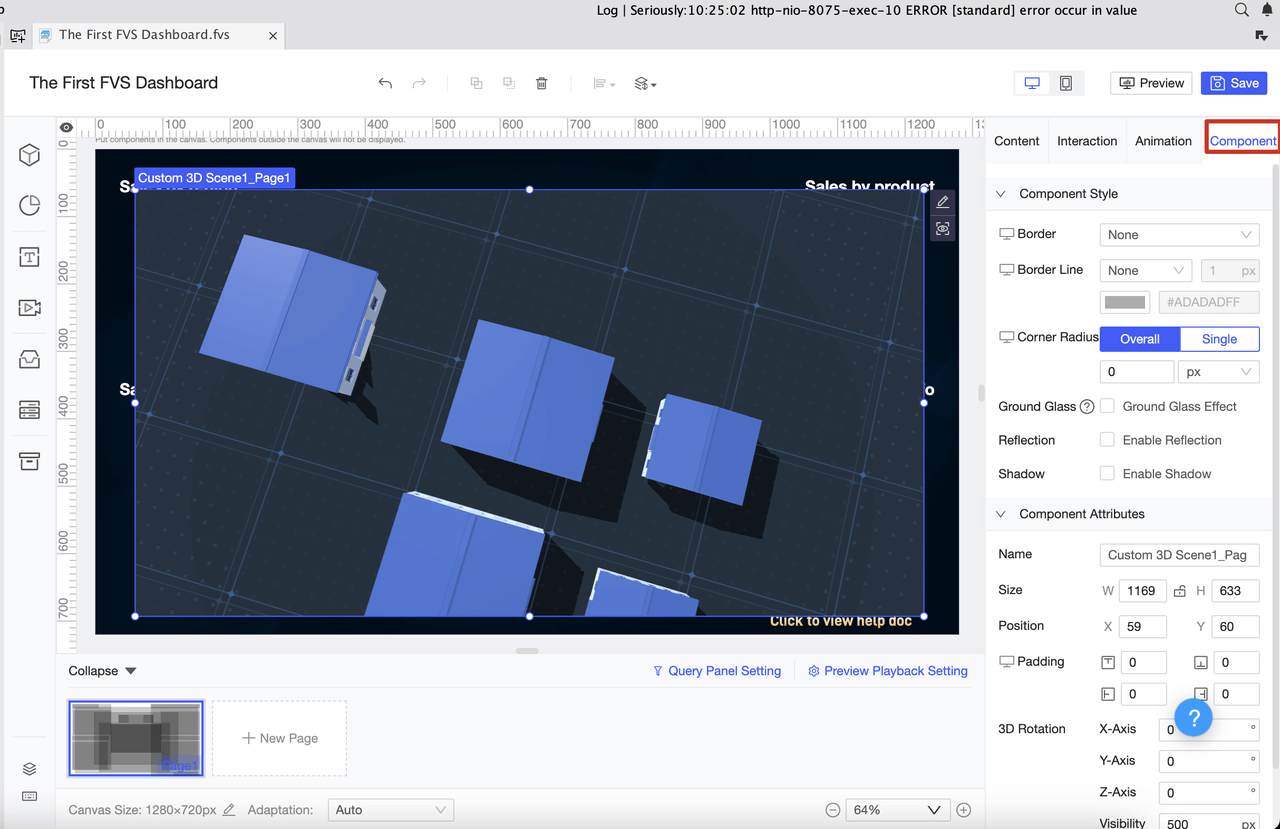
Tip: Use customization features to highlight important data and make your reports easy to read.
Designing paginated reports in FineReport requires careful planning and attention to detail. You want your reports to be clear, easy to read, and useful for decision-making. Here are some best practices that help you achieve professional results:
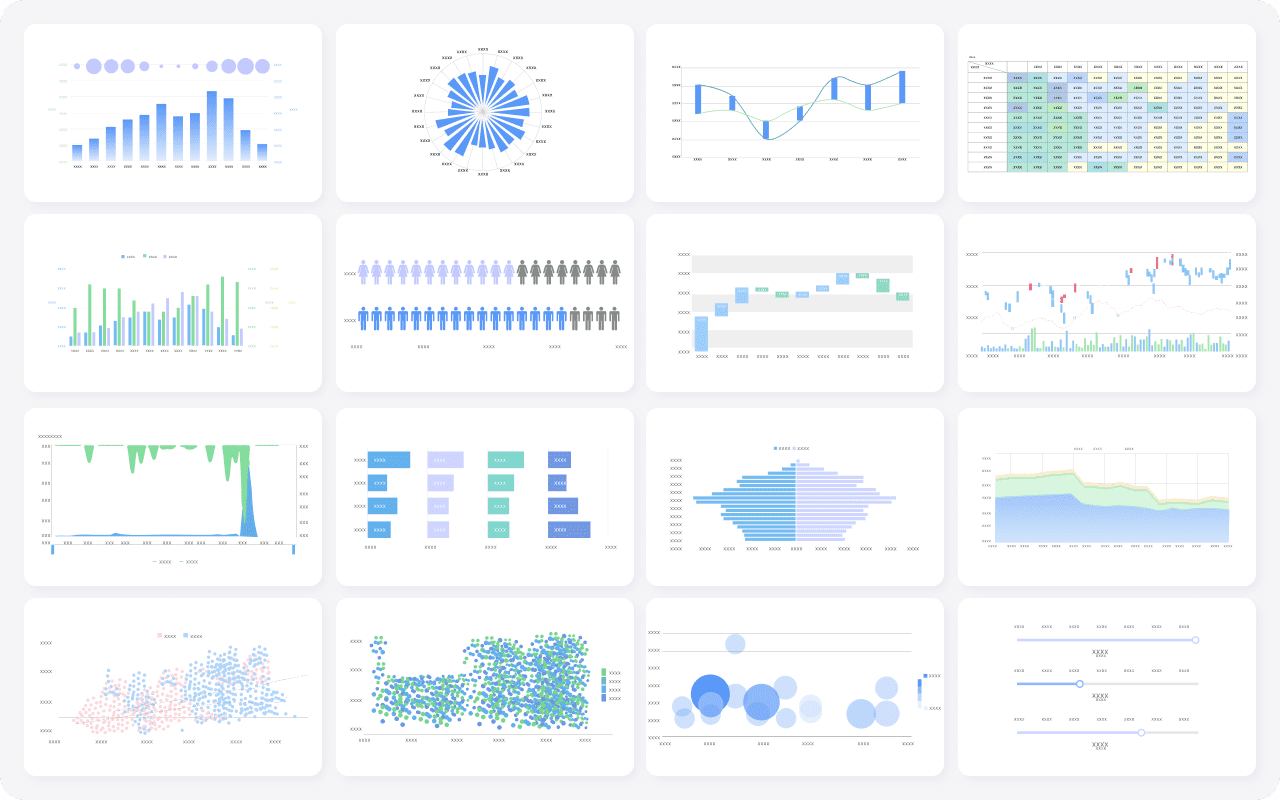
Tip: Always preview your report before sharing. Look for missing labels, misaligned columns, or extra spaces. A quick check saves time and improves quality.
Here is a table that summarizes these best practices:
| Practice | Benefit |
|---|---|
| Define report questions | Focused and relevant design |
| Choose suitable visualizations | Clear data presentation |
| Test export formats | Consistent layout across outputs |
| Early parameter setup | Reliable filtering and subscriptions |
| Stage layout building | Easier adjustments and organization |
| Conditional visibility | Less clutter, more user control |
| Background color for nesting | Improved readability and management |
When you follow these best practices, you create paginated reports that are accurate, attractive, and easy to use. FineReport gives you the tools to design reports that meet your business needs and impress your audience.
You often need to create financial statements that follow strict formatting rules. Paginated reports help you organize these documents with clear sections and accurate data. You can present every detail in a way that meets business and regulatory standards. Most companies use paginated reports to generate the following types of financial statements:
Each report gives you a different view of your company’s financial health. You can use power bi paginated reports or FineReport to ensure your statements look professional and are easy to review. These tools let you repeat headers, add footers, and keep your layout consistent across every page. This approach helps you share financial data with managers, auditors, and investors.
Many industries require you to follow strict rules for reporting. Paginated reports play a key role in meeting these requirements. You can format your documents to match regulatory standards and keep accurate records for audits.
Organizations dealing with regulatory compliance can leverage paginated reports to document and report on compliance activities, ensuring transparency and adherence to regulatory standards.
Paginated reports help you maintain audit trails and meet statutory obligations. For example, you might need to create reports for:
You can use power bi paginated reports to automate the creation of these documents. This ensures you always have up-to-date records ready for review. FineReport also supports compliance reporting by letting you schedule and distribute reports automatically. This reduces manual work and helps you avoid errors.
You use operational dashboards to monitor your business in real time. While dashboards show live data, paginated reports provide detailed, formatted outputs that support decision-making. You can print these reports or share them as official documents.
| Role of Paginated Reports in Operational Dashboards | Description |
|---|---|
| Purpose | Paginated reports are optimized for printing and provide formatted outputs like invoices and financial statements. |
| Complementary Role | They can provide detailed insights necessary for operational decision-making, complementing real-time dashboards. |
Power bi paginated reports and FineReport both let you export operational data in formats like PDF or Excel. This makes it easy to share information with your team or management. You can combine real-time dashboards with paginated reports to get a complete view of your operations. This approach helps you track performance, spot trends, and make better decisions.
You can find paginated reports in many industries. These reports help you organize data, meet regulations, and make better decisions. FineReport and FanRuan have helped thousands of companies improve their reporting processes. Let’s look at some real-world examples.
Manufacturing
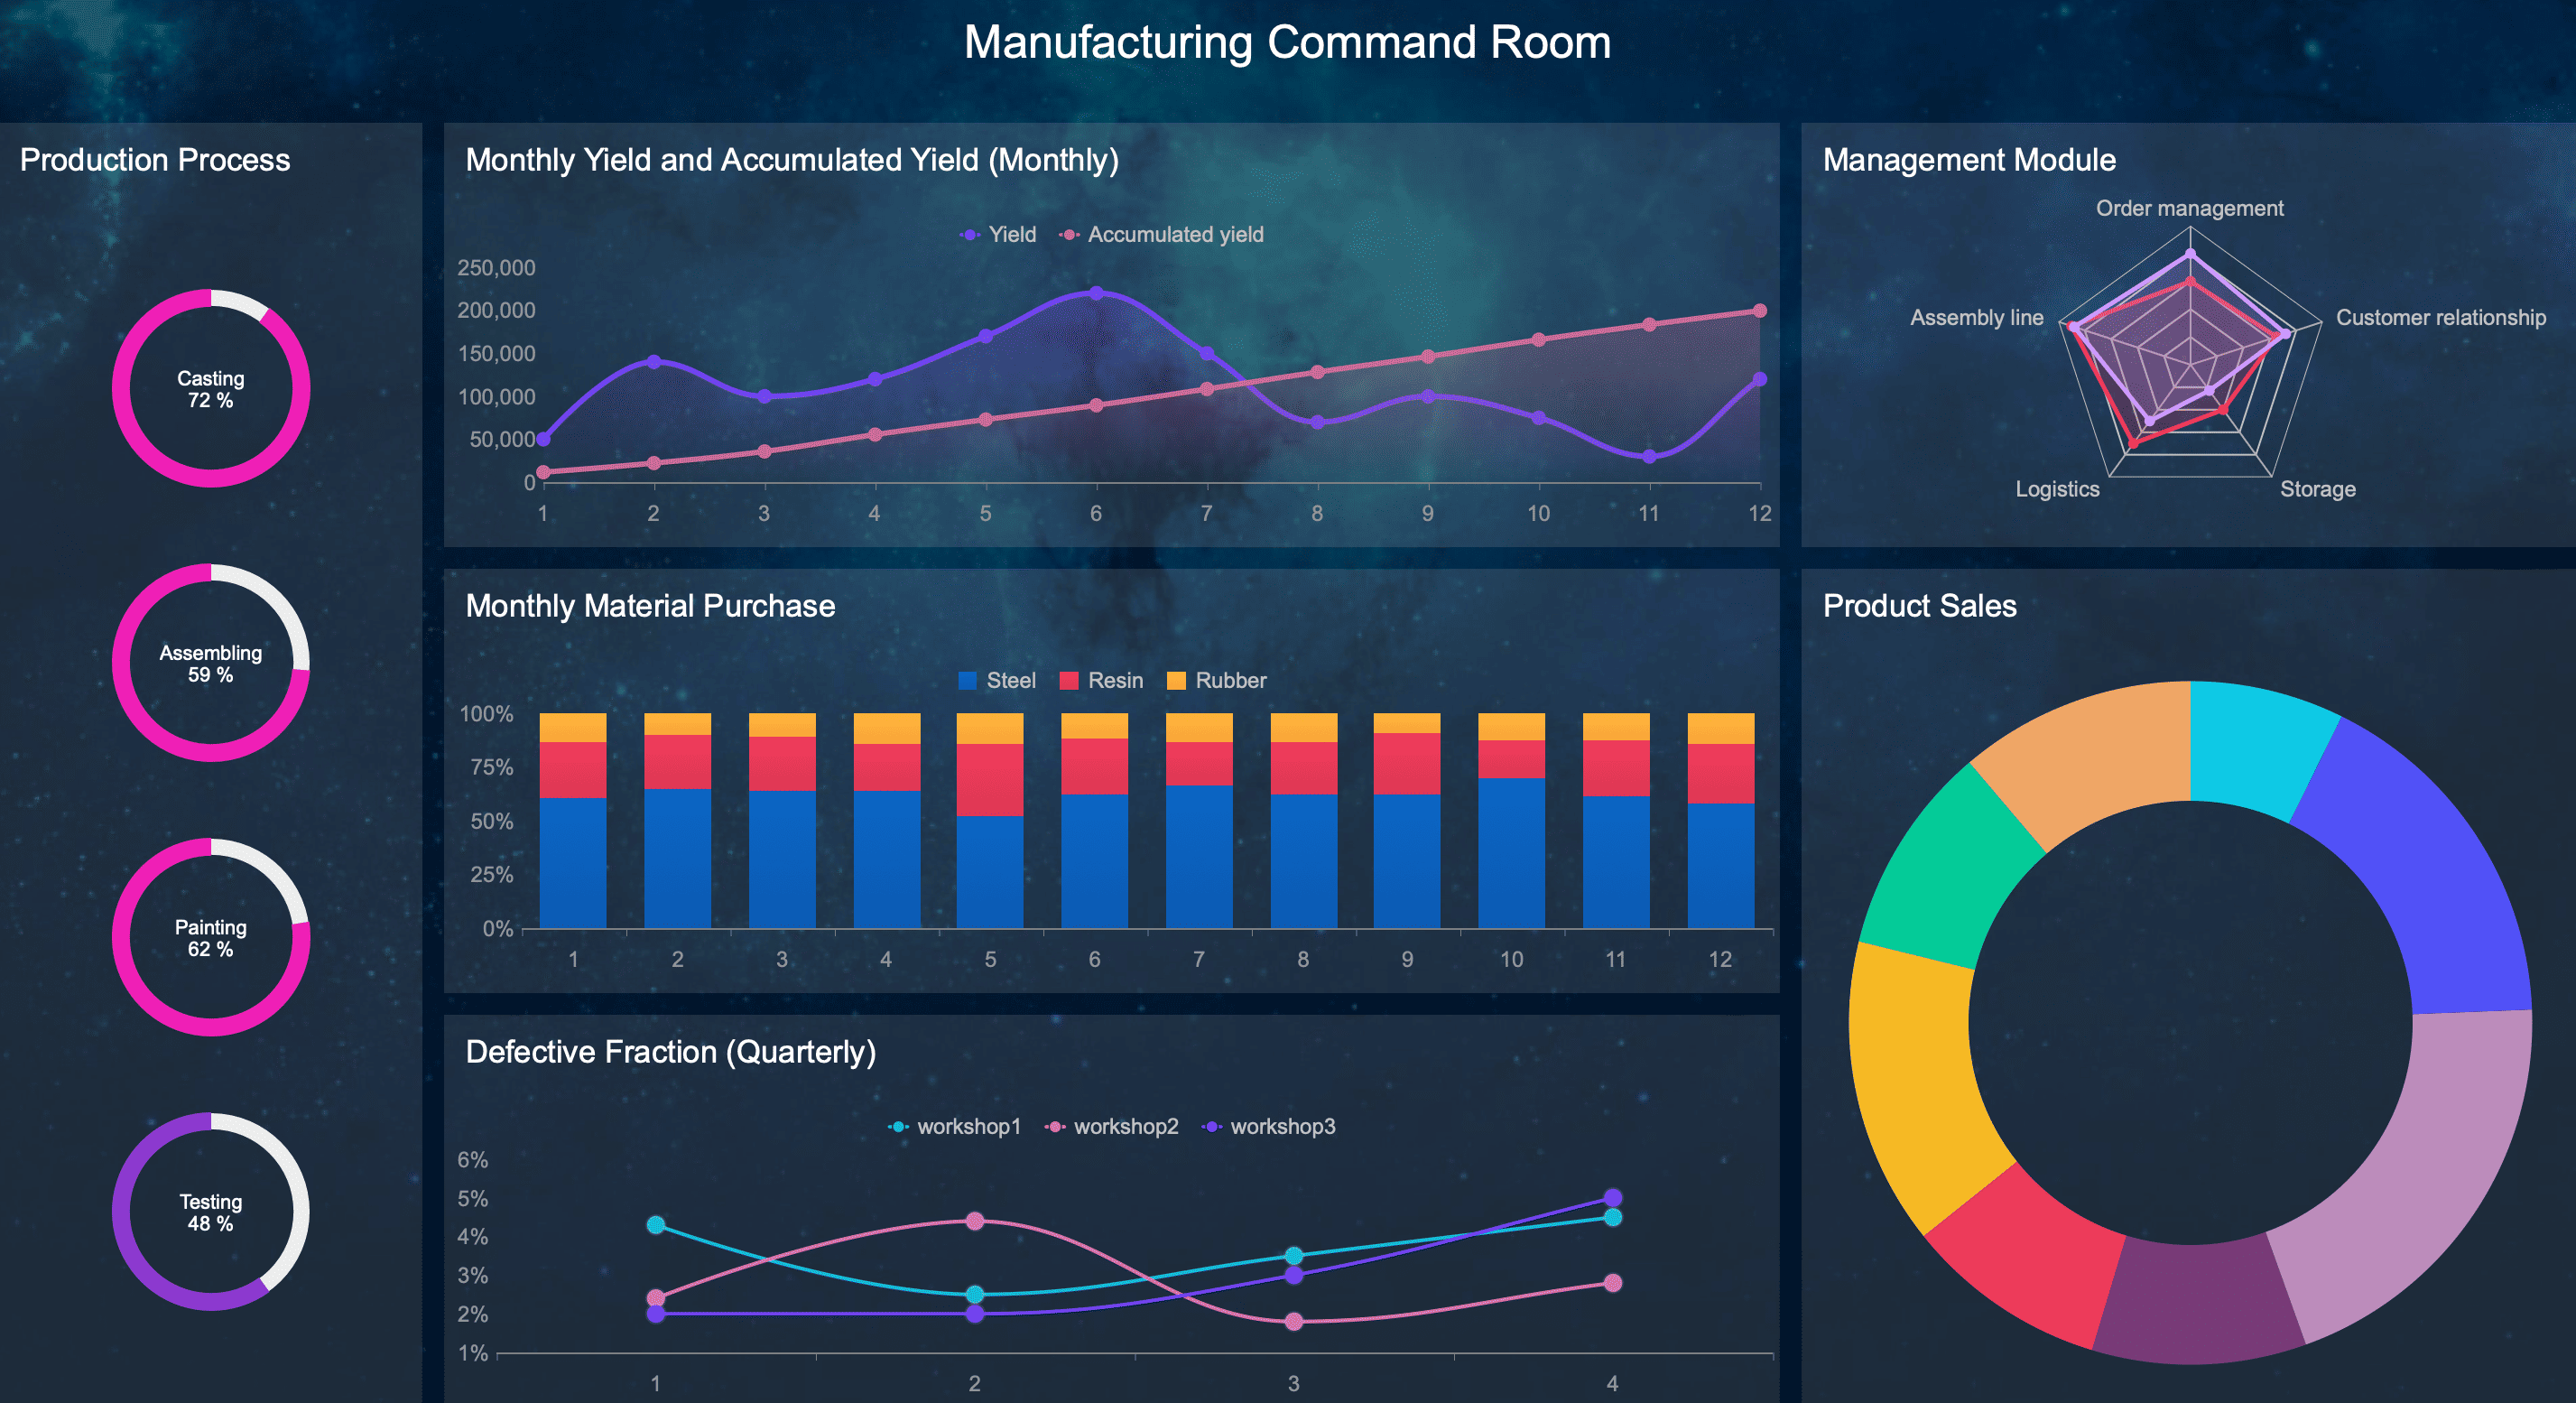
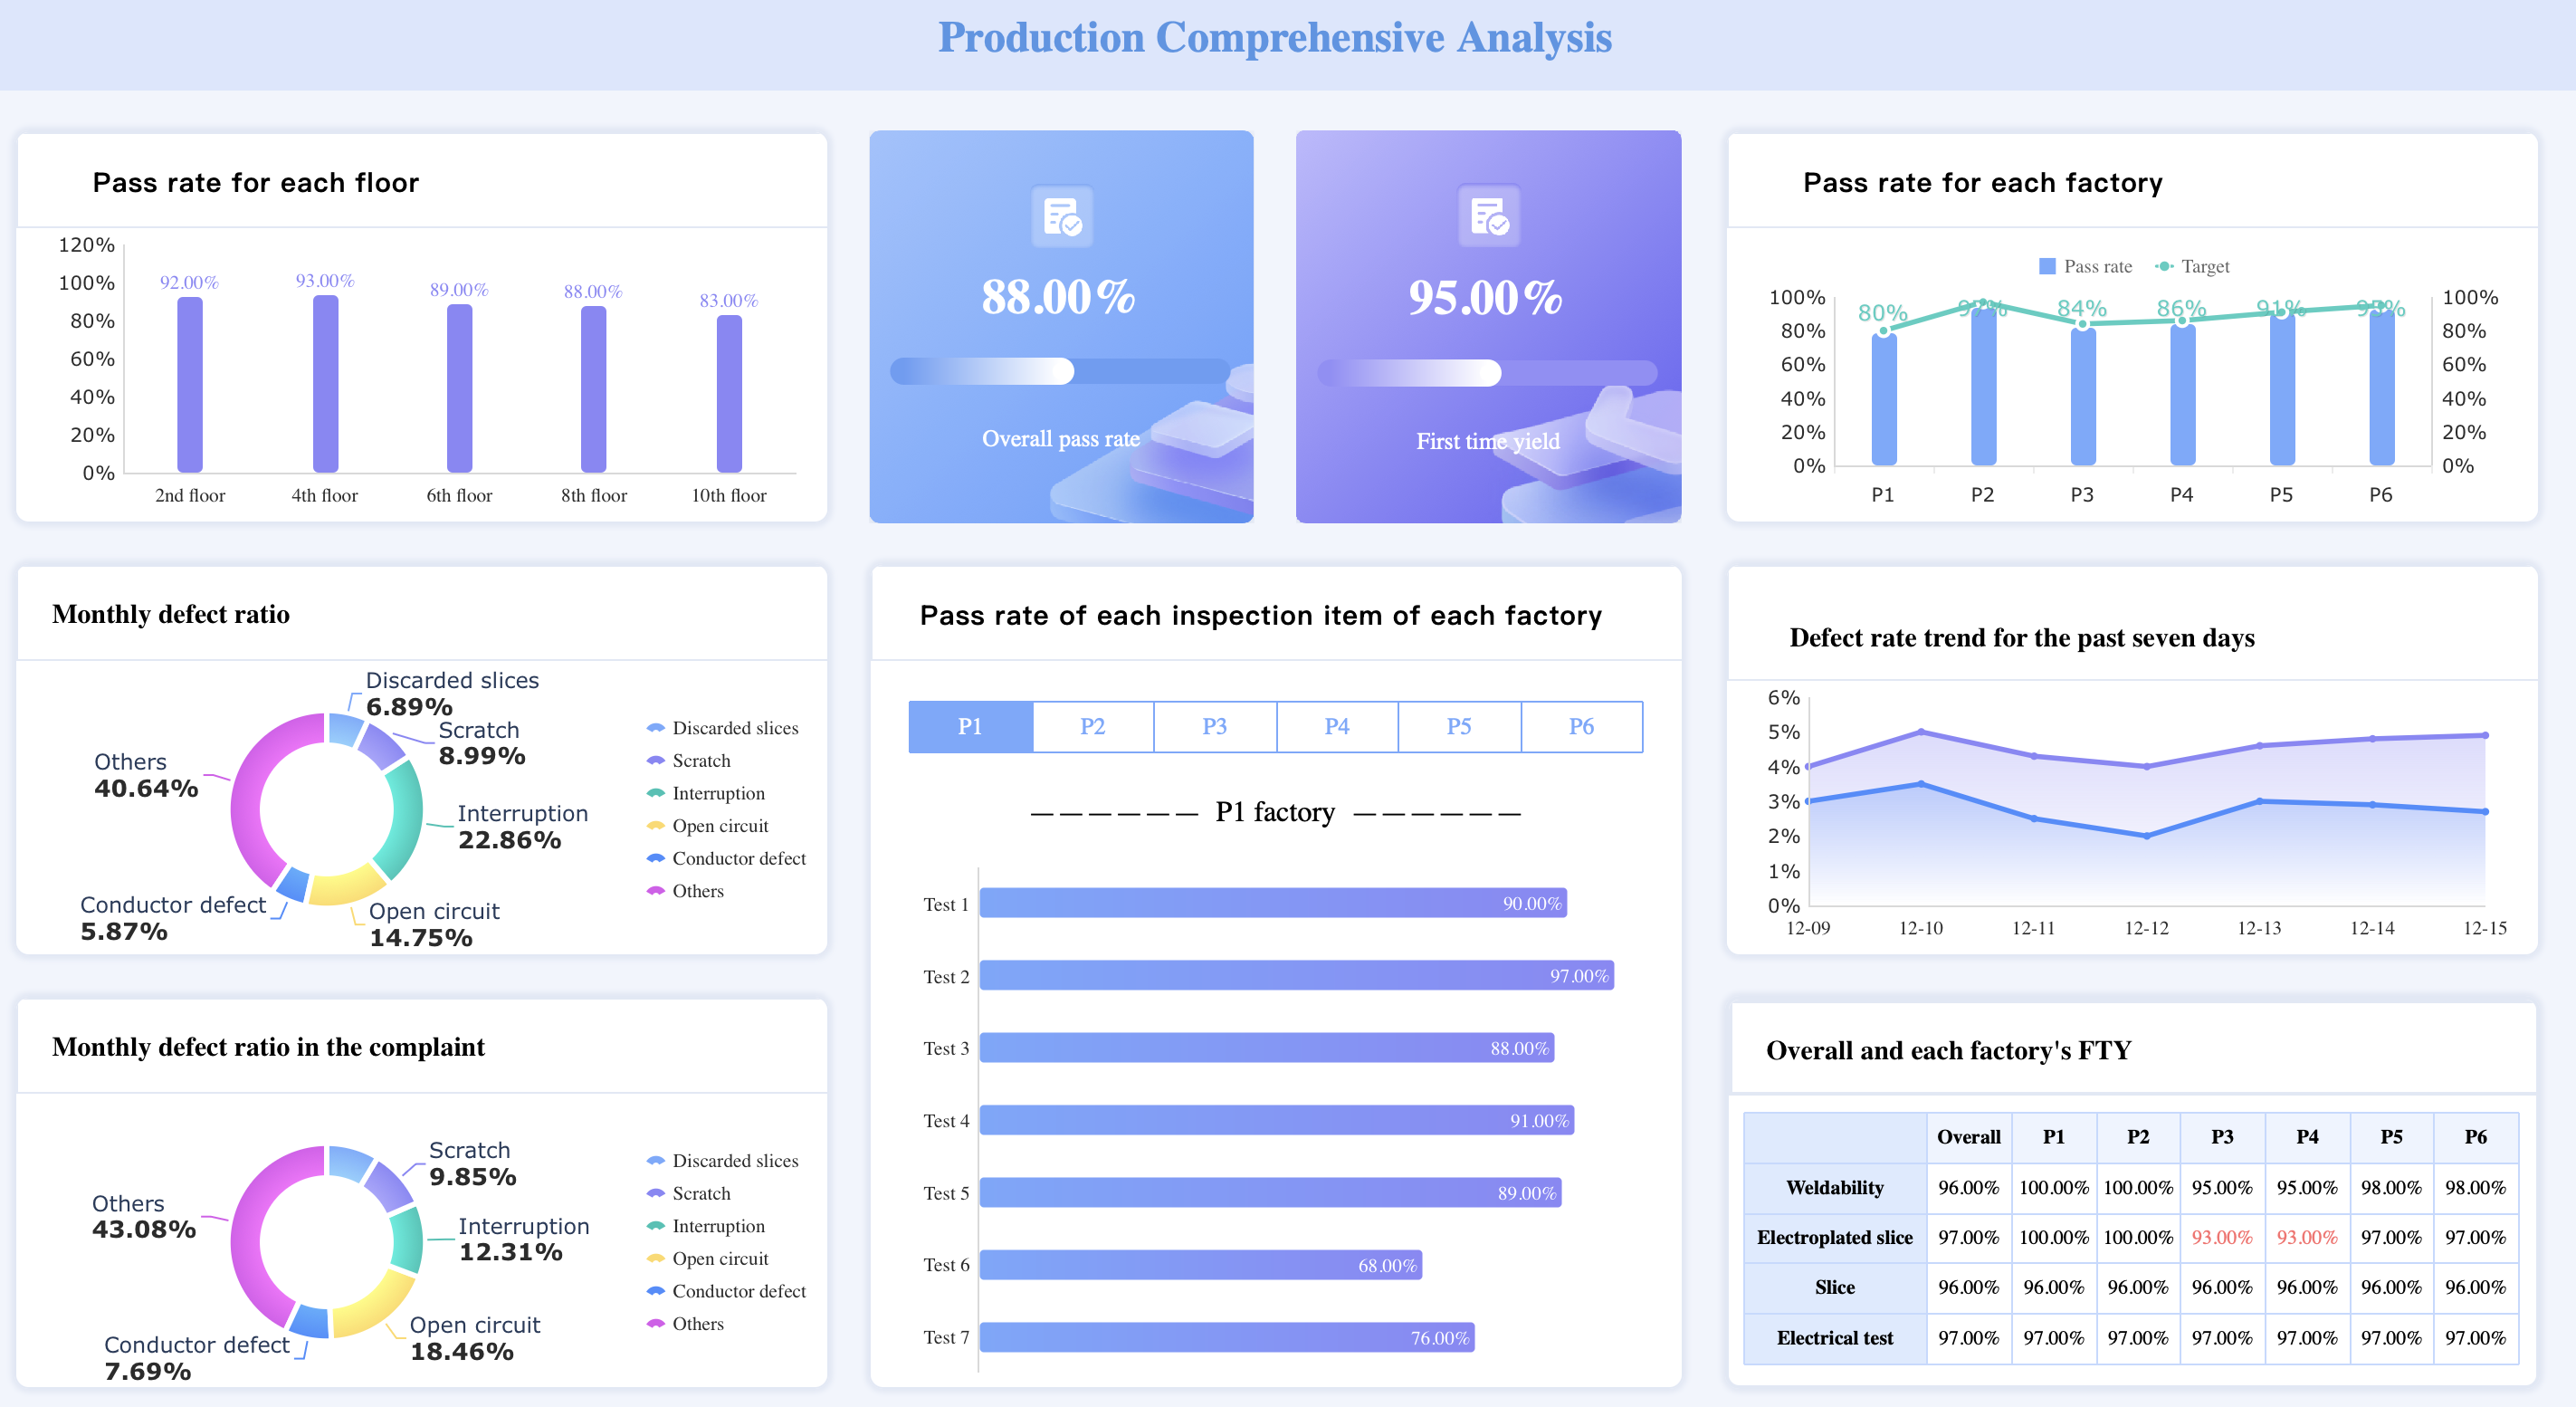
You work in manufacturing. You need to track production, inventory, and safety. FineReport lets you create daily production reports, equipment maintenance logs, and safety compliance documents. For example, A.O. Smith uses FineReport to monitor production lines and manage inventory. You can set up automated reports that show equipment status and highlight safety issues. This helps you keep operations running smoothly.
Retail
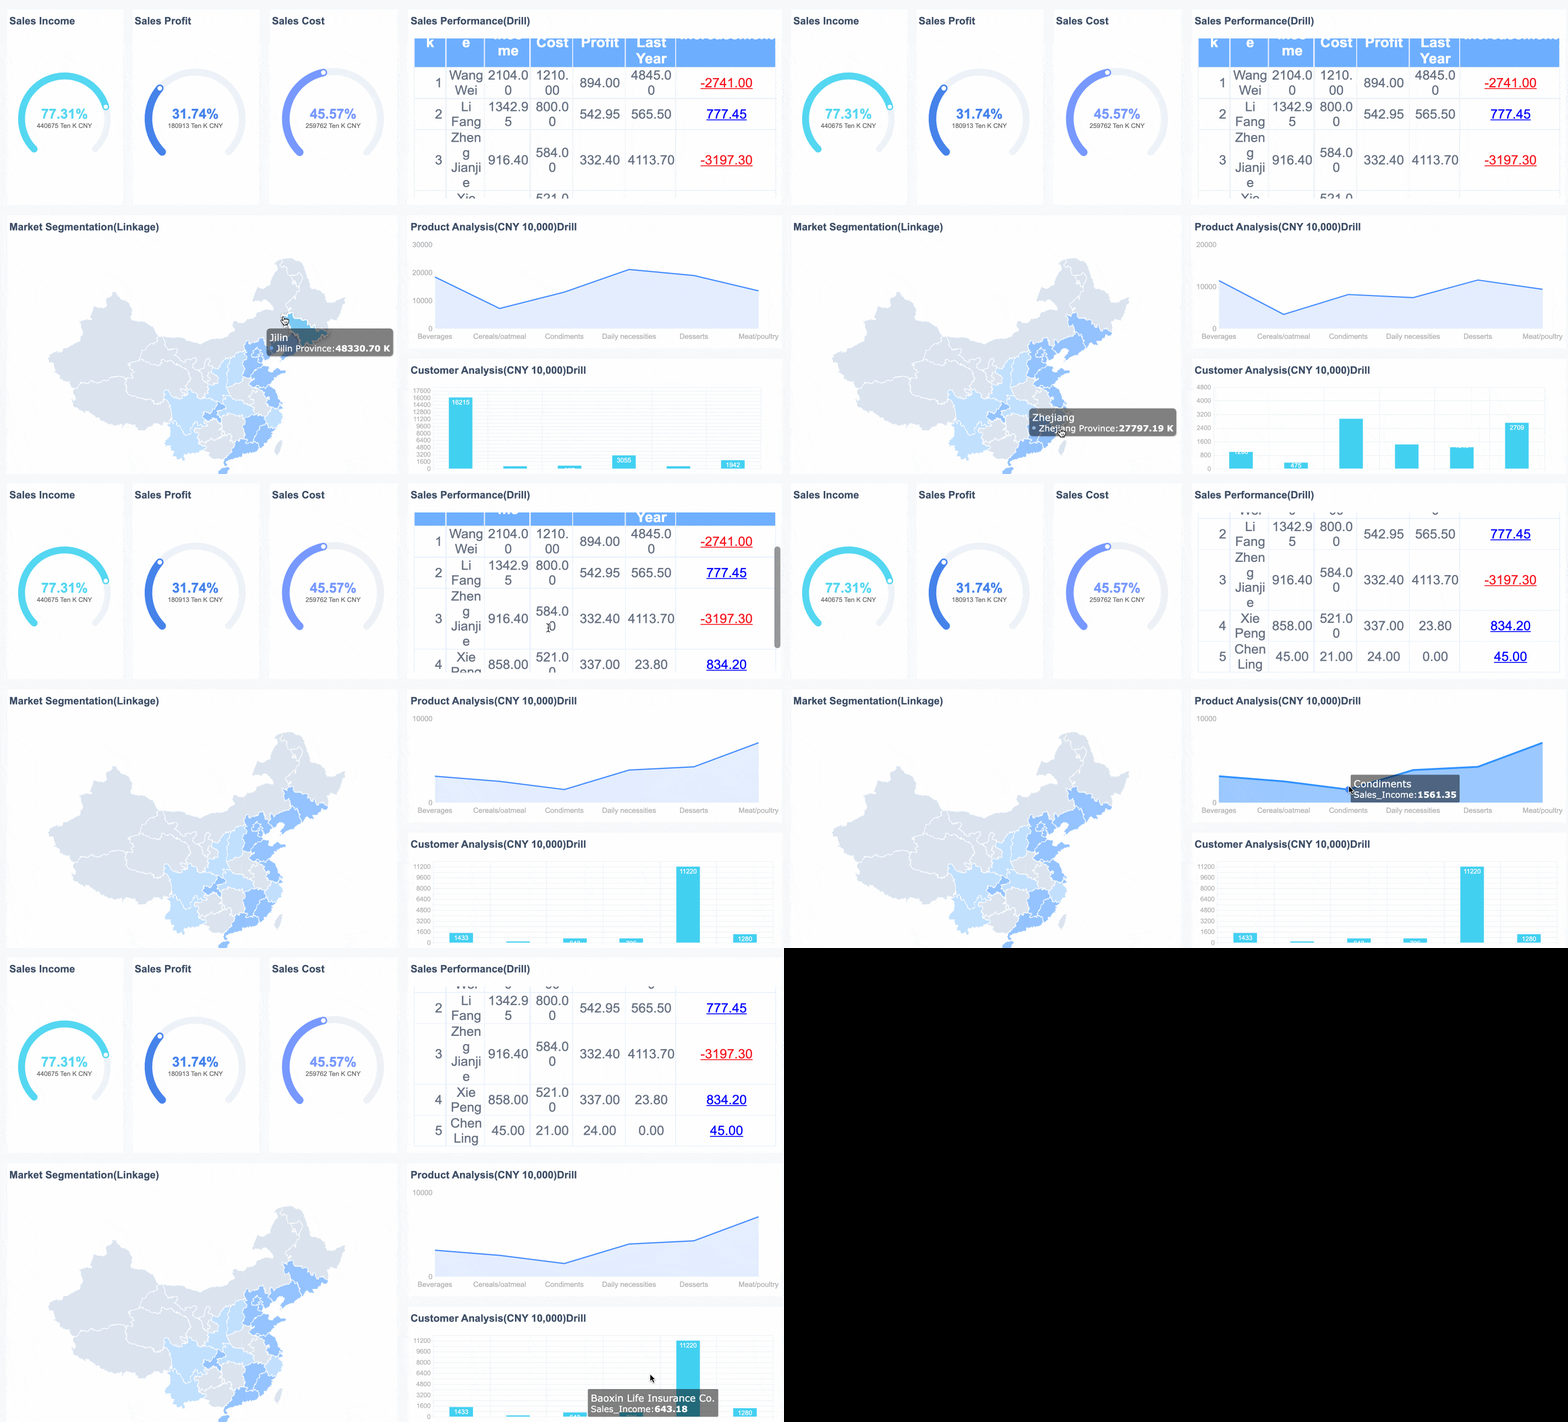
You manage a retail business. You want to analyze sales, inventory, and customer trends. FineReport helps you build sales performance dashboards and inventory reports. Leysen, a leading retailer, uses FineReport to track sales across stores and manage stock levels. You can export reports in PDF or Excel and share them with your team. This gives you a clear view of what products sell best and where you need to restock.
Financial Services
You work in finance. You need to create financial statements, risk analysis reports, and compliance documents. FineReport supports complex calculations and strict formatting. Red Bull uses FineReport to generate monthly financial statements and investment summaries. You can automate report delivery to managers and auditors. This ensures you meet regulatory standards and keep your data secure.
Public Sector
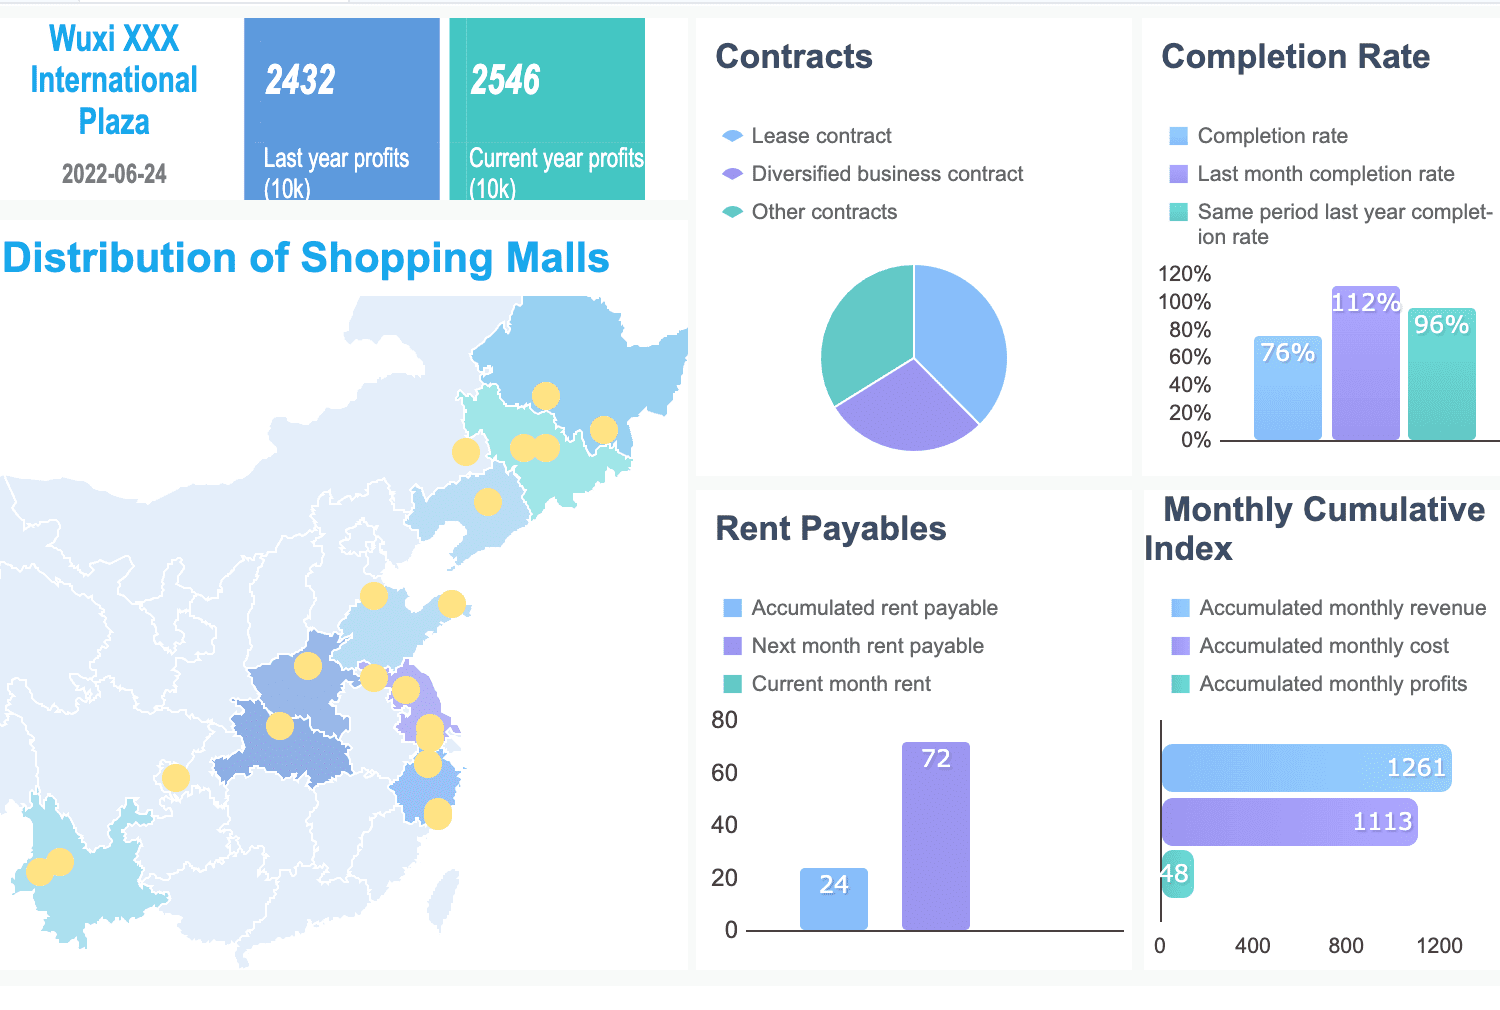
You serve in the public sector. You must report on budgets, project progress, and compliance. FineReport helps you design budget reports and project dashboards. Hongkong Land uses FineReport to manage real estate projects and monitor financial performance. You can schedule reports to run automatically and send them to stakeholders. This keeps everyone informed and supports transparency.
Smart Manufacturing and IoT
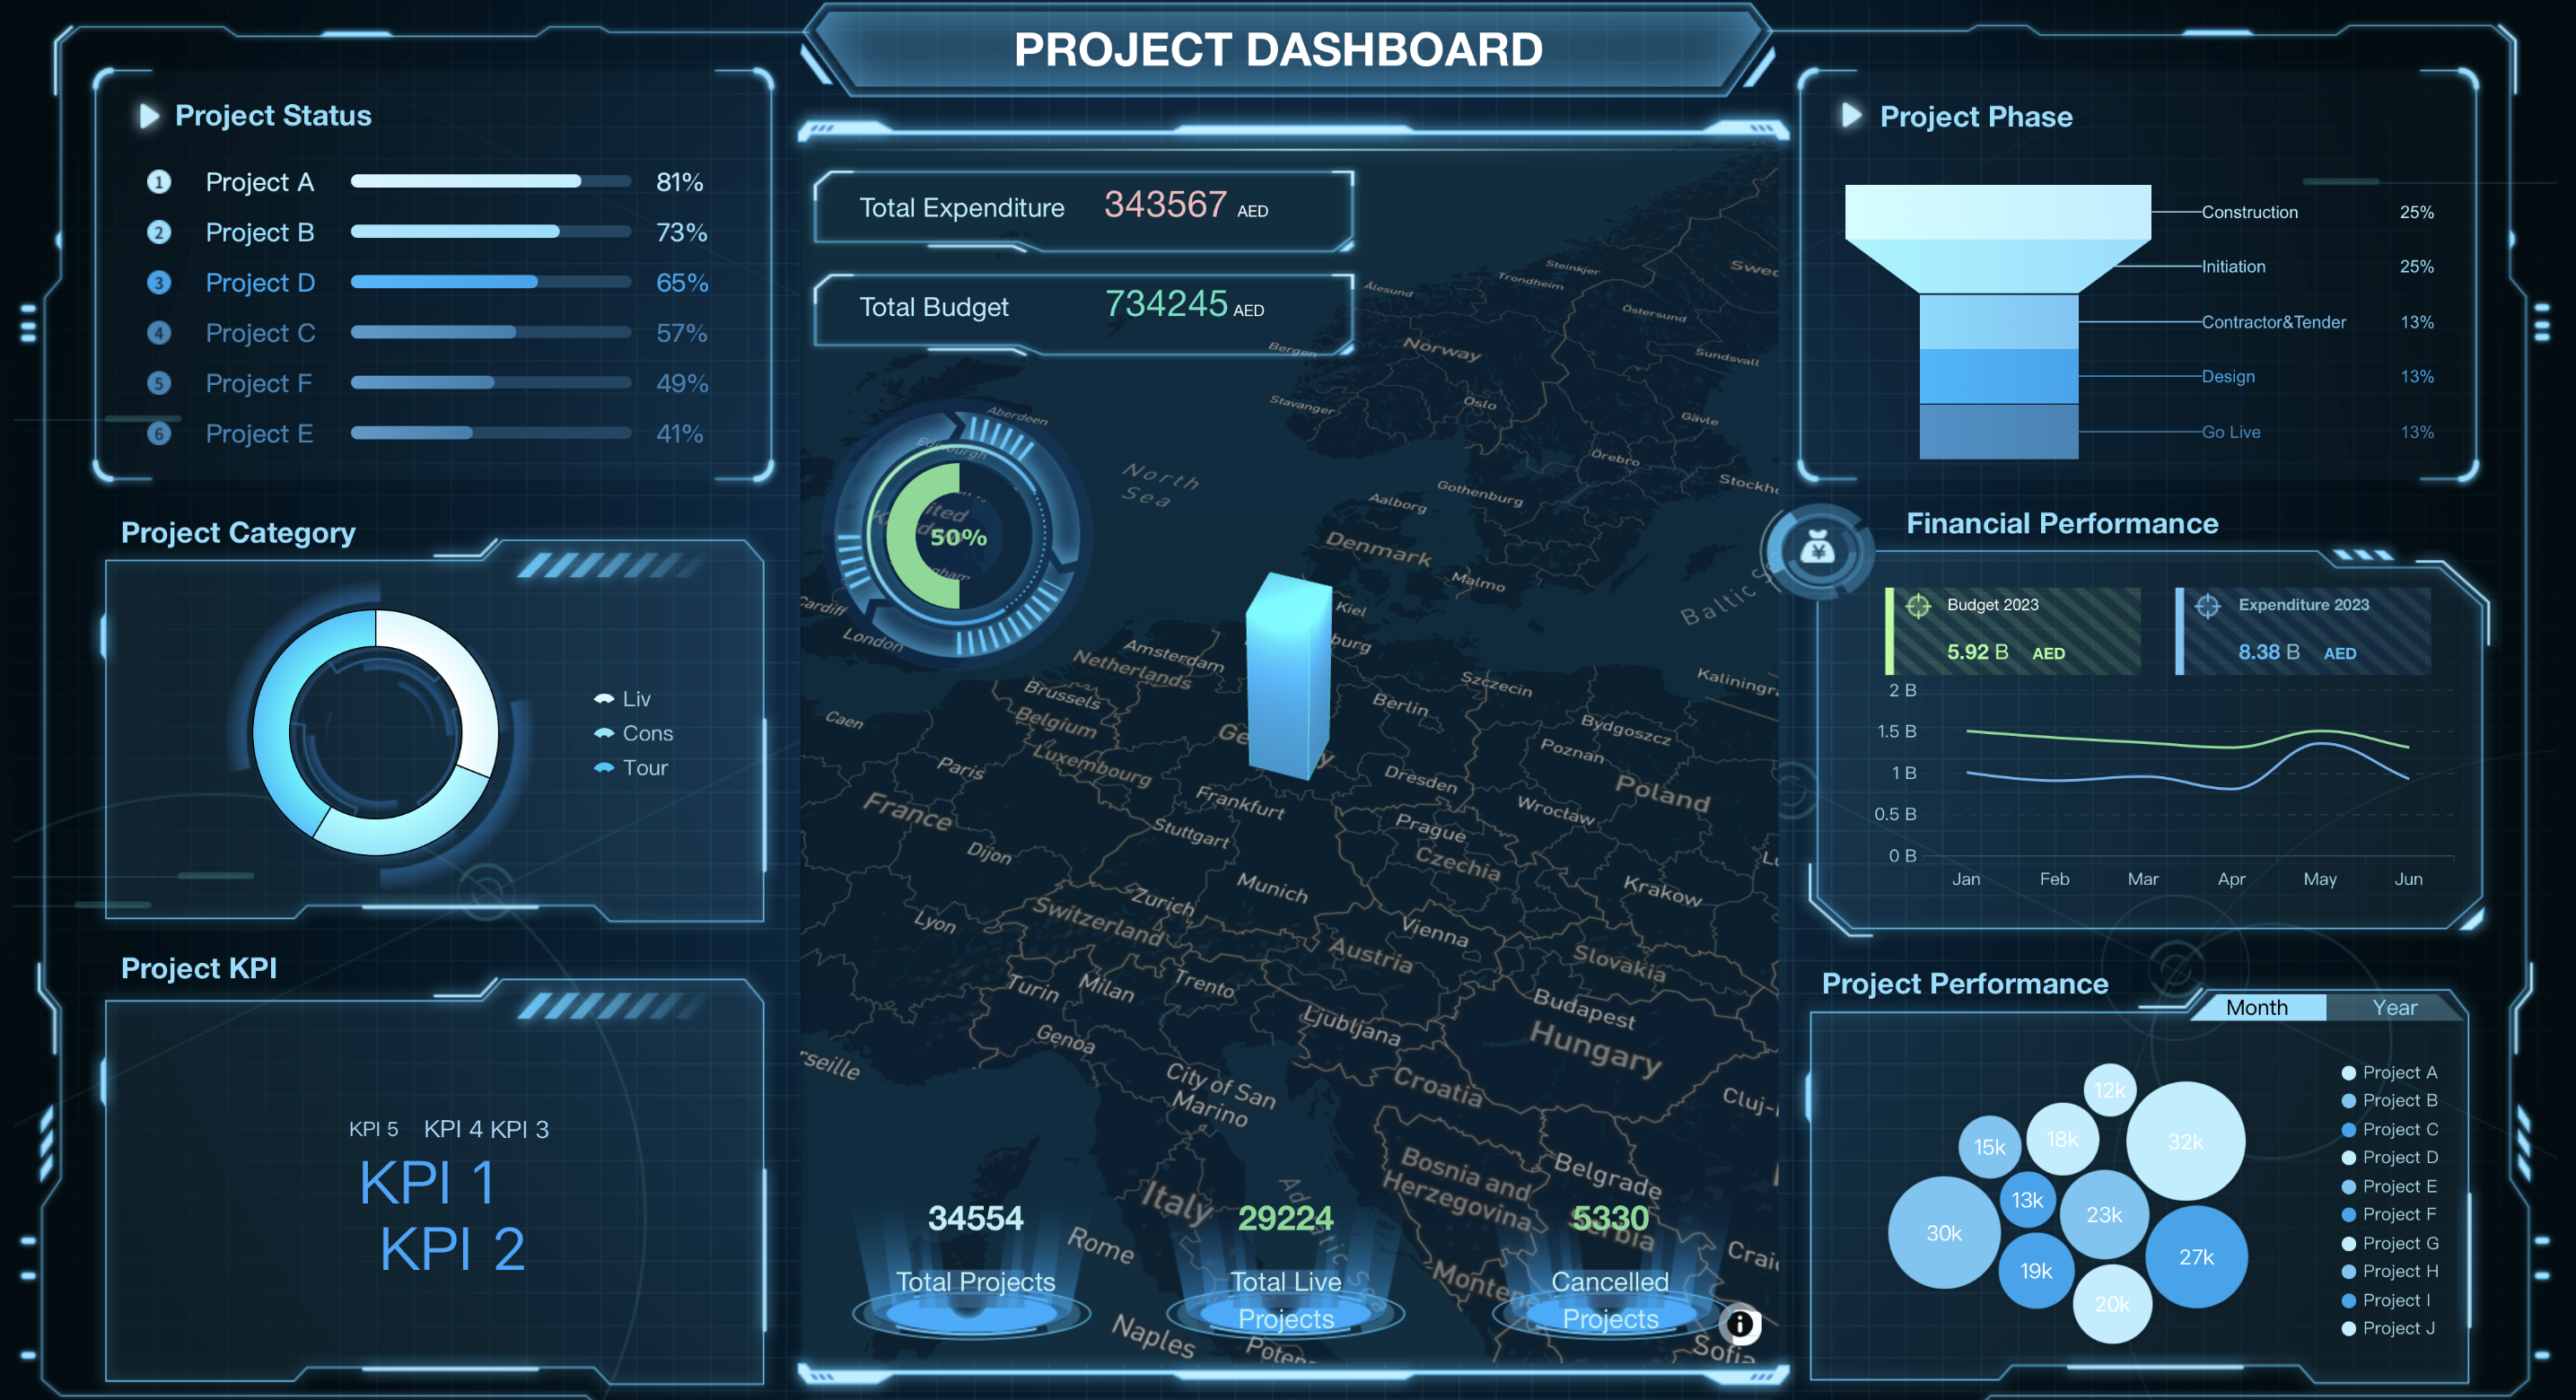
You want to use smart technology in your factory. FineReport lets you connect to IoT devices and collect real-time data. Omron Automation uses FineReport to analyze equipment performance and predict maintenance needs. You can create paginated reports that show sensor data, production rates, and downtime. This helps you improve efficiency and reduce costs.
Here is a table showing how different industries use paginated reports:
| Industry | Example Use Case | Benefit |
|---|---|---|
| Manufacturing | Production and safety reports | Improved efficiency |
| Retail | Sales and inventory dashboards | Better stock management |
| Financial Services | Financial statements and compliance | Regulatory compliance |
| Public Sector | Budget and project dashboards | Transparency and oversight |
| Smart Manufacturing | IoT data analysis | Predictive maintenance |
Tip: You can use paginated reports to solve problems in any industry. FineReport and FanRuan offer flexible solutions that fit your needs.
FanRuan has earned recognition from Gartner and Forbes. You join over 30,000 clients who trust these tools for business intelligence. You can see success stories from companies like Danfoss and Omron Automation. These examples show how paginated reports help you turn data into action.
Paginated reports give you the power to create clear, print-ready documents for your business. You meet strict standards and keep your data accurate with tools like FanRuan and FineReport. Many companies choose pixel-perfect reporting because:
Explore FineReport to see how you can improve your business intelligence with professional, pixel-perfect reports.
Click the banner below to try FineReport for free and empower your enterprise to transform data into productivity!
How to Find Investment Analyst Reports Online

The Author
Lewis
Senior Data Analyst at FanRuan
Related Articles

Top 10 Best Automation Reporting Tool Picks for Businesses
Compare the top 10 best automation reporting tool options to streamline business data, automate reports, and boost decision-making efficiency.
Lewis
Jan 03, 2026
Top 10 Reporting Systems and Tools for Businesses
See the top 10 reporting systems that help businesses automate data, build dashboards, and improve decision-making with real-time analytics.
Lewis
Jan 03, 2026
What is integrated reporting and why is it important
Integrated reporting combines financial and non-financial data, offering a full view of value creation, transparency, and stakeholder trust.
Lewis
Dec 12, 2025