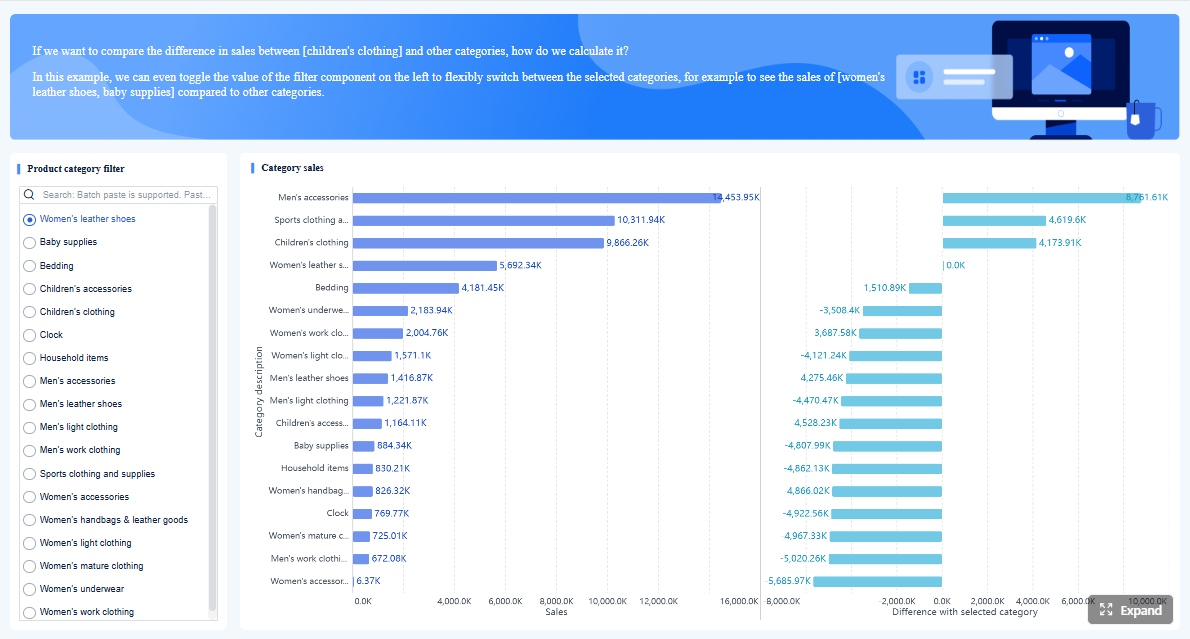
FineReport is an enterprise-grade reporting and dashboard platform designed for building highly formatted, data-intensive, and operational reports at scale.
What to look for in online reporting tools for complex reporting
When companies evaluate online reporting tools, the biggest mistake is treating all reporting needs as if they were the same. In practice, “complex reporting” usually goes far beyond simple charts on a dashboard. It often includes multi-source data integration, dense tabular layouts, approval-ready exports, scheduled distribution, user permissions, and report templates that must remain consistent across teams, regions, or clients.
Click To Try The Dashboard
What “complex reporting” really means
Complex reporting typically includes several requirements at once:
Blending data from multiple systems, such as ERP, CRM, MES, finance, HR, and spreadsheets
Pixel-perfect formatting for invoices, financial statements, production summaries, compliance documents, and operational packs
Multi-page report design with headers, footers, pagination, formulas, grouped sections, and print-ready layouts
Parameterized templates so users can filter by branch, period, product line, or customer without rebuilding reports
Scheduled and large-scale distribution by email, portal, export, or batch generation
Role-based access and governance to ensure different users see only relevant data
Interactive dashboards alongside formal reports, since many organizations need both
This is why choosing between FineReport, Power BI, Tableau, and Zoho Analytics is not only about visual appeal. It is about whether the platform can support the specific reporting workflows your organization depends on.
Evaluation criteria that matter most
If your reporting needs are advanced, these are the core factors worth comparing.
Data connectivity
Look for support for cloud apps, databases, APIs, spreadsheets, and on-premises systems. For many enterprises, the ability to connect to legacy and internal systems is as important as SaaS connectors.
Report design flexibility
This is where major differences appear. Some tools are optimized for dashboards and visual exploration, while others are much stronger for complex tabular documents, print layouts, and form-style reports.
Dashboard interactivity
Interactive filtering, drill-down, drill-through, and user-friendly exploration matter when business users need to investigate trends without relying on developers.
Governance and security Enterprise reporting requires permission controls, centralized management, auditability, and consistent metric definitions across teams.
Scalability
A tool may work well for a small analytics team but struggle when thousands of users need recurring reports or when batch generation becomes heavy.
Total cost of ownership
License price alone is not enough. You should also consider implementation time, training needs, maintenance effort, infrastructure, and whether extra companion products are required for full reporting functionality.
Which teams benefit most from each type of platform
Different teams often prioritize different capabilities.
IT-led reporting teams usually need template control, governance, scheduled delivery, and support for enterprise data sources. FineReport often fits well here.
Analysts and BI teams usually value ad hoc exploration, visual analytics, and model-based dashboards. Power BI and Tableau are strong in this area.
Finance users often need structured, print-ready, repeatable reporting with strict layout requirements. FineReport is especially relevant for this use case.
Client-facing service teams often care about branded external delivery, recurring reports, and secure sharing. Depending on complexity, FineReport or Zoho Analytics may be suitable.
Smaller business teams may prefer faster setup and lower upfront complexity, which is where Zoho Analytics can be attractive.
FineReport vs Power BI vs Tableau vs Zoho Analytics at a glance
If you are comparing online reporting tools for complex reporting, the four platforms serve overlapping but different priorities. The table below provides a quick view.
Cloud BI and reporting platform aimed at accessible reporting for growing teams.
Fast setup, built-in connectors, collaborative dashboards, value-oriented reporting
Low to moderate
Primarily cloud
Subscription-based, generally budget-friendly
Where each platform stands out
FineReport stands out for operational reporting, recurring documents, complex formatted output, and enterprise reporting workflows.
Power BI stands out for organizations already invested in Microsoft and for teams prioritizing self-service dashboards and semantic modeling.
Tableau stands out for data discovery, visual storytelling, and analyst-led exploration.
Zoho Analytics stands out for smaller teams that want a cloud reporting environment with approachable pricing and quick implementation.
The main trade-offs
The trade-off many organizations face is simple: the best platform for visual exploration is not always the best platform for formal reporting output.
If you need interactive analysis first, Power BI and Tableau are often stronger.
If you need highly formatted, print-ready, repeatable reporting first, FineReport has a clearer advantage.
If you need cost-conscious cloud reporting with simpler requirements, Zoho Analytics can be sufficient.
For businesses that need both polished dashboards and complex documents, the decision often comes down to which requirement is more critical and whether a primary platform should be complemented by another tool later.
FineReport: best fit for highly formatted and operational reporting
Among these online reporting tools, FineReport is the most specialized for organizations that treat reporting as a core operational process rather than just a layer of visualization.
One-sentence overview:FineReport is built for enterprises that need complex, formatted, repeatable reports and dashboards across departments.
Role-based permissions and centralized distribution
Dashboard creation alongside formal reports
Pros & Cons:
Pros: Strong for operational reporting, highly customizable layouts, suitable for finance and manufacturing documents, supports enterprise workflows
Cons: More implementation effort than lightweight BI tools, steeper learning curve for advanced design, exploratory analytics may not be its primary strength
Best For: IT-led reporting teams, finance departments, manufacturing reporting, enterprise operations, and organizations with recurring formal report requirements
Where FineReport excels
FineReport performs best when report design cannot be compromised. Many organizations do not just need charts; they need documents that resemble formal business outputs. That can include monthly financial statements, production reports, inventory sheets, sales performance packs, audit-style forms, and management reports with strict layout standards.
Its strengths are especially clear in the following areas:
Highly formatted reporting FineReport is well suited for cases where every column width, merged cell, section header, pagination rule, and print layout matters.
Operational reporting
For reports generated daily, weekly, or monthly across multiple departments, FineReport supports structured templates and recurring workflows well.
Multi-page and document-style layouts
Instead of being limited to screen-first dashboard design, FineReport is more capable when output needs to work as a formal report document.
Parameterized templates
Users can run the same template for different plants, branches, customers, or time periods, which improves consistency and reduces manual effort.
Scheduled distribution
Large-scale batch generation and automated delivery are important for enterprises that need reports sent to many stakeholders on a recurring basis.
This is the key reason FineReport deserves serious consideration in any comparison of online reporting tools for complex reporting. It focuses on an area where many BI tools are only partially optimized.
Potential limitations to consider
FineReport is not the perfect answer for every reporting environment.
Learning curve
Compared with lighter self-service tools, FineReport may require more structured onboarding, especially for teams building advanced templates and enterprise workflows.
Implementation effort
The platform is strongest when integrated thoughtfully into business processes, which means setup and report design can require planning.
Exploratory analytics may need support from another tool
If your users spend most of their time asking open-ended analytical questions, experimenting with visuals, and iterating rapidly, a dedicated visual analytics platform may still be useful alongside FineReport.
These are not necessarily drawbacks for enterprise teams, but they matter when deciding whether the primary priority is operational reporting or self-service discovery.
Best use cases for FineReport
FineReport is a strong fit in several reporting-heavy scenarios:
Pros: Strong value for Microsoft-centric organizations, broad community adoption, powerful for dashboards and analysis
Cons: Print-ready and document-style reporting can require additional setup, formatted reporting is less native than in specialized reporting tools
Best For: Organizations invested in Microsoft, business teams adopting self-service BI, and companies prioritizing interactive dashboards
Power BI is often the default choice for enterprises that already use Microsoft technology broadly. It offers a strong mix of connectivity, modeling, visualization, and enterprise administration. For dashboard-centric reporting, it is highly competitive.
Its biggest strength is that it allows organizations to create a governed analytics layer while still supporting broad business-user access. This makes it attractive for KPI dashboards, sales analytics, management reporting, and cross-functional BI projects.
However, when reporting becomes document-heavy, Power BI may feel less direct. Dense tabular reports, complex print layouts, and operational batch outputs often require more work or companion capabilities. That does not make Power BI a weak tool; it simply means its core design philosophy leans more toward analytics and dashboards than formal reporting documents.
Tableau
One-sentence overview: Tableau is a visual analytics platform designed for flexible exploration, rich dashboards, and data storytelling.
Pros: Excellent for visual analysis, intuitive for many analysts, strong for uncovering trends and patterns
Cons: Less ideal for dense tabular reports and document-style outputs, can be less efficient for highly formatted operational reporting
Best For: Analyst teams, BI centers of excellence, and organizations prioritizing visual exploration over print-ready reporting
Tableau remains one of the strongest options for users who want to interact deeply with data and communicate insights through compelling visuals. It is particularly effective when the reporting need is exploratory rather than procedural.
For example, if analysts are continuously drilling into customer segments, campaign performance, supply chain patterns, or regional sales drivers, Tableau offers a fluid and visually rich experience.
The trade-off is similar to Power BI, but often even more pronounced for document-style reporting. Teams that need dense operational tables, repeated standardized templates, or formal reports delivered at scale may find Tableau less aligned with those needs.
Zoho Analytics
One-sentence overview: Zoho Analytics is a cloud-based reporting and BI platform that emphasizes accessibility, convenience, and value for growing teams.
Key Features:
Cloud-native reporting environment
Built-in connectors to many business apps and databases
Dashboard and report creation
Collaboration and sharing options
White-label and embedded reporting support
Pros & Cons:
Pros: Easy to adopt, relatively budget-friendly, useful connector ecosystem, practical for smaller and mid-sized teams
Cons: Less suited to highly customized enterprise reporting, may be limiting for very complex layout and governance needs
Best For: SMBs, growing teams, service providers needing accessible cloud reporting, and companies with moderate reporting complexity
Zoho Analytics is attractive because it lowers the barrier to entry. Teams that want an online reporting solution without a major enterprise rollout can often get started quickly. It offers solid reporting and dashboard capabilities, especially for organizations that value simplicity and cloud convenience.
It can also work well for embedded or client-facing scenarios where cost and speed matter. Still, for deeply customized, enterprise-grade operational reporting, Zoho Analytics may not provide the same level of report design flexibility or process control as FineReport.
Which tool is best for different reporting scenarios?
Best choice for enterprise operational reporting
For enterprise operational reporting, FineReport is generally the strongest choice.
Why:
It is better aligned with structured, repeatable, high-volume reporting
It supports pixel-perfect and document-style outputs
It fits workflows where reports are generated on a schedule and distributed to many users
It performs well in environments such as finance, manufacturing, logistics, and formal management reporting
Power BI and Tableau can support operational reporting to a degree, but they are usually stronger when dashboards and interactive analysis are the main output. Zoho Analytics is practical for lighter operational needs, but less compelling for deeply customized enterprise processes.
Best choice for self-service analytics and dashboards
Choose Power BI if your organization wants strong Microsoft integration, semantic modeling, and broad business adoption.
Choose Tableau if your analyst teams prioritize advanced visual exploration and storytelling.
FineReport includes dashboard capabilities, but its main advantage remains formal reporting. Zoho Analytics can support self-service needs for smaller teams, though it may not match the depth of Power BI or Tableau in more mature BI environments.
Best choice for client-facing and external reporting
For client-facing and external reporting, the best option depends on the nature of the deliverable.
Choose FineReport if clients need formal, branded, repeatable reports with scheduled delivery and strong layout control.
Choose Zoho Analytics if you need accessible cloud sharing, embedded analytics, or white-label reporting for simpler use cases.
Choose Power BI or Tableau if clients are expected to interact with dashboards rather than receive document-style reports.
This distinction matters. External reporting can mean either an executive dashboard portal or a recurring client report pack. Those are different needs, and the best tool changes accordingly.
Suitable when simplicity is more important than deep customization
Final verdict: how to choose the right platform for complex reporting
The right choice among these online reporting tools depends on what “reporting” means inside your organization.
If your reporting environment is defined by:
strict layouts
recurring operational documents
finance or manufacturing report packs
parameterized templates
scheduled distribution
centralized governance
then FineReport is the strongest option in this comparison. It is the best fit when reporting is a formal business process, not just a dashboard layer.
If your reporting environment is defined more by:
interactive dashboards
self-service analysis
broad business-user exploration
semantic modeling
visual KPI tracking
then Power BI is often the best all-around choice, especially in Microsoft-centric enterprises.
For many businesses, this framework quickly narrows the field:
Choose FineReport for complex operational and formatted reporting
Choose Power BI for broad self-service BI and Microsoft alignment
Choose Tableau for advanced visual analytics and storytelling
Choose Zoho Analytics for accessible cloud reporting with moderate complexity
The smartest buying mindset is not to ask which tool is “best” in general. It is to ask which platform best matches your report formats, user roles, data environment, and growth plans. For organizations with demanding reporting workflows, FineReport should be on the shortlist early, especially when polished operational reporting is the priority.
FAQs
FineReport is generally the strongest fit when you need highly formatted, multi-page, print-ready reports such as financial statements, invoices, or operational documents. Power BI, Tableau, and Zoho Analytics are usually stronger for dashboards than for strict document-style reporting.
Power BI and Tableau are typically the strongest choices for interactive analysis, drill-downs, and visual exploration. Zoho Analytics also supports dashboards well, especially for smaller teams that want a simpler cloud setup.
Focus on data connectivity, report layout flexibility, scheduling, permissions, governance, and scalability. If your reports must combine multiple systems and follow fixed templates, design control matters as much as visualization quality.
For operational reporting with recurring templates, batch generation, and formal distribution, FineReport is often a better fit. Power BI is usually the better option when self-service analytics and Microsoft ecosystem integration are the main priorities.
Zoho Analytics is often the easiest starting point for small or growing teams because it is cloud-based, relatively simple to set up, and budget-friendly. It works best when reporting needs are less dependent on highly complex formatted outputs.
Product Trial
FineReport
Pixel-perfect reports · Interactive dashboards · Easy data entry · Digital twins