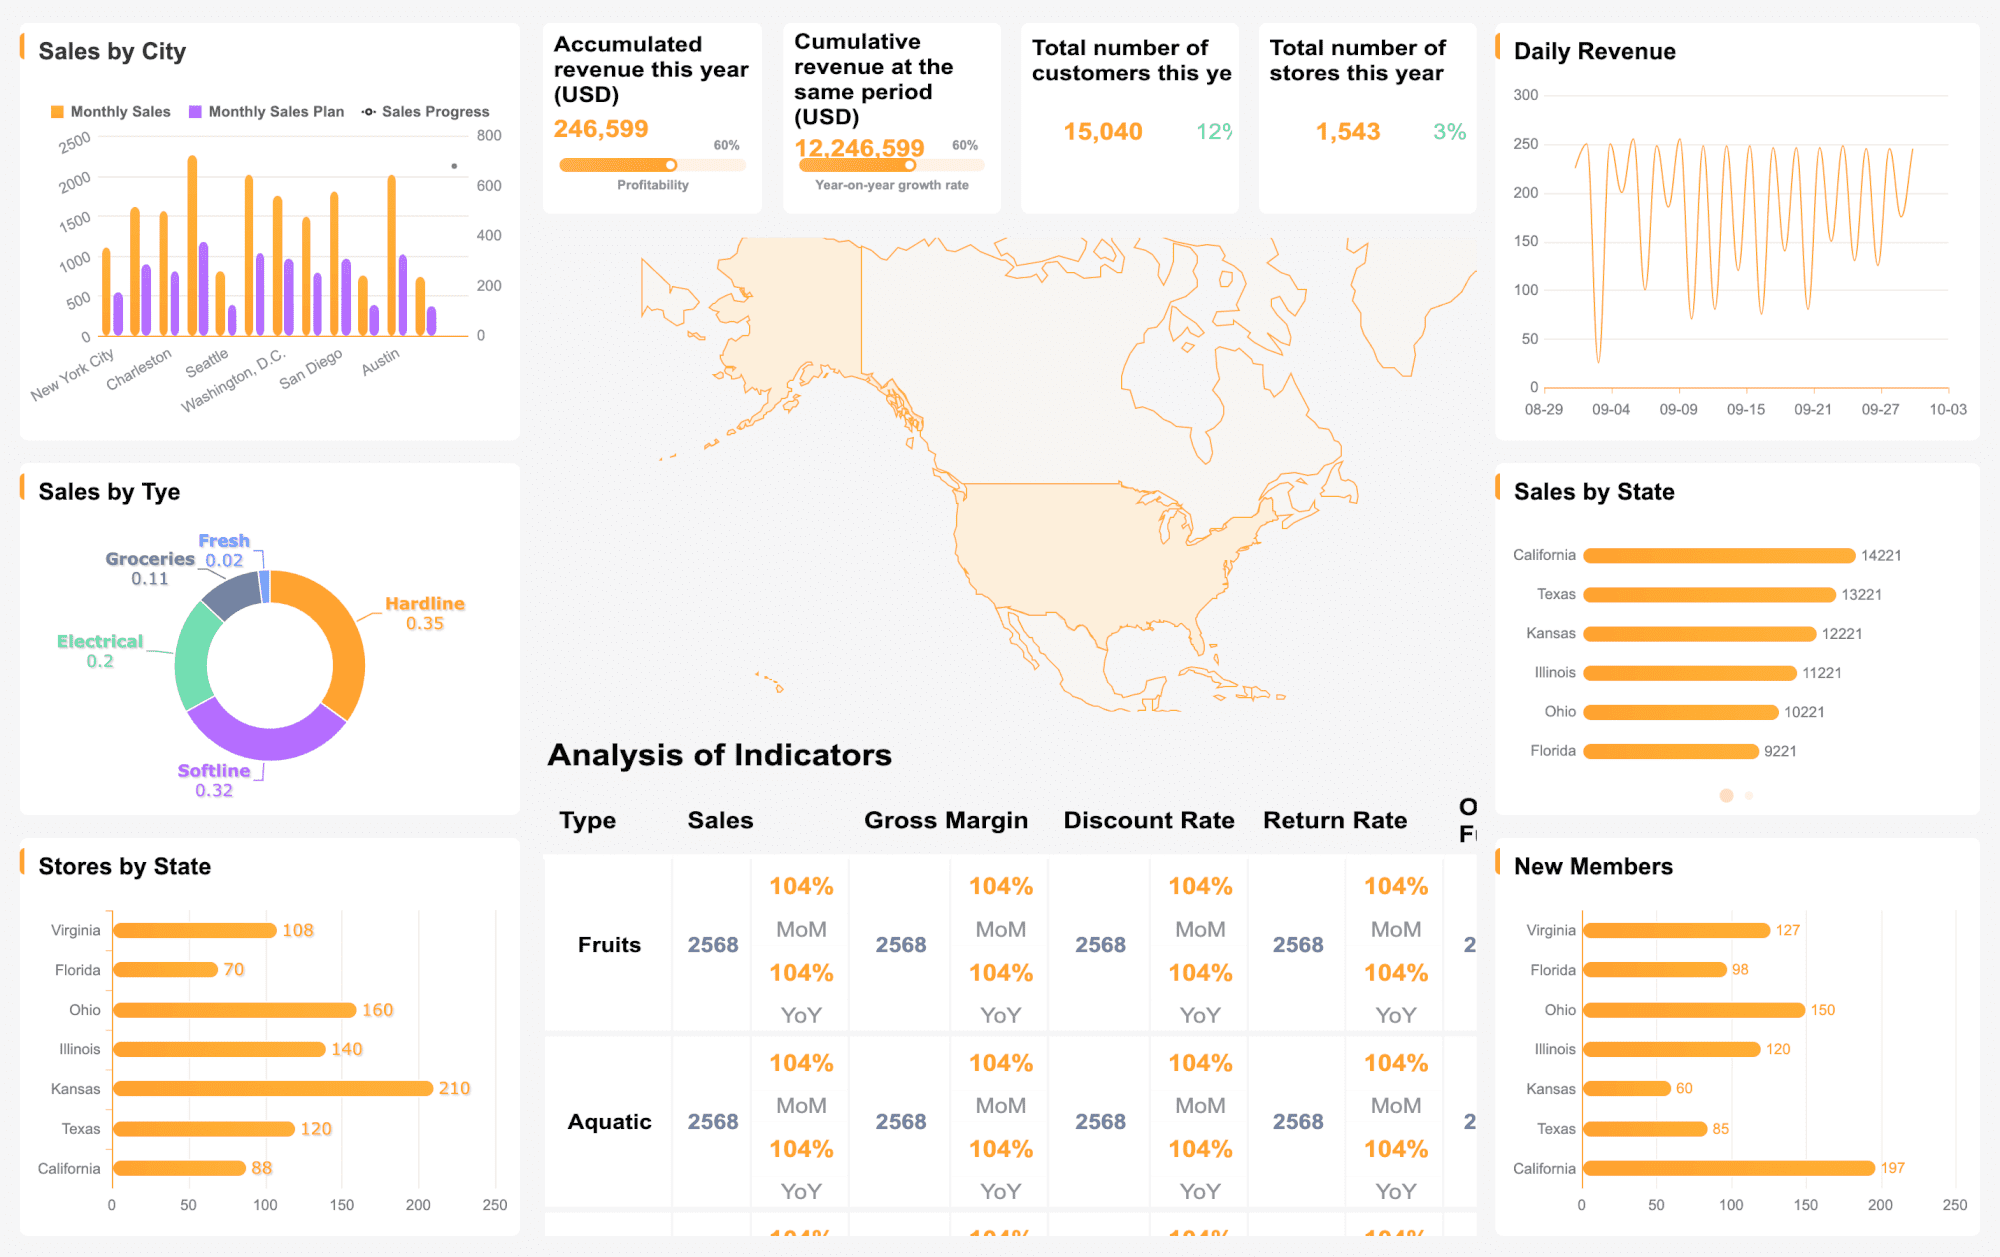
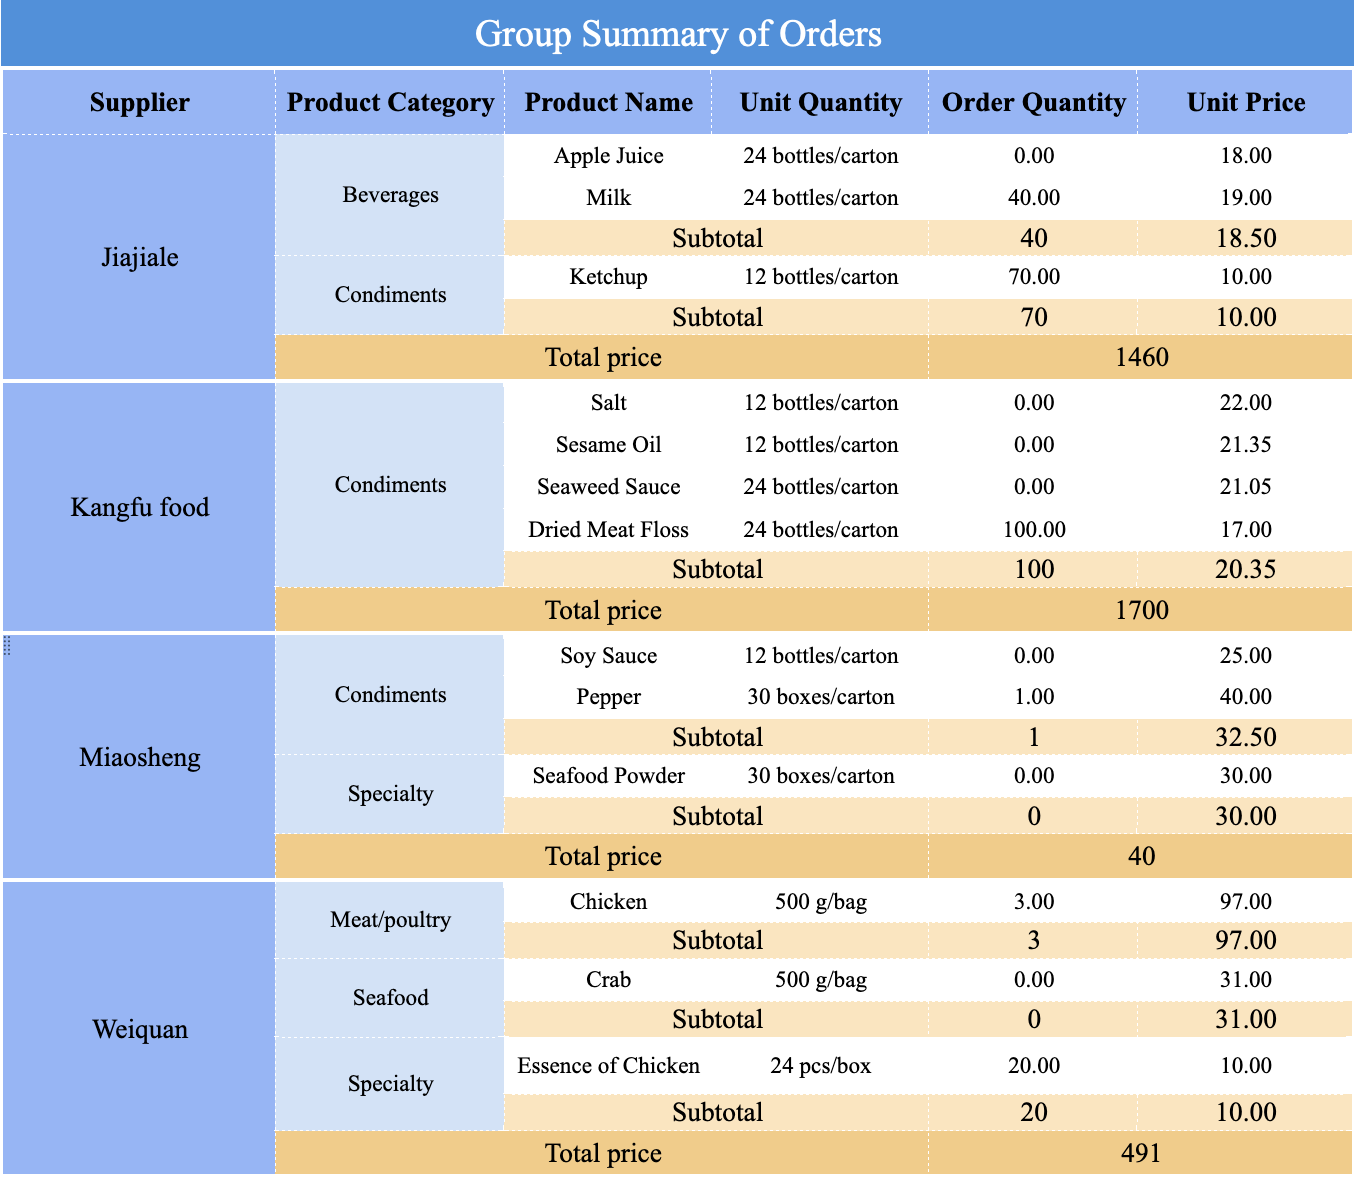
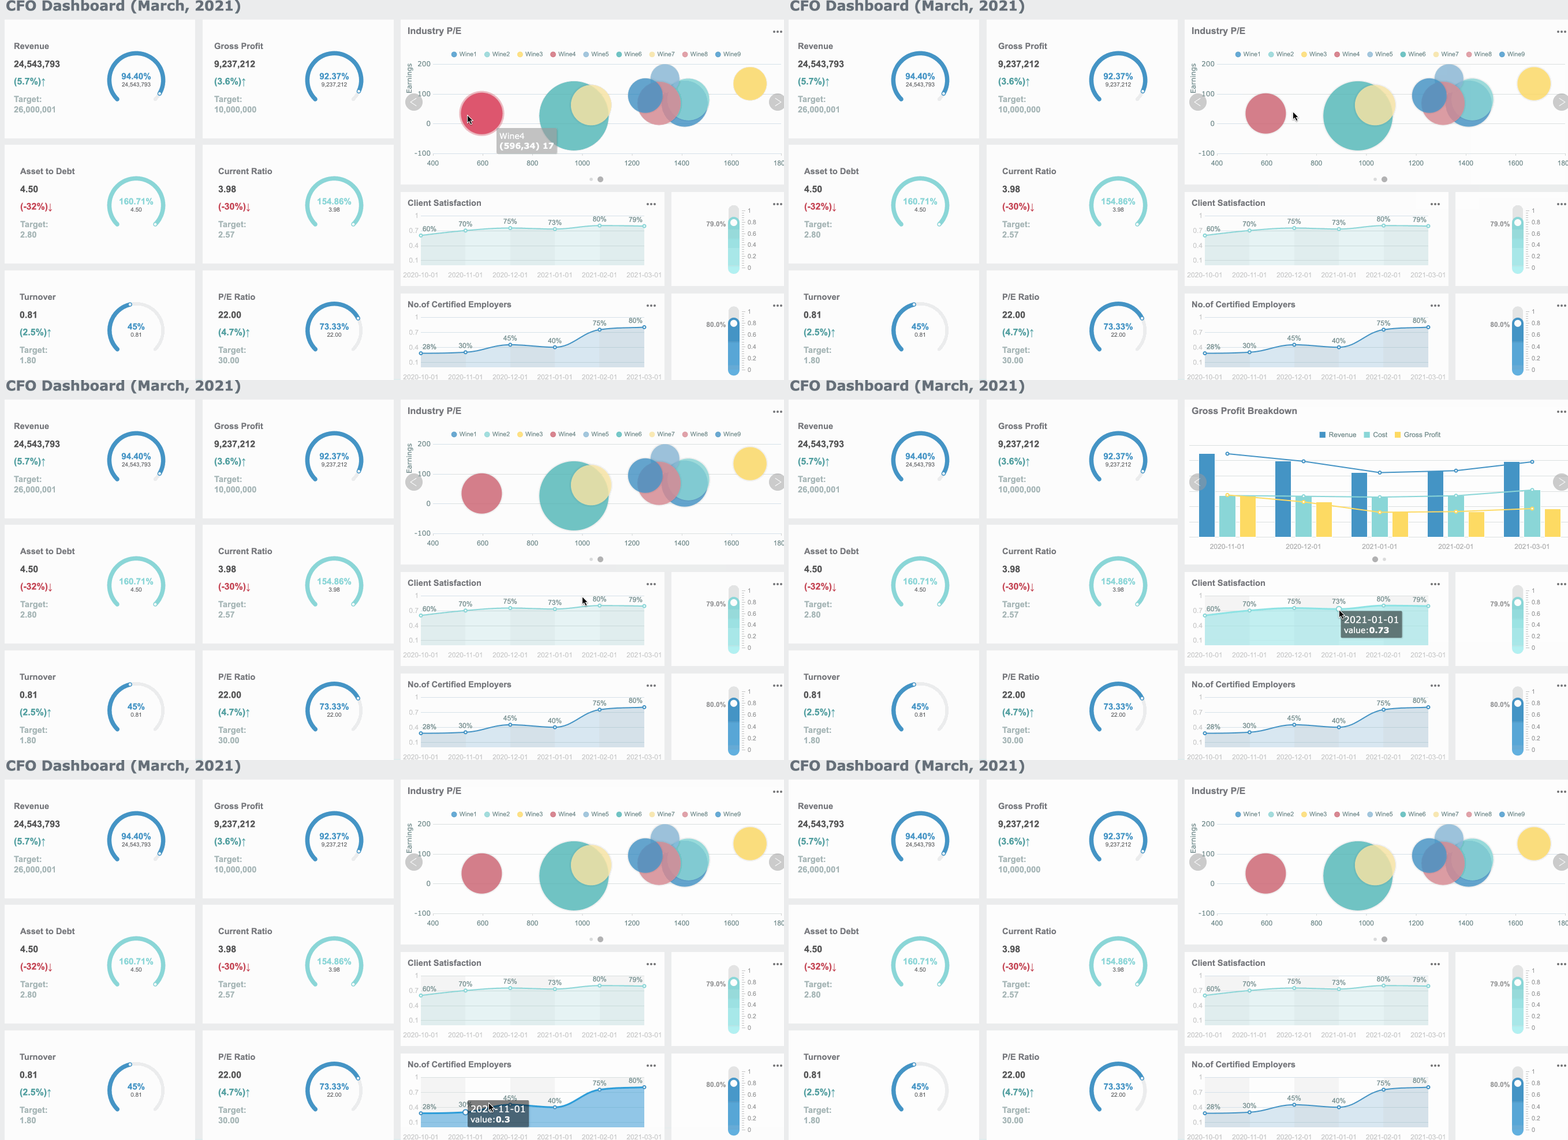
A marketing monthly report should do one job exceptionally well: help executives understand what happened, why it happened, and what decisions should be made next. For CMOs, marketing directors, operations leaders, and finance stakeholders, the problem is rarely a lack of data. It is a lack of clarity. Too many reports are bloated with channel-level screenshots, conflicting definitions, and vanity metrics that do not connect to pipeline, revenue, efficiency, or risk. A strong monthly reporting template fixes that by turning marketing performance into a decision system.
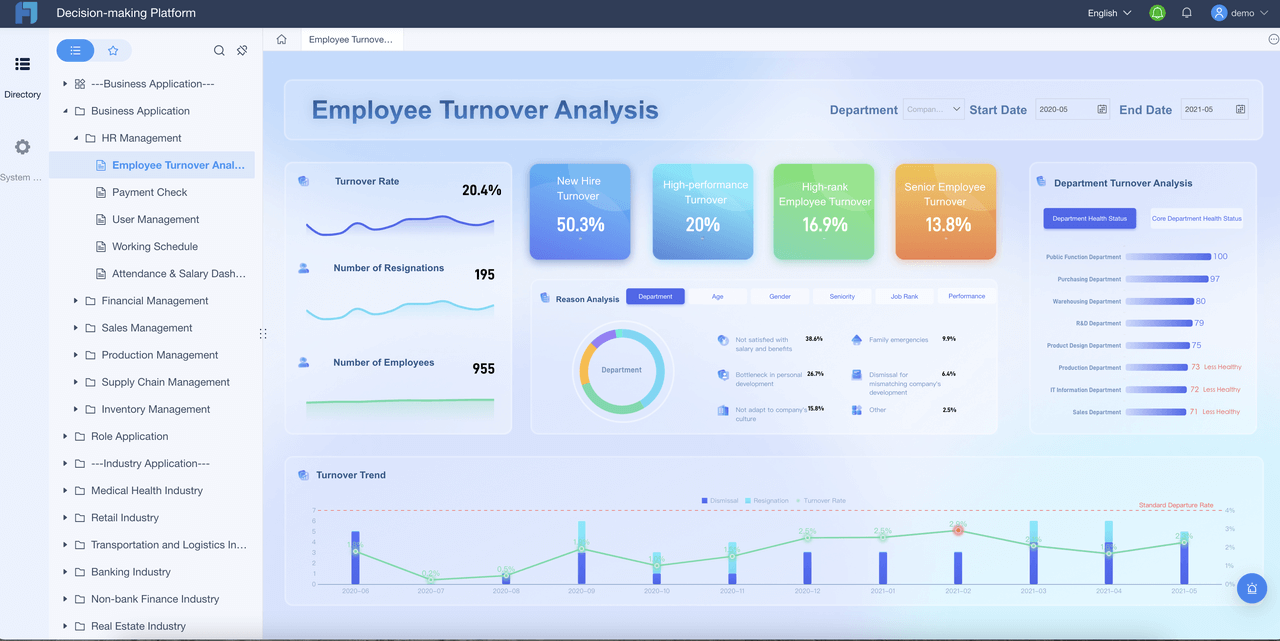
All reports in this article are built with FineReport
What a marketing monthly report should accomplish for executives
An executive-ready marketing monthly report is not a recap of everything the team did. It is a focused business review. It should show performance against goals, explain meaningful changes, and recommend the next actions with clear ownership.
Executives typically care about four things:
Business impact: How marketing influenced pipeline, revenue, qualified demand, retention, or expansion
Efficiency: Whether spend and resources are producing acceptable returns
Risks: Where performance is off track, where conversion is weakening, or where dependencies threaten results
Opportunities: Which channels, campaigns, audiences, or offers deserve more investment
A good report also sets expectations around cadence and audience. Monthly is the right rhythm for most leadership teams because it balances signal and noise. It is frequent enough to catch trends and issues, but not so frequent that teams overreact to short-term fluctuations.
An executive-ready report is different from a channel-by-channel data dump in three ways:
It starts with outcomes, not activities
It provides interpretation, not just screenshots
It ends with decisions, not open questions
If your current report cannot help a leadership team decide what to scale, fix, pause, or test next month, it is not doing its job.
Core KPIs to include in a marketing monthly report
The best KPI set starts with business outcomes. Everything else should support those outcomes. That means leading with revenue contribution, pipeline generation, lead quality, and conversion performance before drilling into channel metrics.
Marketing-sourced pipeline: Total pipeline value created directly from marketing efforts
Marketing-influenced revenue: Revenue where marketing played a measurable role in the journey
Qualified leads: Leads that meet agreed qualification criteria, such as MQLs or high-fit inbound leads
Lead-to-opportunity conversion rate: Share of leads that progress into real sales opportunities
Opportunity-to-customer conversion rate: Share of opportunities that become closed business
Customer acquisition cost (CAC): Total marketing and sales acquisition cost divided by new customers acquired
Cost per lead (CPL): Total spend divided by total leads generated
Return on ad spend (ROAS): Revenue attributed to advertising divided by ad spend
Budget pacing: Actual spend versus planned budget within the reporting period
Website conversion rate: Percentage of site visitors who complete a desired action
Pipeline velocity: Speed at which qualified demand moves through the funnel
Retention or repeat purchase rate: Ongoing value from existing customers, especially for lifecycle or ecommerce teams
For interpretation, always include comparison views:
Month over month
Quarter to date
Year over year
This prevents overreaction to normal seasonality and gives executives context on momentum.
Another best practice is separating leading indicators from lagging indicators.
Leading indicators predict future performance, such as traffic quality, demo requests, content engagement, click-through rate, or trial starts
Lagging indicators confirm outcomes, such as closed revenue, CAC, or customer growth
This distinction matters because many marketing actions create impact on a delay. If lagging results are flat but leading indicators are improving, the right executive response may be patience, not panic.
How to choose the right KPIs by business goal
Your marketing monthly report should not use the same KPI mix for every company. The right metrics depend on the business objective.
Executives still need business context, so tie awareness to future demand signals wherever possible.
Demand generation goals
If the goal is pipeline growth, focus on:
Marketing-sourced pipeline
MQL volume
Lead quality score
Cost per qualified lead
Demo or trial conversions
Funnel conversion rates
CAC and ROAS
This is the most common setup for B2B and performance-driven teams.
Retention and lifecycle goals
For retention-led teams, prioritize:
Renewal rate
Expansion revenue
Repeat purchase rate
Customer engagement
Email conversion rate
Churn risk indicators
Customer lifetime value trends
This view matters when marketing influences post-sale growth, loyalty, or retention programs.
Executive summary metrics versus team-level diagnostics
A common mistake is mixing executive metrics with operational diagnostics on the same page.
Use executive summary metrics for:
Revenue impact
Pipeline
Conversion performance
Efficiency
Risk status
Top recommendations
Use team-level diagnostics for:
Campaign-level click-through rates
Creative variations
Landing page tests
Audience segment detail
Keyword or placement breakdowns
Executives need the first set to make decisions. Teams need the second set to execute improvements.
The 11 components of an executive-ready monthly report
A reliable monthly template should include the same core structure every month. This reduces confusion, improves comparability, and makes reporting faster.
1. Executive summary with the top takeaway in plain language
Open with the clearest business conclusion from the month. One or two sentences are enough if they are specific.
Example:
Pipeline exceeded target by 14% due to strong paid search conversion and improved webinar-to-demo performance, but CAC rose above threshold because LinkedIn costs spiked.
This is what busy executives will remember.
2. Goals and benchmarks for context
Raw performance means little without targets. Show:
Monthly goals
Quarterly goals
Historical benchmarks
Thresholds for acceptable efficiency
This gives the report a frame of reference.
3. KPI snapshot and trend highlights
Include a compact scorecard with the core KPIs, current value, target, and trend direction. A red-yellow-green indicator system can help, but only if threshold definitions are consistent.
4. Channel or campaign performance summary
Summarize which channels or campaigns materially influenced outcomes. Keep it high level. Do not turn this section into a platform export.
Focus on:
What performed best
What underperformed
Where spend shifted
Which changes had measurable impact
5. Insights on what drove wins, losses, and anomalies
This is where the report becomes valuable. Explain the cause, not just the result.
Examples:
Conversion rate improved because landing pages were simplified
CPL rose because competition increased in branded search
Pipeline dipped because webinar volume fell after reducing promotion spend
6. Budget spend and efficiency review
Executives want to know whether spending is under control and productive. Include:
Actual spend vs planned budget
Spend by major channel
CAC, CPL, ROAS, or MER where relevant
Areas of overspend or underspend
7. Audience, funnel, or segment insights
Performance often changes by audience, geography, product line, or stage in the funnel. This section helps explain hidden shifts.
Examples:
Enterprise leads converted better than SMB leads
Returning visitors produced lower CAC than new visitors
E-commerce repeat buyers carried margin while new-customer acquisition weakened
8. Experiments, tests, and learnings
This is critical for showing marketing maturity. Report not only what happened, but what was learned.
Include:
Tests launched
Hypothesis
Result
What changes next based on the evidence
9. Risks, blockers, and dependencies
Strong executive reporting surfaces issues early. Do not hide them.
Common examples:
Tracking gaps affecting attribution confidence
Landing page backlog delaying tests
CRM sync issues impacting lead status accuracy
Sales follow-up lag reducing downstream conversion
10. Recommended next-step decisions
Turn analysis into actions. Every recommendation should include:
The action
The reason
The owner
The expected outcome
The timeframe
11. Appendix or dashboard links for supporting detail
Keep detail available without cluttering the main report. Link to live dashboards, deeper tabs, or supporting analysis for managers who want to investigate further.
How to build the report template so it is easy to update every month
The most effective marketing monthly report is not just well designed. It is operationally sustainable. If the team must rebuild it from scratch each month, reporting quality will decline and trust will erode.
Use a repeatable structure with fixed section order, shared KPI definitions, and documented data sources. Once the template logic is stable, teams can spend more time on analysis and less time on formatting.
Here are the consultant-grade best practices I recommend.
1. Lock the structure before the data changes
Decide the section order once and keep it stable. Executive summary, KPI snapshot, insights, budget review, risks, and recommendations should appear in the same sequence every month.
Why it matters:
Executives learn where to find information quickly
Teams reduce preparation time
Trend comparisons become cleaner
2. Standardize definitions, date ranges, and attribution rules
Many reporting disputes are actually definition disputes. Agree upfront on:
What counts as a qualified lead
Which attribution model is being used
Whether budget includes agency fees or only media spend
Which calendar logic applies: month-end, fiscal month, or rolling period
Without this, your report may be visually clean but analytically unreliable.
3. Design for commentary, not just charts
A report full of screenshots is not an executive report. Every major section should have space for short narrative commentary:
What changed
Why it changed
What decision follows
This is where reporting shifts from passive documentation to business guidance.
4. Keep the first page decision-oriented
The first page should answer three questions immediately:
Are we on track?
What changed materially?
What should leadership approve or prioritize next?
Move supporting evidence to later pages or linked dashboards.
5. Automate data collection wherever possible
Manual copying from ad platforms, CRM tools, spreadsheets, and web analytics creates delays and errors. Centralized reporting improves speed, consistency, and confidence.
After you have a stable template and governance rules, automate the refresh process and focus human effort on interpretation.
Recommended layout for a one-page executive summary
A one-page summary is often the most important page in the entire marketing monthly report.
A high-performing layout includes:
Headline result
A single plain-language sentence explaining overall performance.
KPI scorecard
Show the handful of metrics that leadership truly cares about:
Pipeline
Revenue influence
CAC
ROAS
Conversion rate
Budget pacing
Key drivers behind performance
List the top two to four reasons results changed.
Decisions, actions, and owners for next month
Close with the specific actions leadership should support and who owns each one.
Common mistakes that make reports hard to use
Even well-intentioned teams often undermine the report with avoidable errors.
Too many metrics without business context
More metrics do not equal more insight. If a metric does not support a decision, it likely does not belong in the executive version.
Inconsistent definitions across teams or tools
If finance, sales, and marketing define pipeline or CAC differently, the report becomes a debate document instead of a decision document.
Reporting activity instead of outcomes
Executives do not need a list of campaigns launched unless that activity connects to measurable impact.
No clear recommendation or owner attached to the findings
A report without recommended actions creates drift. Always connect insights to action.
Monthly marketing report examples and templates to model
Different organizations need different reporting formats, but the underlying logic should remain consistent: summarize outcomes, explain drivers, and guide decisions.
Can require more manual preparation if not automated
When is a simple template enough? If the business has a small channel mix, clear goals, and limited stakeholder needs, a concise summary plus dashboard may be sufficient.
When is a more analytical format needed? If you are dealing with multiple funnels, products, regions, sales handoffs, or attribution complexity, the report should provide more segmented analysis and explanatory depth.
You can also adapt the same reporting framework across different business models:
Startups: Focus on growth efficiency, CAC, and lead velocity
Agencies: Balance executive summary with client transparency and channel accountability
B2B teams: Emphasize lead quality, sales progression, and pipeline contribution
Fix: Improve landing page conversion on underperforming webinar campaigns before increasing traffic
Pause: Reduce spend on channels with sustained poor CPL and weak downstream conversion
Test: Launch a retention email experiment for high-value dormant customers over the next 30 days
Close every monthly report with the three decisions executives should make after reading it. This sharpens alignment and prevents the report from becoming passive documentation.
Building this manually is complex—use FineReport to automate the workflow
Building this manually is complex; use FineReport to utilize ready-made templates and automate this entire workflow.
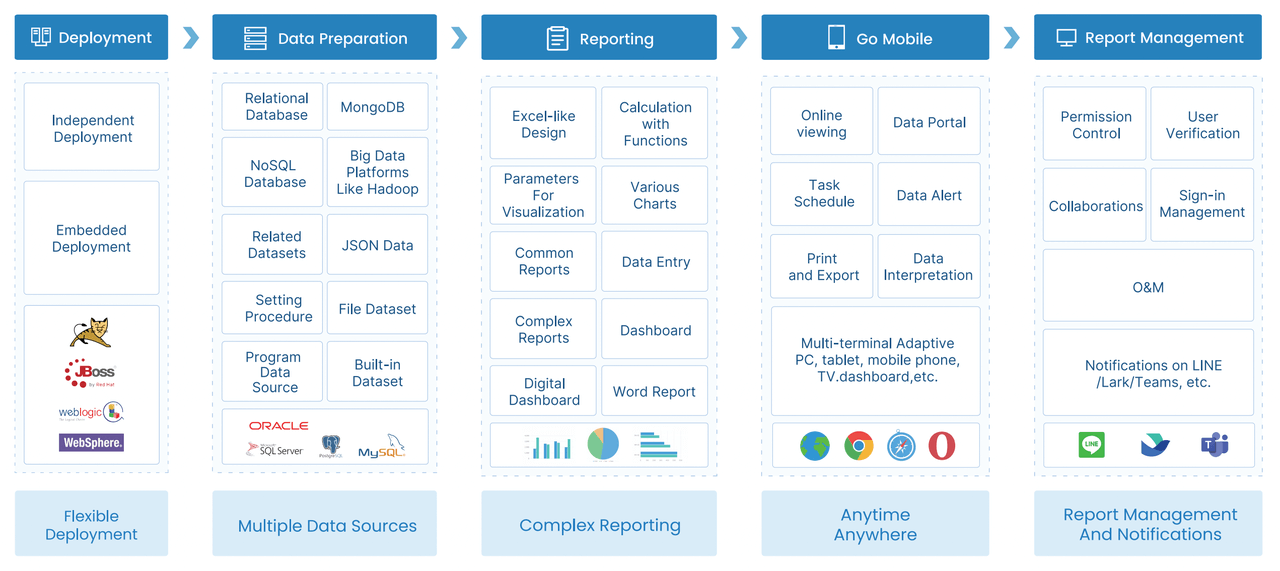
FineReport helps teams centralize marketing data, standardize KPI logic, and build executive-ready monthly reports without relying on fragile spreadsheets and repetitive slide updates. Instead of spending days collecting data from ad platforms, CRM systems, web analytics, and internal files, teams can create a reusable reporting framework that updates faster and supports better decisions.
Provide both high-level snapshots and drill-down detail for stakeholders
Get Ready-to-Use Dashboard Templates in Fine Gallery
For enterprise teams, the value is not just speed. It is consistency, governance, and trust. When the report structure, KPI definitions, and refresh process are controlled, leadership can spend less time questioning the numbers and more time making decisions.
A high-performing marketing monthly report should help executives understand business impact, efficiency, risk, and the next priority moves. If your current reporting process is manual, fragmented, or difficult to interpret, that is a process problem, not just a presentation problem. Solve it with a repeatable executive-focused framework and automate the delivery where possible.
An executive-ready marketing monthly report should highlight business outcomes, efficiency, major risks, and recommended next steps. It should focus on a small set of KPIs tied to pipeline, revenue, conversion performance, and budget use rather than channel-by-channel activity.
The most important KPIs usually include marketing-sourced pipeline, marketing-influenced revenue, qualified leads, conversion rates, CAC, CPL, ROAS, and budget pacing. The exact mix should match the company’s main goal, such as awareness, demand generation, or retention.
Monthly reporting is the best cadence for most leadership teams because it provides enough data to spot trends without creating noise. It gives executives time to evaluate progress, understand changes, and make better decisions for the next month.
A dashboard shows current performance in near real time, while a marketing report explains what happened over a set period and what to do next. Reports add context, interpretation, and recommendations that executives need for decision-making.
Start with outcomes instead of activities, explain why performance changed, and end with specific decisions or actions. Using consistent definitions, period-over-period comparisons, and clear ownership also makes the report easier to act on.
Product Trial
FineReport
Pixel-perfect reports · Interactive dashboards · Easy data entry · Digital twins