A management dashboard gives you a clear view of your business data in one place. You can track key performance indicators, spot trends, and make fast decisions. Managers rely on dashboards because they eliminate manual reporting and show real-time insights. The table below shows how a management dashboard can improve efficiency, profitability, and decision-making:
Impact Area
Description
Efficiency
Real-time insights help you monitor and improve operations quickly.
Profitability
Financial data analysis leads to better choices and higher profits.
Decision-Making
Dashboards consolidate complex data for faster, more confident decisions.
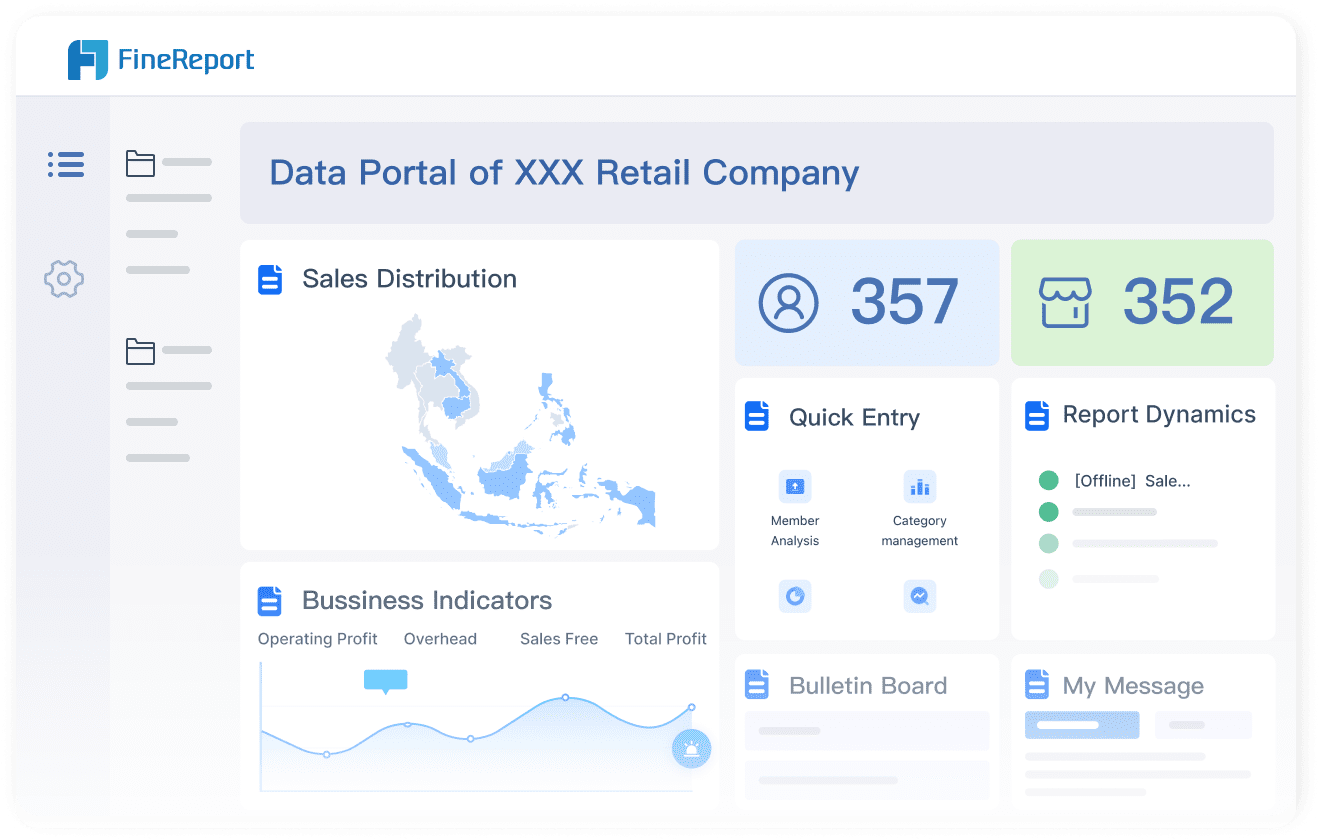
FineReport serves as a practical example to show how a dashboard works in real business scenarios.
What Is a Management Dashboard
Definition and Purpose
A management dashboard is a digital tool that brings your most important business data together in one place. You can use it to see real-time updates, track progress, and measure results. This tool helps you focus on what matters most by showing key performance indicators, trends, and alerts. You do not need to search through spreadsheets or reports. Everything you need appears on your screen.
The main purpose of a management dashboard is to support data-driven decision-making. You can monitor performance, spot problems early, and take action quickly. This tool helps you reach your goals and follow best practices. Many organizations use dashboards to guide their strategies and improve results. For example, FineReport gives you a flexible way to create dashboards that fit your business needs. You can design a project management dashboard to track tasks, deadlines, and team performance. This makes it easier to manage projects and keep everyone on the same page.
Tip: A dashboard can show charts, tables, and maps. You can customize it to display the information that matters most to you.
Who Uses Management Dashboards
You will find management dashboards in many types of organizations. Business leaders, department managers, and team supervisors use them every day. If you work in finance, you might use a dashboard to monitor budgets and spending. In manufacturing, you can track production quality and equipment efficiency. Project managers rely on dashboards to keep projects on track and share updates with their teams.
Dashboards are not just for executives. Anyone who needs to make decisions based on data can benefit. For instance, FineReport lets you build dashboards for sales, HR, or operations. These tools help you stay informed and respond to changes quickly. You can find many examples of dashboards in action, from tracking sales performance to monitoring customer satisfaction.
A management dashboard gives you the tools to see your business clearly. You can track key metrics, respond to changes, and make better decisions. Let’s look at the key features that make a data dashboard powerful for any organization.
Real-Time Data Visualization
You need real-time insights to stay ahead. A dashboard shows you live data from many sources, such as machine sensors or user actions. This helps you react quickly to changes. You can filter, aggregate, and enrich your data to get the most accurate view.
FineReport lets you connect to any data source and see updates instantly. You can use dynamic charts, graphs, and tables to turn complex information into clear visualizations. The drag-and-drop dashboard design makes it easy to build views that fit your needs.
Feature
Description
Dynamic Data Integration
Connects to many data sources for real-time updates.
Visual Representation
Turns complex data into easy-to-read charts and graphs.
Interactivity
Lets you click and explore data for deeper understanding.
You can use these tools to monitor key metrics and spot trends as they happen. This supports fast, confident decision-making.
Tip: Real-time dashboards help you avoid delays and keep your team focused on what matters most.
Customizable Metrics and KPIs
Every business tracks different key performance indicators. You need a dashboard that lets you choose which key metrics to follow. FineReport gives you the power to customize your dashboard for any department—finance, sales, HR, or operations.
You can set up a project management dashboard to track tasks, deadlines, and team progress. This flexibility means you always see the key metrics that matter most to your goals.
Data Integration and Connectivity
A strong management dashboard connects to all your data sources. You do not need to copy and paste data from different systems. FineReport supports many connection methods, so you can bring all your information together in one place.
Connection Method
Description
JDBC
Direct link to your database.
JNDI
Shares connections with your application server.
XMLA
Connects to multidimensional databases.
SAP
Links to SAP systems through JCO.
You can set up these connections in both the dashboard designer and the platform. This makes it easy to combine data from sales, finance, manufacturing, and more. With this integration, your dashboard always shows the latest key metrics.
Note: Application integration lets you automate data updates, saving time and reducing errors.
User-Friendly Interface
You want a dashboard that is easy to use. FineReport focuses on a clean, simple layout. You can find information quickly without feeling overwhelmed. The dashboard design uses clear visual hierarchy, so your eyes go straight to the most important key metrics.
FineReport also supports mobile access. You can check your dashboard on your phone or tablet, so you never miss an update. This user-friendly approach helps everyone in your organization use data dashboard examples with confidence.
Alerts and Notifications
You need to know when something important happens. A good management dashboard sends you alerts and notifications for key metrics. FineReport includes a Data Alert plugin that tracks your key performance indicators and sends timely warnings.
Feature
Purpose and Importance
Implementation and Impact
Proactive Notifications
Keeps you informed about critical changes or milestones.
Monitors trends and triggers alerts based on set criteria.
Automated Alerts
Prevents missed issues and supports quick action.
Alerts for sales drops, inventory shortages, and more.
Batch Sending Alerts
Notifies responsible staff about risks or missed targets.
Reduces the chance of not meeting goals.
Instant Risk Reminder
Turns reports into proactive notifications.
Improves information flow and response time.
You can receive alerts by email, SMS, or in-dashboard prompts. This helps you respond quickly to sales changes, missed deadlines, or shifts in team performance. With these features, you always stay on top of your business.
Tip: Set up alerts for your most important key metrics to make sure you never miss a critical update.
FineReport’s dashboards support business needs across industries. The flexible dashboard design, real-time insights, and strong integration make FineReport a top choice for organizations that want to make data-driven decisions.
You can choose from several types of management dashboards, each designed for a specific purpose. Understanding these types helps you select the right dashboard for your business needs.
Dashboard Type
Definition and Purpose
Key Features
Use Cases
Operational Dashboards
Monitor and manage day-to-day activities with real-time data.
Real-Time Monitoring, Detailed Metrics, Alerts and Notifications
Customer Support, Manufacturing, Logistics
Strategic Dashboards
Provide a top-level view of organizational performance against long-range goals.
Used for deep data analysis and exploratory purposes.
Data Exploration, Advanced Visualizations, Historical Analysis
Marketing, Sales, Finance
Operational Dashboards
You use operational dashboards to track daily activities and respond quickly to changes. These dashboards show real-time data, highlight exceptions, and help you manage resources. FineReport supports operational dashboards in manufacturing by providing a canvas-like interface, multi-dimensional analysis, and compatibility with many devices. For example, you can monitor production quality or equipment efficiency using FineReport’s quality control and OEE solutions. TXC Corporation improved its reporting speed and accuracy by using operational dashboards to monitor key business processes.
Tip: Operational dashboards help you spot issues early and take immediate action.
Strategic Dashboards
Strategic dashboards give you a high-level overview of your business health. You can track progress toward long-term goals and compare actual results with targets. These dashboards display KPIs like revenue, growth rate, and project performance. FineReport enables you to create strategic dashboards for executive teams, offering real-time data visualization and predictive insights. BOE used a strategic dashboard to unify metrics across departments, leading to better decision-making and increased efficiency.
Analytical dashboards help you explore data and find patterns. You can use them to analyze sales trends, customer behavior, or financial results. FineReport’s data dashboard examples let you drill down into details and uncover insights. Research shows that organizations using analytical dashboards are more productive and profitable. You can use these dashboards in marketing, sales, or finance to make evidence-based decisions.
Analytical dashboards support deep data exploration.
They provide advanced visualizations and historical analysis.
You can use them to improve productivity and profitability.
Industry-Specific Dashboards
You may need dashboards tailored to your industry. FineReport offers solutions for manufacturing, finance, and risk management. In manufacturing, you can track quality control and equipment efficiency. In finance, you can monitor budgets, expenses, and revenue. FineReport adapts to your unique data needs, supporting self-service reporting and integration with other tools. This flexibility ensures you get the right insights for your business.
Real-world examples: FineReport helped BOE and TXC Corporation transform their operations with customized dashboards. These companies now make faster, smarter decisions using data from across their organizations.
You can also create a project management dashboard to track tasks, deadlines, and team progress. This helps you keep projects on schedule and ensures everyone stays informed.
Best Practices for Effective Dashboard Use
Keep Dashboards Simple and Focused
You get the most value from a management dashboard when you keep it clear and focused. Before you build, set a specific goal. Decide which key metrics matter most for your business. Limit your dashboard to five or six KPIs. Too many numbers can overwhelm you and your team. Use clear titles and provide context for each metric. Simple visuals like bar charts or line graphs help you spot trends quickly. Avoid complex designs that slow down load times or make maintenance harder.
Focus on your main goals.
Deliver data that leads to actionable insights.
Use clear titles and branding.
Keep visuals simple and easy to understand.
Select only the most important KPIs.
FineReport makes it easy to design dashboards that highlight what matters. You can use drag-and-drop tools to create clean layouts and keep your data dashboard focused.
You need up-to-date information to make smart decisions. Set your dashboard to refresh data automatically. FineReport supports real-time updates from multiple sources, so you always see the latest numbers. Scheduled reporting and automated alerts keep you informed about important changes. This helps you respond quickly and stay ahead of problems.
Tip: Regular updates ensure your dashboard always reflects current business conditions.
Tailor Dashboards to User Needs
Different users need different information. You can create dashboards for executives, managers, or team members. Start by understanding what each group needs. Organize data logically and highlight key metrics for quick insights. Add filters or drill-down options so users can explore details at their own pace. FineReport lets you customize dashboards and manage permissions for each user role.
User Role
Visible Columns
Permissions
Sales Director
Sales Volume
Cannot view Sales Volume
Regular User (Alice)
Sales Volume
Can view Sales Volume
You can also access dashboards on your phone or tablet. FineReport’s mobile features help you stay connected wherever you are. For best results, gather feedback from users and refine your dashboards over time. Look at data dashboard examples to inspire your own designs and make sure your dashboards deliver actionable insights.
FineReport offers training and support resources to help you build and maintain effective dashboards for every user group.
A management dashboard gives you a clear view of your business, helping you track performance, spot issues early, and make smarter choices. You gain the power to customize data views, monitor KPIs, and drive continuous improvement. The table below shows how dashboards support your goals: