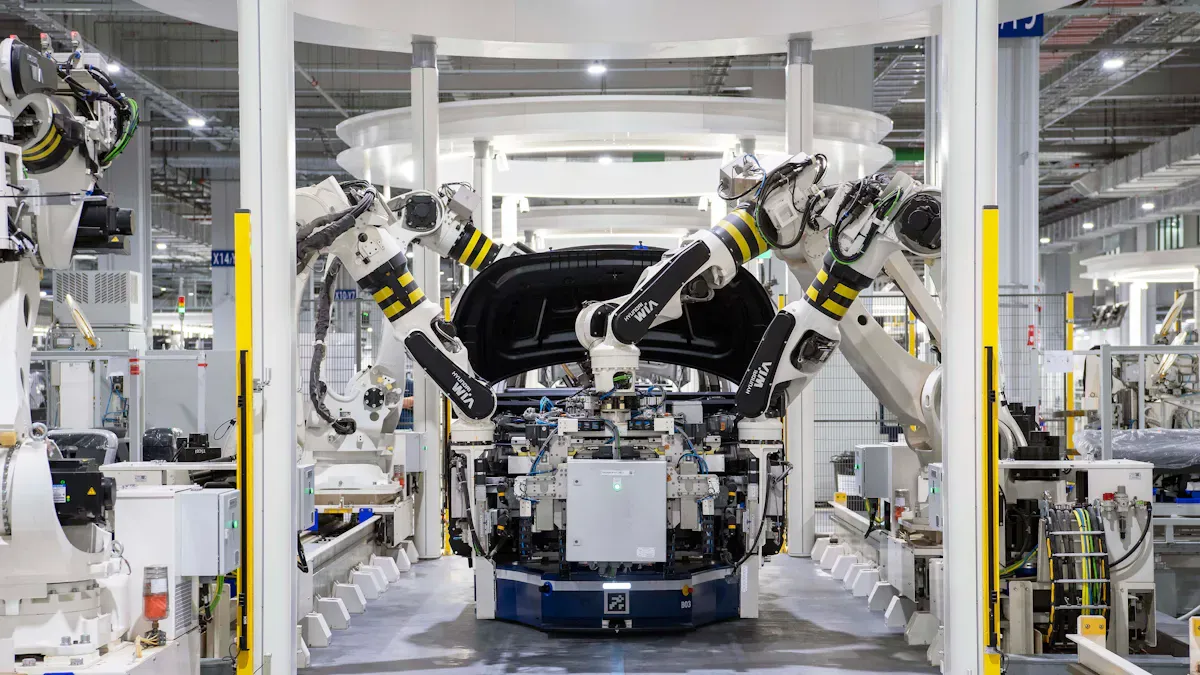
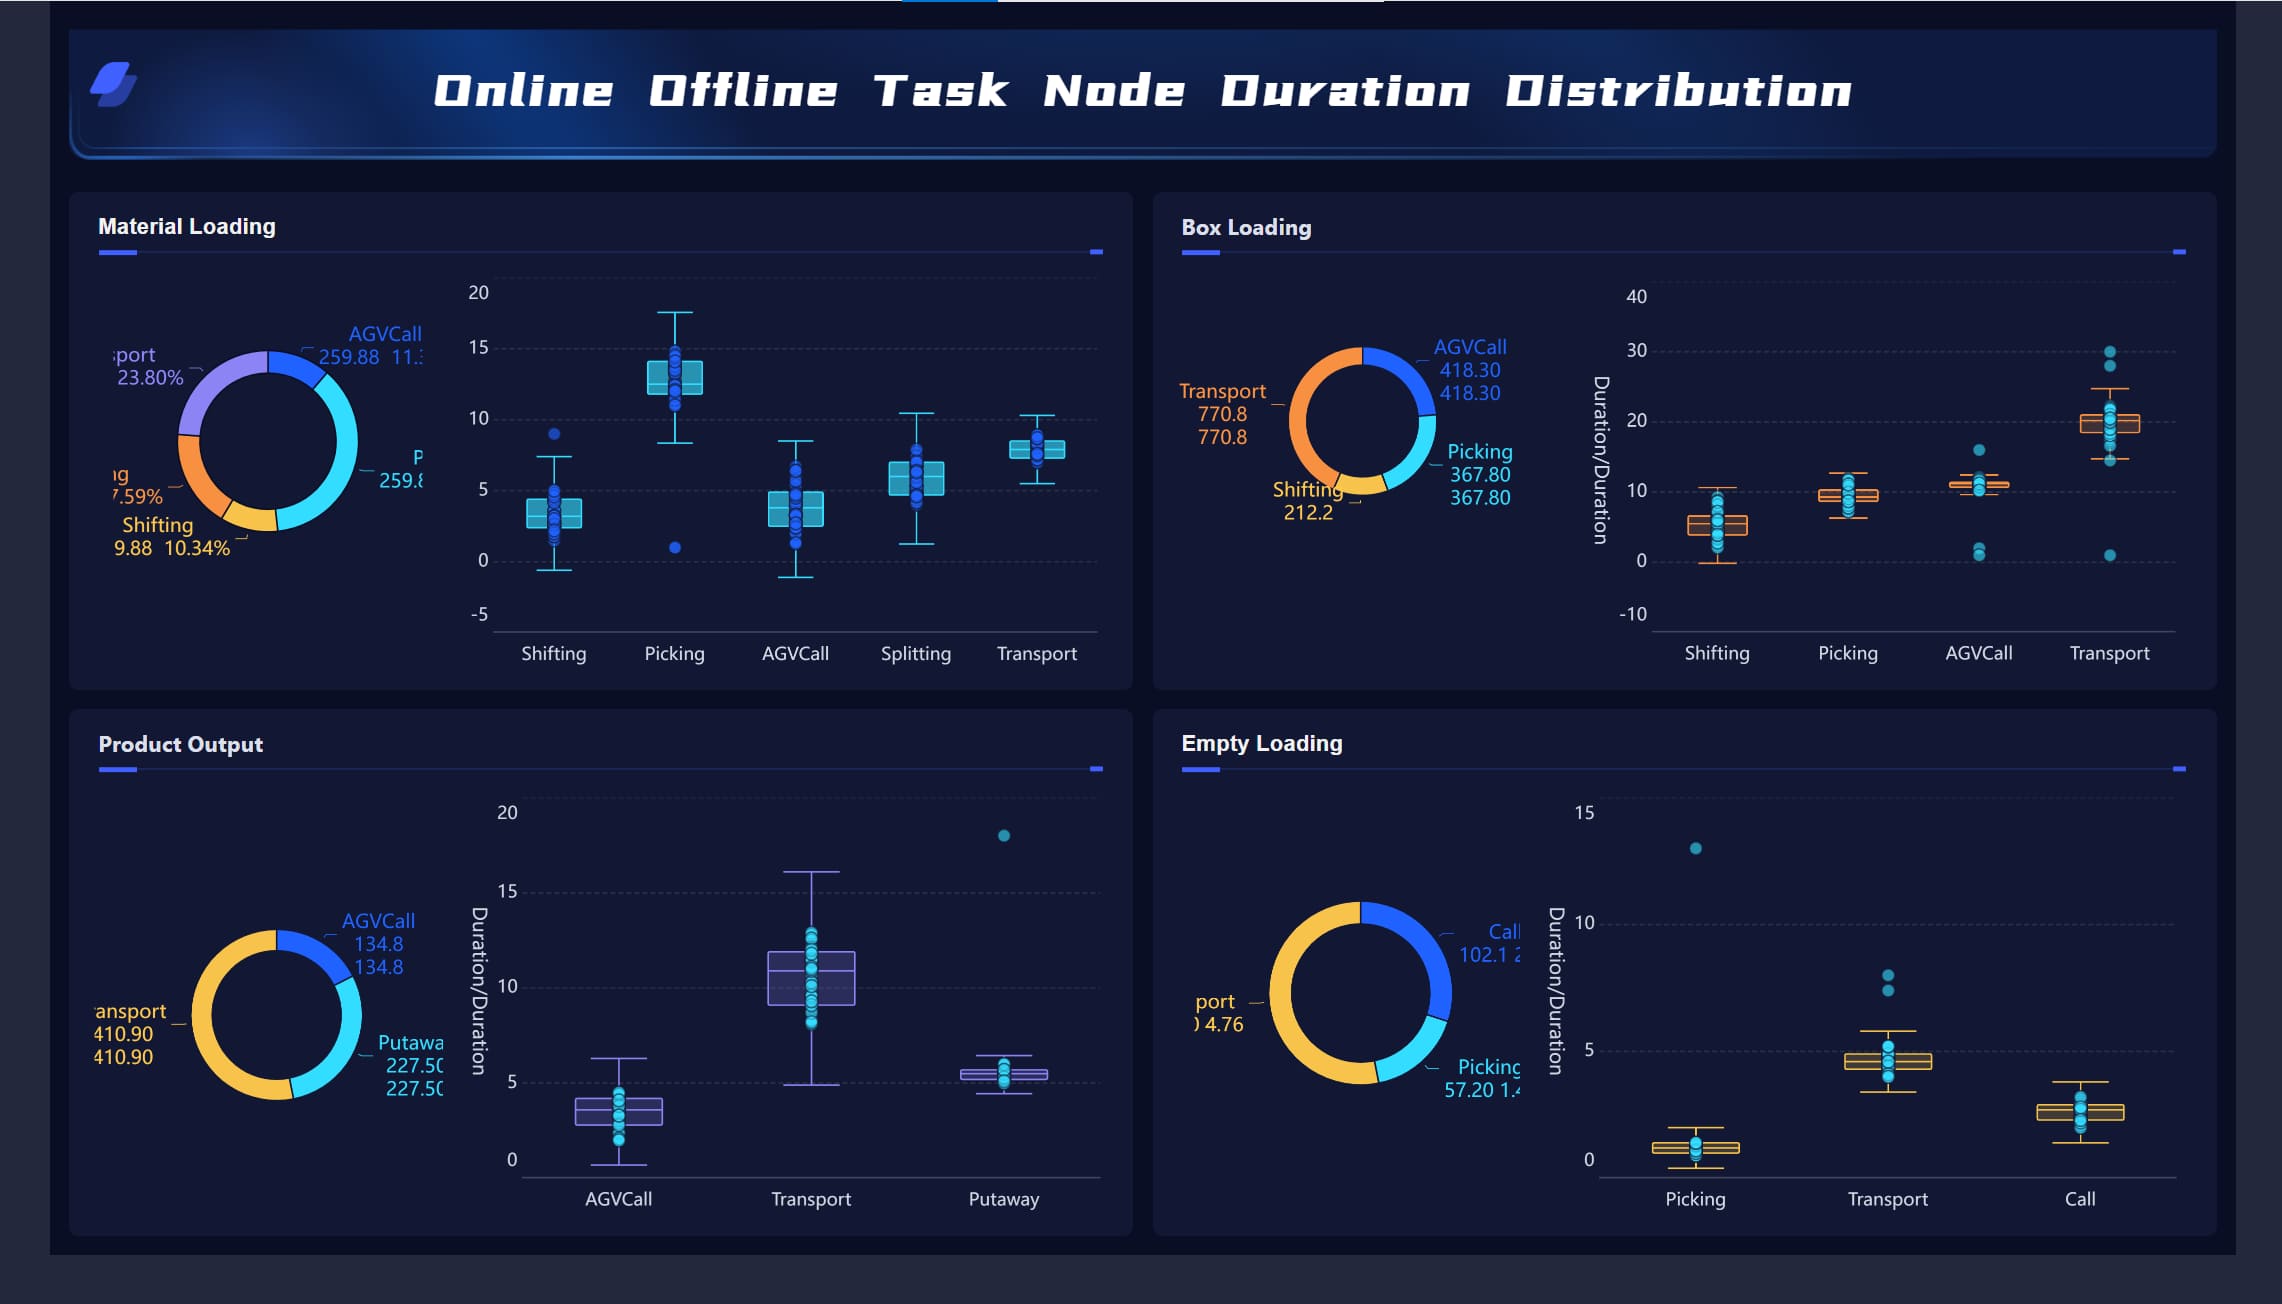
You can change your shop floor with a machine monitoring dashboard. Dashboards show you real-time data and helpful information. This helps you spot trends and act fast. Operators use dashboards to find process changes and get alerts. This makes production better and cuts down on downtime. Real-time data from dashboards helps you make quick choices. It also helps you get better quality and plan maintenance before problems happen. Many factories now use dashboards to watch performance and track important numbers.
| Evidence Type | Description |
|---|---|
| Real-time Monitoring Systems | Smart factories watch production numbers with dashboards. |
| Data Collection | Dashboards study sensor data for quick insights. |
| Key Performance Indicators | Dashboards show OEE and quality numbers to help improve. |
FineReport help you make dashboards that support smart factory changes.
Machine Monitoring Dashboards and Shop Floor Productivity
Real-Time Visibility for the Shop Floor
Real-time monitoring dashboards give you a clear look at your shop floor. These dashboards gather data from machines and sensors. You can see production numbers, machine status, and quality metrics as they happen. This helps you find problems early and act fast.
Operators and managers use dashboards to watch key performance indicators. You can check cycle times, throughput, downtime, and defect rates. Real-time monitoring lets you spot bottlenecks and losses right away. TeepTrak software connects machines and shows hidden losses. Teams use this data to make availability, performance, and quality better.
Dashboards help everyone talk and share information. People on the shop floor see the same data. Visual alerts help you react quickly to issues like slow speed or stoppages. You cut delays and make smarter choices. The table below shows how dashboards change shop floor efficiency:
| Metric | Pre-implementation | Post-implementation | Improvement |
|---|---|---|---|
| Monthly Downtime | 90 h | 10 h | 88.9% |
| Tool Rejection Rate | 380 PPM | 105 PPM | 72.4% |
You see less downtime and fewer rejected tools. Dashboards help you get higher productivity and better production throughput.
- Real-time dashboards make accountability and troubleshooting easier.
- You boost machine availability and quality outcomes.
- Dashboards help you find bottlenecks and measure losses.
Boosting Shop Floor Productivity
Dashboards are important for boosting shop floor productivity. You track production metrics like units made per hour, downtime, and machine use. Quality metrics such as defect rates and first-pass yield show how well your shop floor works. Maintenance metrics like machine health and overall equipment effectiveness help you plan repairs before problems get worse.
You use dashboards to keep improving. Operational dashboards give you a real-time look at the production process. You find inefficiencies and take steps to improve product quality. Real-time data collection helps you guess maintenance needs and cut idle time. You keep your workflow smooth and your production throughput high.
Dashboards help you keep watching key metrics. You respond quickly to issues. Visual alerts let you fix problems before they hurt production. Everyone on the shop floor stays informed and ready to act.
- Production metrics: cycle times, throughput, downtime
- Quality metrics: defect rates, first-pass yield, compliance
- Maintenance metrics: machine health, overall equipment effectiveness
Dashboards help you reach your goals for shop floor productivity. You see better production throughput and quality. You make smart choices that keep your shop floor running well.
What Is a Machine Monitoring Dashboard?
Key Features and Functions
A machine monitoring dashboard lets you see what is happening on your shop floor. You use it to check machines, find problems, and make better choices. These dashboards collect data from sensors and devices on your equipment. The data tells you things like temperature, speed, and if a machine is running. You get updates right away, so you can act fast.
There are a few main parts in a machine monitoring dashboard. The table below shows these parts and what they do:
| Component/Functionality | Description |
|---|---|
| Sensors and Edge Devices | Measure physical parameters directly from equipment, pre-process data locally. |
| Connectivity | Transmits sensor data using wired or wireless technologies, impacting bandwidth and latency. |
| Platform/Software | Central hub for data collection, storage, processing, and visualization, including dashboards and alerting. |
| Analytics and AI/ML | Analyzes data for trends, anomaly detection, predictive maintenance, and process optimization. |
You use dashboards to watch important numbers and get alerts. You can see patterns, find problems, and plan repairs before machines break. This helps you keep your machines working and your shop floor busy.
How FineReport Powers Dashboards
FineReport gives you tools to make strong dashboards for your factory. You can connect data from many places and see everything together. FineReport lets you use drag-and-drop to make charts, tables, and alerts. You do not need to write any code.
Dashboards made with FineReport help you get useful information. You can see patterns, spot problems early, and make good choices. FineReport keeps your data safe with strong security. Only the right people can see or change the data. You can also add dashboards to your current systems, which makes your work easier.
Here are some features of FineReport that help you build good dashboards:
| Feature | Description |
|---|---|
| Actionable Insights | Provides insights from predictive analytics, trend analysis, and anomaly detection for decision-making. |
| Secure Access Controls | Implements security measures to protect sensitive data and restrict access to authorized users. |
| Seamless Integration | Allows easy integration of the dashboard into existing systems for improved workflows. |
You can use FineReport on your computer or phone. This means you always have the newest information, no matter where you are. With FineReport, you turn data into action and keep your shop floor working well.
Benefits of Machine Monitoring Dashboards
Reduce Downtime with Real-Time Alerts
Dashboards with real-time alerts help you cut downtime. These dashboards watch your machines all the time. If something goes wrong, you get a warning right away. Fast alerts let you fix problems before they stop work. This means less downtime and more products made. For example, WessDel got 17 more work hours per worker each month after using real-time monitoring. You also plan better and use machines more.
- You get more work hours.
- You have less downtime that is not planned.
- You make better plans and use machines well.
Dashboards help your shop floor run without big stops. You can act fast and keep production moving.
Optimize Production Throughput with Data Insights
Dashboards give you data to help you make more products. You always know what is happening on your shop floor. When you see a bottleneck, you can fix it fast. Dashboards use analytics to show where things slow down or waste time. You use this data to make your process better.
- You find bottlenecks with real-time data.
- Analytics show where you lose time or products.
- You use old data to make smarter choices.
When you work to make more products, you save time. You also get better quality and higher efficiency. Dashboards help you watch numbers and make changes that boost how much you make.
Data-Driven Decisions on the Shop Floor
Dashboards help you make better choices on the shop floor. FanRuan’s smart factory solution gives you clear info for every step. FlowTrace gives you facts that help you act fast and fix problems. You spend less time on repeat jobs and more time on important work.
Dashboards give you real-time info and automation to cut delays and mistakes. You can fix problems fast and keep your shop floor working well. Companies like BOE and Danfoss saw big gains in production and throughput after using dashboards. You get more from your money when you use dashboards to watch and improve your process.
Implementing Machine Monitoring Dashboards with FineReport
Assess Needs and Integrate Data Sources
You begin by finding out what your shop floor needs. First, pick the key performance indicators that matter most for your goals. These can be things like throughput, downtime, or machine health. Dashboards should be simple, so everyone can decide quickly. Real-time data helps you see problems right away. FineReport lets you connect to many data sources easily. You can gather information from sensors, machines, and business systems. This makes it easy to collect data and see your whole production process. With FineReport, you set up automatic monitoring that keeps your data moving without extra work.
- Pick KPIs that match your production goals.
- Make dashboards simple for fast choices.
- Add real-time data for better monitoring.
- Use FineReport to connect all your data sources.
Customizing Dashboards for the Shop Floor
You can change dashboards to fit your shop floor. FineReport lets you make dashboards for different jobs, like operators or managers. You can show each person only the data they need. This helps you track materials, find bottlenecks, and improve throughput. You can also connect dashboards to your current systems. This helps with automation and easy data collection. Real-time views of KPIs help you see how production is going at any time.
| Feature | Description |
|---|---|
| Configurability | You can change dashboards for each job on the shop floor. |
| Integration | Dashboards work with your current systems for smooth data flow and automation. |
| Real-time Data | You get live updates on throughput and production, so you can act fast. |
You can use dashboards to follow materials from start to finish. Automatic data capture means you always know what is happening. This helps you keep production moving and throughput high.
Training and Adoption for Success
You need to teach your team how to use dashboards. Good training and clear talks help everyone see why monitoring and automation are good. When people see how dashboards help, they feel better about their work. Staff who like the technology use it more, which brings better results. FineReport makes training simple with its easy drag-and-drop tools and mobile access. You can use dashboards on any device, so your team always has production data.
- Teach staff how to use dashboards for monitoring and data collection.
- Show how dashboards help with throughput and decisions.
- Help your team as they learn, so everyone keeps using dashboards.
By doing these things, you build a system that boosts throughput, improves monitoring, and supports automation on your shop floor.
Overcoming Challenges in Dashboard Adoption
Integration with Legacy Systems
You might have trouble when you connect new dashboards to old machines. Many factories use equipment that is very old. These machines do not share data easily with new tools. You must check if your dashboards can work with your old setup. It is smart to work with vendors who help you connect everything.
Some companies joined over 20 old systems into one dashboard. This made it easier to see data and made production better. You can move to new dashboards step by step. Start with the most important machines first. Use APIs and automation to help your dashboards connect well.
Ensuring Data Quality and Security
You need to keep your data safe and correct. Dashboards send lots of information across your shop floor. You should protect this data with encryption and user controls. Only the right people should see or change your data. This keeps your shop floor safe from cyber risks.
Dashboards also help you use the same numbers everywhere. When you use the same metrics, you can compare results and find problems faster. Automated dashboards save time and cut down on mistakes. You get better results from your monitoring and production.
Driving Change Management
People on your shop floor might worry about new dashboards. Some workers may not want their work measured. You can help by talking about why you use dashboards. Show how dashboards help everyone do better and keep production running.
Try these steps to help people use dashboards:
- Tell your team why dashboards are good.
- Give training so everyone knows how to use them.
- Let workers help and listen to their ideas.
You can pick tech champions from your team. These leaders can help others and answer questions. Try dashboards with one group first to fix problems early. When people see better results, more will want to use dashboards.
Dashboards give operators, engineers, and managers a clear view of production. Real-time monitoring helps you find problems fast and work together to fix them. This teamwork makes production better and your shop floor stronger.
You can make your shop floor better with machine monitoring dashboards. These tools let you watch machines in real time. You can see trends and act fast. FineReport from FanRuan helps you connect data and watch machines better. When you begin, think about what your shop floor needs. Check your old systems and make sure they fit your goals. Remember, monitoring is not only about new technology. It is also about helping people and making changes. To do well, use monitoring to lead your team, make quality better, and earn more money.
- Use dashboards to watch machines and find trends right away.
- Think about your needs and check your systems before picking a dashboard.
- See monitoring as a way to help your whole team, not just a tool.


FAQ

The Author
Lewis Chou
Senior Data Analyst at FanRuan
Related Articles

Portfolio Reporting for PMOs: 9 Executive Metrics Every Weekly Portfolio Dashboard Should Include
Weekly portfolio reporting should help executives answer three questions fast: Are we delivering the right initiatives, are we putting outcomes at risk, and what decisions need leadership this week? For PMOs, that means
Yida Yin
Jul 01, 2026

How to Build an Investment Portfolio Reporting Dashboard for Executives: KPIs, Benchmarks, and Drill-Down Views
Investment portfolio reporting for executives is not about showing every holding, transaction, and chart your investment team can produce. It is about giving CEOs, CFOs, CIOs, boards, and investment committees a fast, re
Yida YIn
Jun 25, 2026

12 KPI Reporting Examples for Executive Dashboards: What to Show in Weekly, Monthly, and Quarterly Reviews
Executive leaders do not need more data. They need decision ready $1 examples that match how often they review the business and what actions they are expected to take. A weekly $1 should surface fast moving risks and per
Yida YIn
Jun 25, 2026