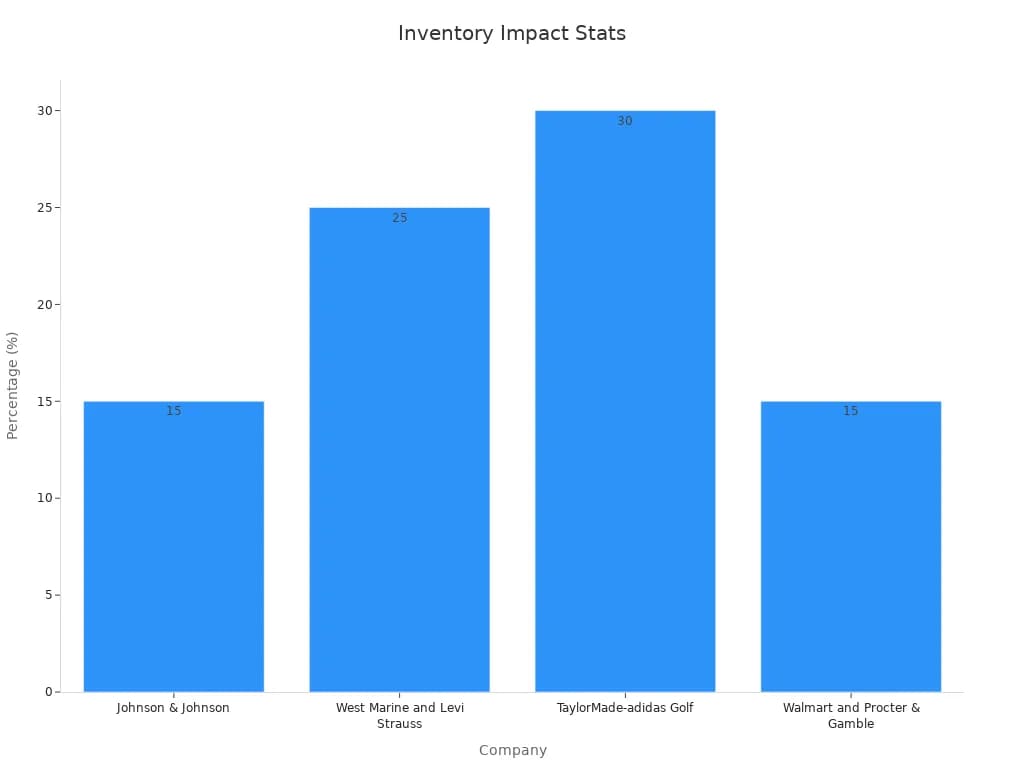
You rely on inventory reports to make smarter business decisions in Malaysia every day. These reports help you spot trends, avoid costly mistakes, and drive efficiency across your management processes. Companies like Johnson & Johnson and Walmart have seen up to 25% inventory reduction and a 15% drop in stockouts by using inventory management tools. The chart below shows how businesses in Malaysia achieve optimized inventory levels, lower costs, and better forecasting. The benefits of inventory reporting reach every part of your organization, leading to stronger management and improved performance.
Key Takeaways
Inventory reports give a clear snapshot of your stock, sales trends, and product performance to help you make smarter business decisions in Malaysia.
Using accurate and up-to-date inventory data helps avoid costly mistakes like overstocking or running out of popular items.
You can create inventory reports manually or use automated tools likeFineReportto save time and reduce errors.
Analyzing inventory levels and key metrics helps you forecast demand, improve stock management, and boost profitability.
Regularly updating and reviewing inventory reports supports better planning, faster decisions, and stronger business growth in Malaysia.
Inventory Report Basics
What Is an Inventory Report
You use an inventory report to see a clear summary of the products your business in Malaysia holds at any given time. This report gives you a snapshot of your total inventory, best-selling items, and stock levels. A basic inventory report often includes important details such as SKU numbers, sales trends, reorder points, and inventory value. You can also track profitability, sales data, cost of goods sold, purchase orders, and shipment trends.
Here are some key parameters you will find in a basic inventory report:
These measurable parameters help you track stock, spot sales trends, and support better forecasting. When you use inventory reports, you gain a method to measure progress and set clear goals for your business in Malaysia.
Tip: Use dashboards for real-time tracking and train your staff to understand the metrics in your inventory reports. This practice helps you improve sales, reduce costs, and keep your inventory management aligned with your company’s strategy.
Why Inventory Report Matters
Inventory reports play a vital role in your business success in Malaysia. They help you make informed decisions by showing you what products move quickly and which ones sit on the shelf. When you review these reports, you can avoid overstocking or running out of popular items.
Reporting also supports your ability to forecast demand and plan for future sales. By analyzing the data in your inventory report, you can identify patterns and adjust your purchasing or sales strategies. Industry studies show a strong statistical link between inventory report usage and better business performance in Malaysia. For example, using correlation analysis, you can see how inventory levels relate to sales quantities. This insight helps you optimize stock, minimize holding costs, and allocate resources more efficiently.
You can use reporting tools to create scatter plots, heatmaps, and time-series analyses. These tools help you find meaningful relationships in your business data in Malaysia. Real-world examples from retail and manufacturing show that inventory reports lead to increased sales, reduced costs, and improved customer satisfaction.
Key Components of Inventory Report
Essential Data Fields
When you build inventory reports, you need to focus on the right data fields. These fields help you track your inventory data accurately and make better decisions. Companies that use precise data fields often see fewer stock-outs and better resource allocation.
Here are the most important data fields you should include:
Stock levels
Turnover rates
Reorder points
Potential issues
Ending balance
Calculated monthly consumption (AMC)
Losses or adjustments
Beginning versus ending balance accuracy
Stock status
Stock-outs
Inventory accuracy (difference between records and physical count)
Supplier order fill rate
Report completeness
Note: Accurate reporting of these fields supports better inventory management. Many companies using advanced technology, such as RFID, achieve up to 97% accuracy in their inventory reports.
You can use these fields to spot trends, reduce errors, and keep your inventory data up to date. When you track these details, you improve your ability to respond quickly to changes in demand.
Types of Inventory Report
You can choose from several types of inventory reports, each serving a different purpose. Picking the right report helps you solve specific business problems in Malaysia and improve your operations.
Report Type
Key Metrics / Features
Purpose / Effectiveness
Warehouse Logistics
Shipping success rates, warehouse costs, perfect order rates
Improves logistics by finding inefficiencies and optimizing warehouse tasks
Helps you make decisions about costs, volume, and machinery
Retail
Sales and order volumes, perfect order rates, reasons for returns
Lets you track order trends and improve your product range
Digital Media
Content engagement, language inclusivity, readership metrics
Ensures your communications reach and engage your audience
Energy
Energy usage benchmarks, production costs, energy sources
Supports energy management and cost savings
FMCG
Real-time insights on fast-moving goods, supply chain optimization
Keeps your operations smooth and supports timely decisions
A stock levels report is one of the most common types of inventory reports. It gives you a clear view of what you have on hand and what you need to reorder. By using different types of inventory reports, you can monitor trends, manage costs, and improve your business performance in Malaysia.
Create an Inventory Report
Manual Methods
You can create an inventory report manually by following a clear, step-by-step process. This approach works well for small businesses in Malaysia or when you want to double-check your automated systems. Many companies in manufacturing and retail still use manual methods for certain tasks because they offer hands-on control and validation.
Plan the Count Define the scope of your inventory. Decide which items and locations you will count. Assign team members and set a schedule for the count.
Prepare the Area Clear away unnecessary items. Make sure all products are accessible and properly labeled. This step helps you avoid confusion during counting.
Assign Roles Give each person a specific job. Some will count items, others will record data, and a few will verify the results. Clear roles prevent mistakes.
Count Inventory Items Use tally sheets or barcode scanners to count each item. Record the quantity and location for every product. Manual scan-based counting is common in industries like electronics, where accuracy is critical.
Verify Counts Double-check your numbers. Re-count a sample of items or use random spot checks. This step ensures accurate inventory reporting.
Reconcile Discrepancies Investigate any differences between your records and physical counts. Adjust your records as needed. Look for causes such as misplaced items or data entry errors.
Report Results Summarize your findings. Include inventory levels, discrepancies, and any adjustments you made. Share this report with your team.
Analyze and Improve Review the results to find areas for improvement. Look for trends in errors or shortages. Use this analysis to refine your inventory tracking process.
Note: Many businesses in Malaysia use statistical methods like random sampling to estimate inventory levels. This approach saves time and still provides reliable results. In practice, companies often combine manual checks with surveys and double-entry validation to ensure data quality.
Manual reporting techniques remain effective in certain settings. For example, electronic equipment manufacturers track key performance indicators using control sheets and manual scans. These methods have been validated through industry studies and statistical analysis, showing that manual processes can support accurate inventory reporting when used correctly.
Automated Tools with FineReport
Automated tools make it much easier to create an inventory report, especially as your business in Malaysia grows. FineReport by FanRuanoffers a powerful solution for automated inventory tracking and reporting. You can connect data from multiple sources, design custom dashboards, and schedule reports—all with minimal effort.
Here’s how you can use FineReport to automate your inventory reporting:
Connect Your Data Sources FineReport lets you link databases, spreadsheets, and even cloud storage. You can pull real-time data from your warehouse, sales, and procurement systems.
Design Your Report Use the drag-and-drop interface to build custom inventory reports. Choose from templates or create your own layout. Add fields like stock levels, reorder points, and turnover rates.
Set Up Automated Data Collection FineReport supports automated inventory tracking. The system updates your reports as new data comes in. You no longer need to enter numbers by hand.
Schedule Regular Reporting You can schedule reports to run daily, weekly, or monthly. FineReport will generate and distribute these reports automatically to your team.
Visualize and Analyze Data Create dashboards with charts, graphs, and tables. FineReport helps you spot trends and outliers quickly. You can drill down into details or view high-level summaries.
Share and Collaborate Share reports with your team through email, mobile apps, or a web portal. FineReport supports permission controls, so each user sees only the data they need.
Tip: Automated tools like FineReport reduce manual errors and save time. You get more accurate inventory reporting and can focus on making better business decisions in Malaysia.
FineReport stands out because it integrates with over 100 data sources and supports real-time updates. You can manage large datasets, customize your reports, and access insights from any device. Many companies use FineReport to streamline their inventory management, improve forecasting, and reduce costs.
By moving from manual methods to automated solutions, you gain efficiency and accuracy. Automated inventory tracking ensures your data stays current, and scheduled reporting keeps everyone informed. FineReport gives you the flexibility to scale your reporting as your business in Malaysia grows. To learn more about the FineReport features, you can click on the button below to go to the product guide.
You need to analyze inventory levels to keep your business in Malaysia running smoothly. When you track these levels, you can spot problems early and avoid costly mistakes. You use both quantitative and qualitative methods for this analysis. Quantitative techniques include ratio analysis, such as days inventory outstanding, inventory turnover, and inventory to sales ratio. These ratios help you see how quickly you sell products and how long items stay in stock. For example, days inventory outstanding tells you the average number of days you hold inventory before selling it. If this number rises, you may have trouble clearing out old stock.
You also use statistical data to improve your analysis. Time series analysis, regression, and moving averages help you with demand forecasting. These methods let you predict future sales and plan your stock levels. Models like Economic Order Quantity (EOQ) and safety stock calculations help you balance costs and service levels. Supply chain analytics uses these tools to optimize inventory planning and assess supplier performance. By combining these methods, you make your inventory management more accurate and reduce risks.
Qualitative analysis adds another layer. You review financial statement notes to check how you value inventory and compare your methods with competitors. This helps you understand if your inventory planning matches industry standards. When you use both types of analysis, you get a complete picture of your inventory performance report.
Note: Accurate inventory levels are key to effective inventory planning. If you notice a rising days inventory outstanding ratio, you should investigate possible clearance issues.
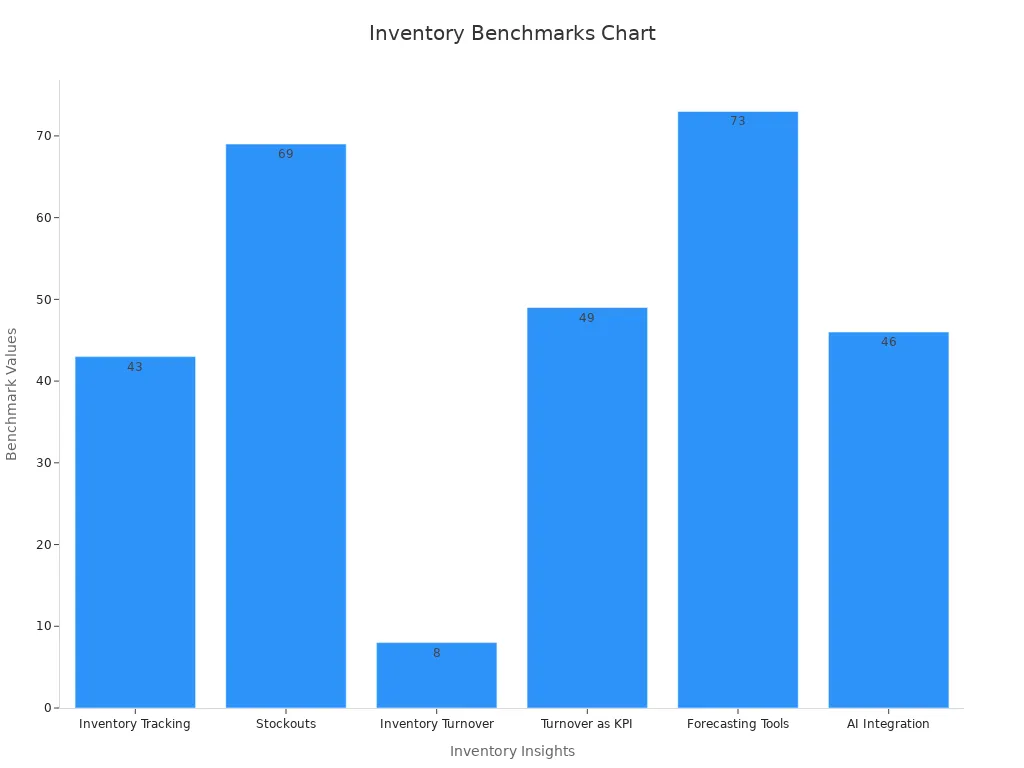
You can see how important this is in the real world. Research shows that 43% of small businesses do not track inventory or use outdated manual systems. This leads to lost revenue and inefficiencies. On the other hand, companies that use analytics see a 20% cost reduction and a 35% improvement in stock accuracy. The chart below highlights how different inventory insights connect to business outcomes:
You should also pay attention to inventory record accuracy. Studies show that stores with higher inventory record inaccuracy have more stockouts and higher replenishment costs. By improving your record accuracy, you boost both inventory and sales management.
Using Inventory Report for Decisions
You rely on inventory reports to guide your business decisions in Malaysia. These reports give you the data you need to act quickly and confidently. Key performance indicators (KPIs) like inventory turnover, stockouts, and overstocking validate the use of detailed inventory reports for strategic business decisions. For example, leading eCommerce businesses maintain an inventory turnover ratio of 8 or higher. This shows efficient stock movement and healthy cash flow.
You should always align your KPIs with your business goals in Malaysia. Actionable and strategically aligned KPIs help you measure progress and make better decision making possible. Industry-specific benchmarks ensure your inventory KPIs support your strategy. For instance, 49% of retailers track inventory turnover as a key performance indicator, which directly links to profitability and operational success.
Here is a table that connects inventory insights with business outcomes in Malaysia:
Inventory Insight
Benchmark / Statistic
Correlation with Business Decision Improvement
Inventory Tracking
43% of small businesses do not track inventory
Leads to inefficiencies and lost revenue
Stockouts
69% of online shoppers abandon purchase if item is out of stock
Missed sales opportunities, $1 trillion global retail loss
Overstocking
Increases storage costs by 20-30%; 42% of SMBs struggle
Negatively impacts cash flow and efficiency
Inventory Turnover Ratio
Leading eCommerce: ratio of 8 or higher
Indicates efficient stock movement and healthy cash flow
Automation Adoption
46% of SMBs use inventory software; 78% plan to invest
Reduces stockouts by 30%, boosts efficiency by up to 50%
Forecasting Tools Usage
73% of retailers say forecasting tools improve accuracy
Reduces overstocking/stockouts, increases revenue by 9%
Companies using analytics: 20% cost reduction, 35% better accuracy
Enables efficient stock management and better decisions
AI Integration
46% use AI for forecasting and optimization
Enhances forecasting accuracy, reduces human error
You can use an inventory forecasting report to predict demand and adjust your stock levels. This helps you avoid both overstocking and stockouts. When you use forecasting tools, you improve inventory accuracy and increase revenue. Empirical analysis shows that forecast accuracy links to inventory performance, but you must consider your product type, inventory policies, and cost structure. Improving forecast accuracy only helps if it leads to useful decisions and cost savings.
You should also focus on effective inventory planning. By using inventory management software and analytics, you can automate many tasks. Automation reduces stockouts by 30% and increases operational efficiency by up to 50%. When you adopt these tools, you support better decision making and drive business growth in Malaysia.
Tip: Regularly review your inventory performance report and inventory forecasting report. Use the insights to adjust your inventory planning and management strategies for the best results.
Best Practices and Automation of Inventory Report
Regular Updates
You need to keep your inventory tracking up to date to maintain accuracy and efficiency. Businesses in Malaysia use two main systems for inventory updates: periodic and perpetual. Each method has its own strengths and challenges.
Periodic inventory systems require you to count your stock at set intervals. You might do this monthly, quarterly, or yearly, depending on your business needs in Malaysia. During these counts, normal operations may pause so you can focus on getting accurate numbers. This method works well for smaller businesses in Malaysia or those with less frequent inventory changes.
Perpetual inventory systems update your records in real time. Every sale or purchase changes your inventory count automatically. You use software that connects to your sales and asset management tools. This system gives you constant visibility and helps you spot issues quickly.
Barcode and RFID technologies can boost both systems. Barcodes let you scan items for instant updates, reducing manual errors. RFID tags provide real-time tracking, which is especially useful for high-value or sensitive items.
Even with a perpetual system, you should still do physical counts sometimes. This step helps you catch any mistakes or losses and keeps your reporting accurate.
Choosing the right update method depends on your business size, complexity, and goals. Regular updates support better inventory management and help you avoid costly mistakes.
Leveraging FanRuan Solutions
You can achieve enhanced inventory management by adopting automated tools like FineReport from FanRuan. FineReport lets you connect all your data sources, automate your reporting, and access real-time insights from any device. You design custom dashboards and schedule reports to keep your team informed without extra effort.
With FineReport, you improve efficiency by reducing manual work and errors. The platform supports scalable, real-time inventory management, so you can grow your business in Malaysia without worrying about outdated processes. You gain increased efficiency through automated alerts, scheduled reporting, and mobile access. Your management team can make faster decisions with up-to-date information.
FineReport also helps you maintain accurate inventory reporting by integrating with barcode and RFID systems. You track inventory in real time and spot trends before they become problems. Many companies see better forecasting and cost savings after switching to automated inventory tracking with FineReport.
Tip: Start by automating your most time-consuming reporting tasks. As you see results, expand automation to other areas for even greater efficiency.
You can use FineReport to create an inventory analysis report that shows the structure of your inventory. This report helps you see how your products are grouped by category, location, or supplier. You get a clear view of what you have in stock and where you store it. When you use this type of inventory report, you can quickly spot slow-moving items and identify which products take up the most space. This information helps you make better decisions about storage and purchasing. You also improve your inventory availability report by tracking which items are always ready for sale.
Tip: Review your inventory structure regularly. This practice helps you avoid overstocking and keeps your warehouse organized.
Inventory Change Analysis Dashboard
FineReport gives you a dashboard that tracks changes in your inventory over time. You see how stock levels rise and fall each day, week, or month. The dashboard uses charts and tables to show trends and highlight unusual changes. You can use this dashboard to run an analysis of your inventory performance report. This helps you understand why certain products run out faster or why some items stay in stock too long. You can also use the dashboard to compare actual stock movements with your sales forecasts.
Track daily, weekly, or monthly changes
Spot trends and outliers quickly
Compare actual data with forecasts
This dashboard supports better planning and helps you respond to changes in demand.
Inventory Turnover Dashboard
You can use the inventory turnover report in FineReport to measure how quickly you sell your products. The inventory turnover dashboard shows you the ratio of sales to average inventory. High turnover means you sell products quickly. Low turnover may signal overstocking or slow sales. You can use this dashboard to improve your inventory profitability report. By tracking turnover, you find which products bring in the most profit and which ones tie up your cash. The inventory turnover report also helps you set better reorder points and avoid stockouts.
Note: Regularly check your inventory turnover dashboard. This habit helps you keep your business in Malaysia efficient and profitable.
Inventory reports help you make smarter business decisions in Malaysia and keep your company on track. When you start with regular reporting and move toward automation, you see real improvements. Automated tools like FineReport use data analysis and AI to boost forecasting and cut costs. You gain these benefits:
More accurate demand forecasts and fewer stockouts
Lower storage costs and better inventory control
Faster response to market changes
Improved efficiency and less manual work
Using the right reporting tools supports business growth in Malaysia and helps you stay ahead in a changing market.
Click the banner below to try FineReport for free and empower your enterprise to transform data into productivity!
Real-time insights to optimize production, logistics, and decisions.
FAQ
How often should you update your inventory reports?
You should update your inventory reports regularly. Most businesses choose daily or weekly updates. Frequent updates help you spot issues early and keep your stock levels accurate.
Can you use FineReport with your existing inventory systems?
Yes, you can connect FineReport to most inventory systems. FineReport supports over 100 data sources, including databases, spreadsheets, and cloud platforms. This flexibility lets you integrate your current tools easily.
What is the main benefit of automating inventory reports?
Automating inventory reports saves you time and reduces errors. You get real-time data, which helps you make faster and smarter business decisions. Automation also keeps your team focused on important tasks.
Do you need technical skills to use FineReport?
You do not need advanced technical skills. FineReport uses a drag-and-drop interface. You can design reports and dashboards without coding. The platform is user-friendly for both beginners and experienced users.
How does inventory reporting help with forecasting?
Inventory reporting gives you clear data on sales trends and stock movement. You can use this information to predict future demand. Accurate forecasting helps you avoid stockouts and overstocking.