An inventory management dashboard gives you a clear view of your stock levels, orders, and supply chain data in one place. You use it to track inventory in real time, spot issues quickly, and make smart decisions. FineReport makes this process even easier with automation and seamless data integration. Studies show that businesses see up to 95% inventory accuracy, 35% fewer stockouts, and 25% lower carrying costs when using dashboards.
Metric
Improvement
Inventory accuracy
63% to 95%
Reduction in stockouts
Up to 35%
Reduction in carrying costs
25%
Inventory Management Dashboard Overview
What Is an Inventory Management Dashboard
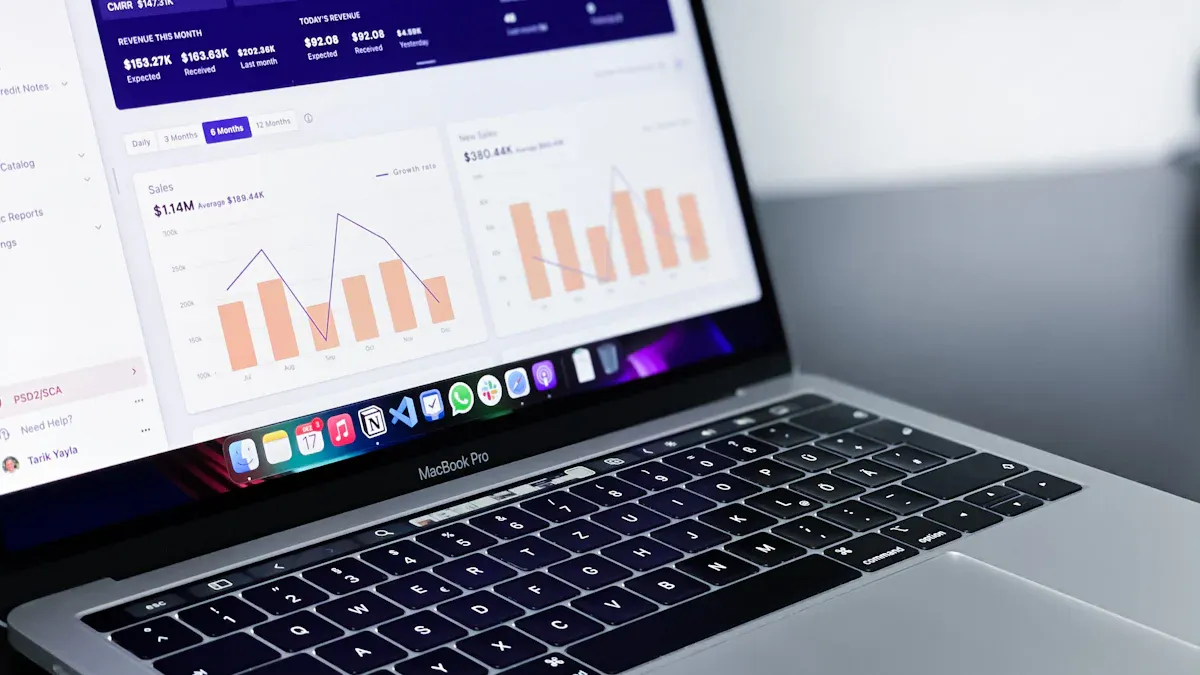
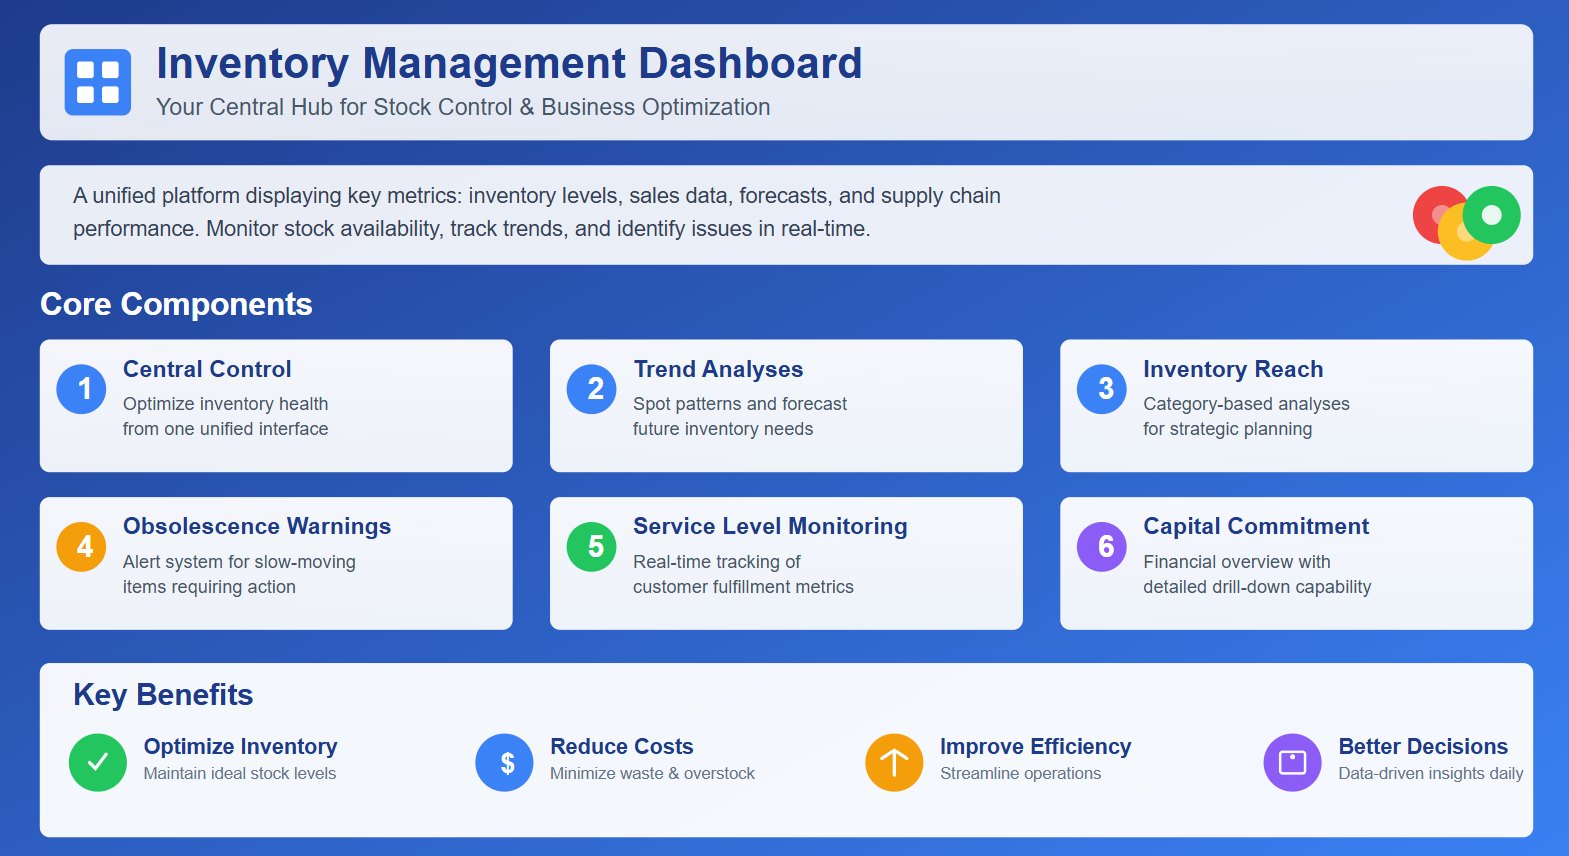
You use an inventory management dashboard to see all your stock information in one place. This tool shows you key metrics like inventory levels, sales, forecasts, and supply chain performance. You can monitor stock availability, track trends, and spot problems as they happen. The dashboard helps you keep your inventory healthy and your business running smoothly.
Tip: An inventory management dashboard often includes interactive graphics and traffic light systems. These features make it easy for you to see which items need attention right away.
Here are some core components you will find in most dashboards:
Central control for optimal inventory health
Trend analyses to spot patterns
Inventory reach analyses by categories
Obsolescence warnings for slow-moving items
Real-time service level monitoring
Capital commitment overviews with drill-down functions
When you use a dashboard, you can optimize inventory, reduce costs, and improve efficiency. You get a visual summary that helps you make better decisions every day.
How It Works
An inventory management dashboard connects to your data sources and updates information in real time. You can link it to your inventory management system, ERP software, or even spreadsheets. Many dashboards also use automated systems, barcoding technologies, and eCommerce platforms to gather data.
Here is how the data flows from input to insight:
Functionality
Description
Real-time inventory visibility
You see stock levels and locations instantly, so you can make informed decisions.
Inventory movement analysis
You track changes in inventory and manage stock based on demand.
Product performance insights
You analyze sales and inventory data to find top and low-performing products.
Supplier performance evaluation
You monitor supplier metrics to improve your supply chain.
Dashboards differ from traditional tracking methods. You get more automation, customization, and real-time updates. Here is a quick comparison:
Feature/Outcome
Inventory Management Dashboards
Traditional Inventory Tracking Methods
Real-Time Tracking
Yes
No
Automation
Yes
Limited
Customization
High
Low
Improved Decision-Making
Yes
No
Reduced Stock Issues
Yes
Often Occurs
You can use dashboards to analyze trends, set alerts, and drill down into details. This helps you respond quickly to changes and avoid costly mistakes.
Who Uses Inventory Dashboards
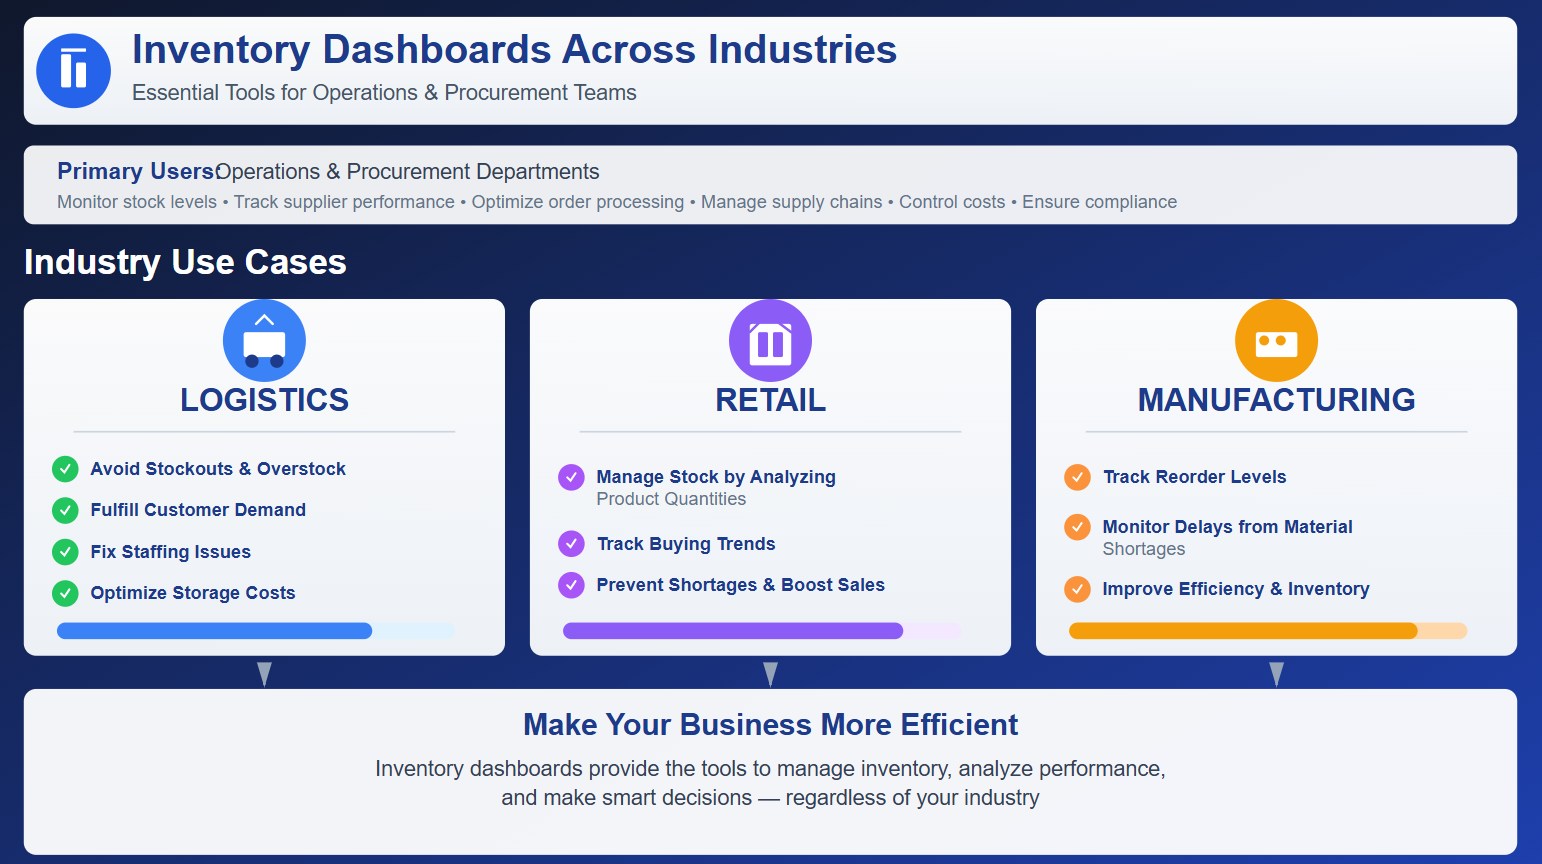
You will find inventory dashboards in many industries. Operations and procurement departments use them most often. These teams rely on dashboards to monitor stock levels, supplier performance, and order processing. Dashboards help them manage supply chains, control costs, and track compliance.
Here are some common use cases across industries:
Industry
Use Case Description
Logistics
You avoid stockouts and overstock, fulfill customer demand, fix staffing issues, and optimize storage costs.
Retail
You manage stock by analyzing product quantities and buying trends, preventing shortages and boosting sales.
Manufacturing
You track reorder levels and delays due to material shortages, improving efficiency and inventory management.
You can use an inventory management dashboard to make your business more efficient, whether you work in logistics, retail, or manufacturing. The dashboard gives you the tools to manage inventory, analyze performance, and make smart decisions.
Key Features of Inventory Management Dashboards
Real-Time Tracking and Alerts
You need instant access to your inventory data to make smart decisions. Real-time tracking lets you see stock levels, order status, and supply chain movements as they happen. FineReport supports this with automated updates and alert systems. You get notifications when stock runs low or when orders face delays. This helps you act quickly and avoid costly mistakes.
Here is how real-time tracking and alerts improve your inventory management:
Benefit
Description
Improved Inventory Accuracy
Minimizes stock discrepancies and prevents miscounts, leading to informed decisions and reduced mistakes.
Enhanced Demand Forecasting
Provides up-to-date data to identify demand patterns, preventing stockouts and lost sales.
Faster Order Fulfillment
Ensures accurate stock information for quicker retrieval and processing, reducing delays and errors.
Reduced Holding Costs and Wastage
Identifies slow-moving inventory to optimize turnover and minimize storage costs.
Greater Supply Chain Visibility
Offers end-to-end visibility, enhancing coordination and collaboration across the supply chain.
Better Customer Satisfaction
Improves product availability and fulfillment speed, increasing customer trust and loyalty.
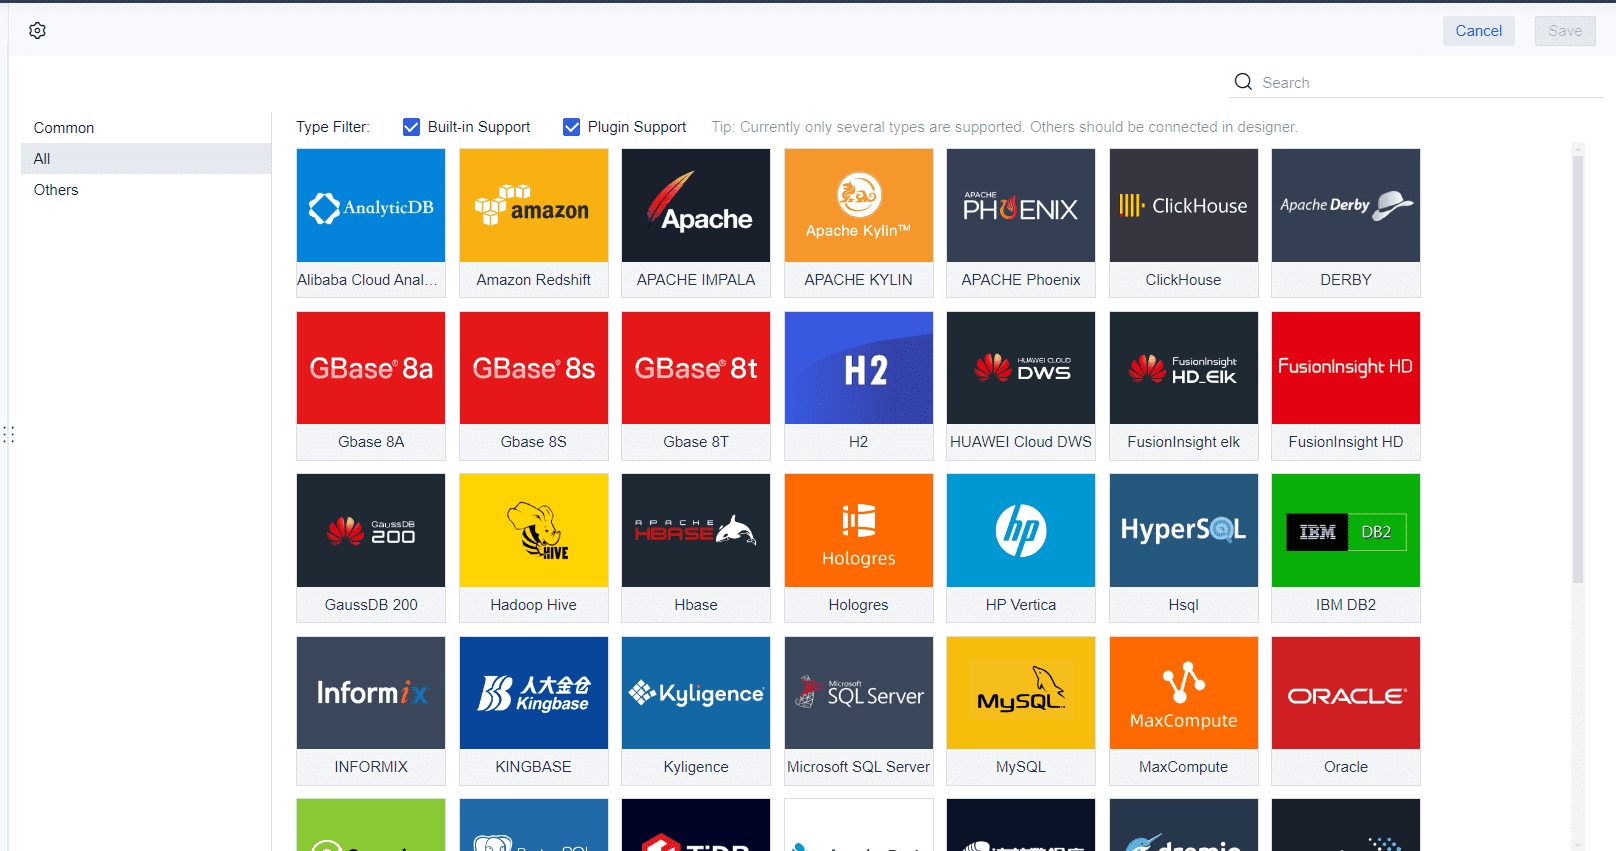
Data Integration with FineReport
You can connect FineReport to multiple data sources, including ERP systems, spreadsheets, and databases. The drag-and-drop designer makes it easy to build dashboards without coding. You can combine data from different locations and departments, giving you a complete view of your inventory. FineReport’s multi-source integration helps you track stock across warehouses, monitor supplier performance, and analyze sales trends. You get accurate, up-to-date information for every part of your business.
Tip: FineReport’s integration features let you automate data collection and reporting. You spend less time on manual tasks and more time analyzing results.
Mobile and Custom Dashboards
You can access your inventory dashboards on any device, including smartphones and tablets. FineReport’s mobile features keep you connected whether you are in the office or on the go. Customizable dashboard layouts let you choose which metrics matter most to you. You can design dashboards for different roles, such as managers, warehouse staff, or sales teams.
FineReport also offers 3D dashboards for advanced visualization. You can see complex data in a clear, interactive format, making it easier to spot trends and take action.
Why Businesses Need Inventory Management Dashboards
Solving Inventory Challenges
You face many challenges when managing inventory. Poor employee training can lead to mistakes and slow processes. Low stock visibility makes it hard to know what you have on hand. Limited data access can delay your decisions. Fragmented operations create silos that cause errors and waste.
An inventory management dashboard helps you solve these problems by bringing all your data together. You get real-time visibility into your stock, so you always know what is available. You can track inventory movement, spot trends, and respond quickly to changes. The dashboard also improves communication across departments. Everyone works from the same data, which reduces confusion and mistakes.
When you use a dashboard, you break down silos and make your operations more efficient.
Here are some common inventory challenges and how dashboards address them:
Poor employee training: Dashboards provide clear, easy-to-read data, reducing errors.
Low stock visibility: Real-time updates show you exactly what is in stock.
Limited data access: Dashboards give you access to all inventory data in one place.
Fragmented operations: Integration brings all functions together for smoother workflows.
Improving Efficiency and Decisions
You want to make fast, accurate decisions. An inventory management dashboard gives you the tools to do this. You see key metrics like order processing time, picking time, packing time, and shipping time. You can track inventory accuracy, shrinkage, and the cost of goods sold. These insights help you spot problems early and act before they grow.
Dashboards give you real-time visibility. You can check stock performance and make quick choices. You can also monitor important indicators, such as fill rate and lead time, to keep your business running smoothly.
Here is a table showing how dashboards improve decision-making:
Benefit
Description
Real-time visibility
You get instant insights into stock performance, so you can act quickly.
Optimized inventory management
Dashboards streamline your processes, saving you time.
Tracking key metrics
You monitor the numbers that matter most for your business.
Reduction of shortages
You prevent stockouts by making decisions based on accurate data.
Improved turnover
You move inventory more efficiently, which helps your bottom line.
You can also use dashboards to plan ahead. They help you forecast future storage needs and identify slow-moving items. You see all your information in one view, which makes your decisions faster and more accurate.
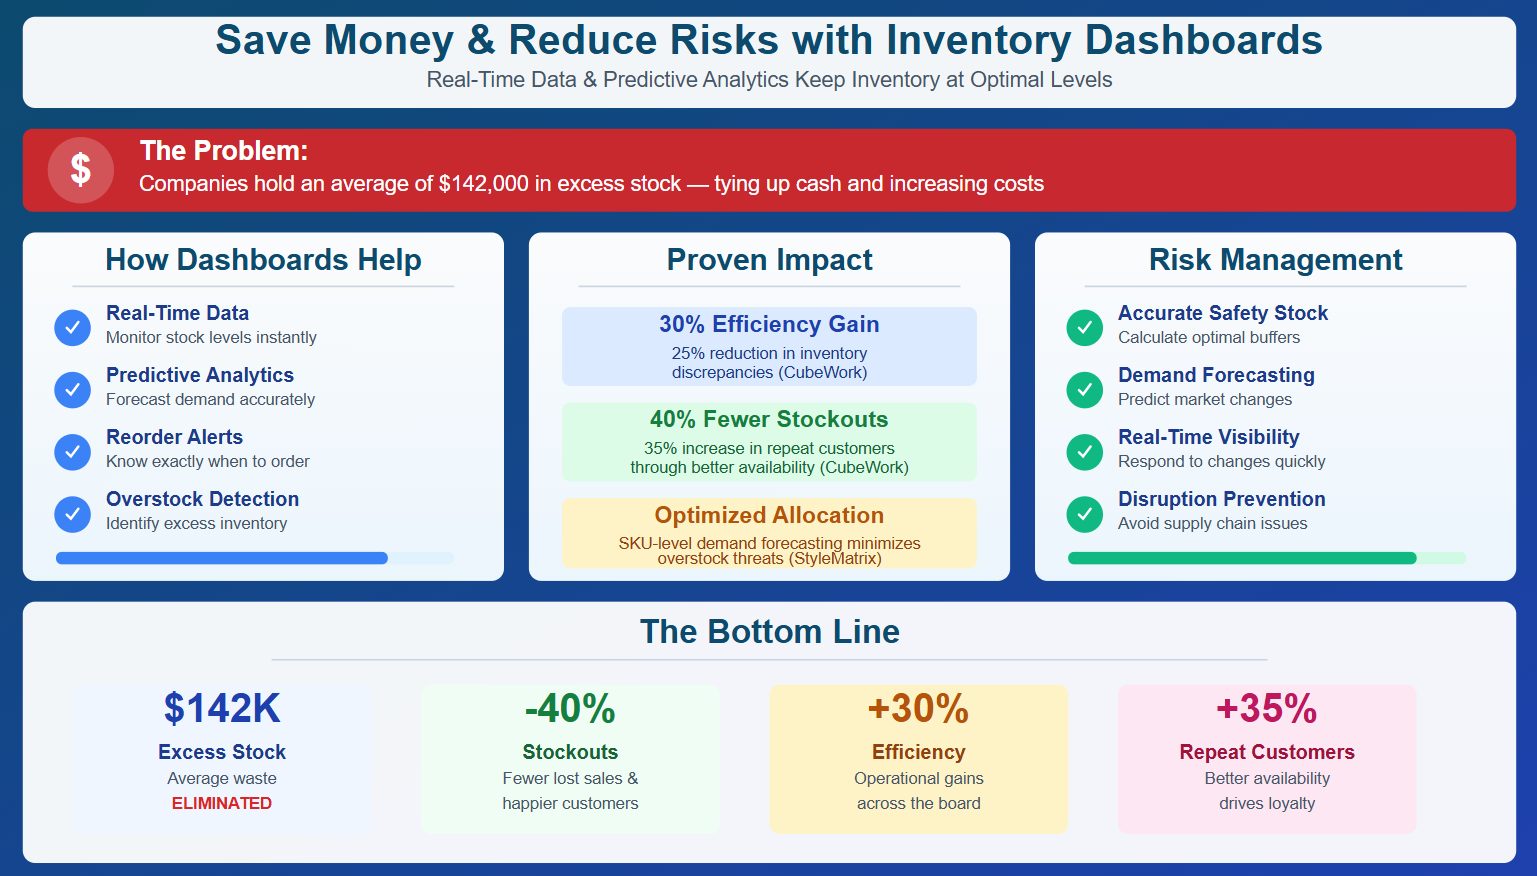
Reducing Costs and Risks
You can save money and reduce risks with an inventory management dashboard. Many businesses hold too much inventory, which ties up cash and increases costs. On average, companies keep $142,000 worth of extra stock they do not need. Poor inventory management can also lead to lost sales from stockouts.
Dashboards help you avoid these problems. They use real-time data and predictive analytics to keep your inventory at the right level. You can see when you need to reorder and when you have too much stock. This reduces both overstock and stockouts.
Reduces stockouts by 40% and increases repeat customer rates by 35%.
CubeWork
Predictive analytics models demand at the SKU level.
Minimizes threats of overstock and stockouts, leading to more efficient inventory allocation.
StyleMatrix
Dashboards also help you manage risks. You can calculate safety stock more accurately and forecast demand. Real-time visibility lets you respond quickly to market changes. This means you can avoid supply chain disruptions and reduce inventory shrinkage.
By using a dashboard, you save time, cut costs, and protect your business from unexpected risks.
Use Cases and Success Stories
Manufacturing Inventory Control with FineReport
You can see real results when you use FineReport for inventory management in manufacturing. Many companies face challenges like overstock, stockouts, and slow order fulfillment. FineReport helps you solve these problems by connecting all your data sources and giving you a clear view of your inventory. You can track raw materials, finished goods, and supplier performance in real time. This means you can respond quickly to changes in demand and avoid costly mistakes.
FineReport lets you automate routine tasks. You can set up alerts for low stock or delayed shipments. You can also analyze trends to improve your forecasting. With these tools, you reduce manual errors and save time. Many manufacturers report lower carrying costs and faster order processing after switching to FineReport.
Note: You can customize dashboards for different teams. Warehouse staff, managers, and sales teams can each see the data that matters most to them.
BOE and Bifido Foods Case Studies
You can learn a lot from companies like BOE and Bifido Foods. Both organizations used FineReport to transform their inventory management processes. They faced issues with data scattered across different systems and teams. By adopting an inventory management dashboard, they gained a unified view of their operations.
You need to invest in training so everyone can use dashboards effectively.
Removing access barriers helps your teams share data and make better decisions.
Working with different departments and experts increases engagement with data visualizations.
BOE saw a 5% reduction in inventory costs and a 50% boost in operational efficiency. Bifido Foods improved data integration and made faster decisions. You can achieve similar results by focusing on clear data, strong training, and open communication.
Tip: When you bring your teams together and give them the right tools, you create a culture of data-driven decision-making.
Implementation and Best Practices
Integration with Existing Systems
You need to connect your inventory dashboard with your current ERP or warehouse management system for the best results. Start by setting up uniform data formats and protocols. This step helps your systems communicate smoothly. Map your data fields carefully to keep your information accurate. Configure each system to match your integration needs and run thorough tests to catch any issues early. Train your staff on new workflows and explain the benefits of integration. Change management strategies help your team adjust and feel confident during the transition.
Tip: Use a dedicated data integration platform with error management features. This approach helps you avoid missing data and silent workflow failures.
Common technical challenges include linking dashboards to other systems, security concerns, and tool sprawl. You can solve these by using data exchange standards, setting access levels based on user roles, and integrating dashboards to reduce fragmentation.
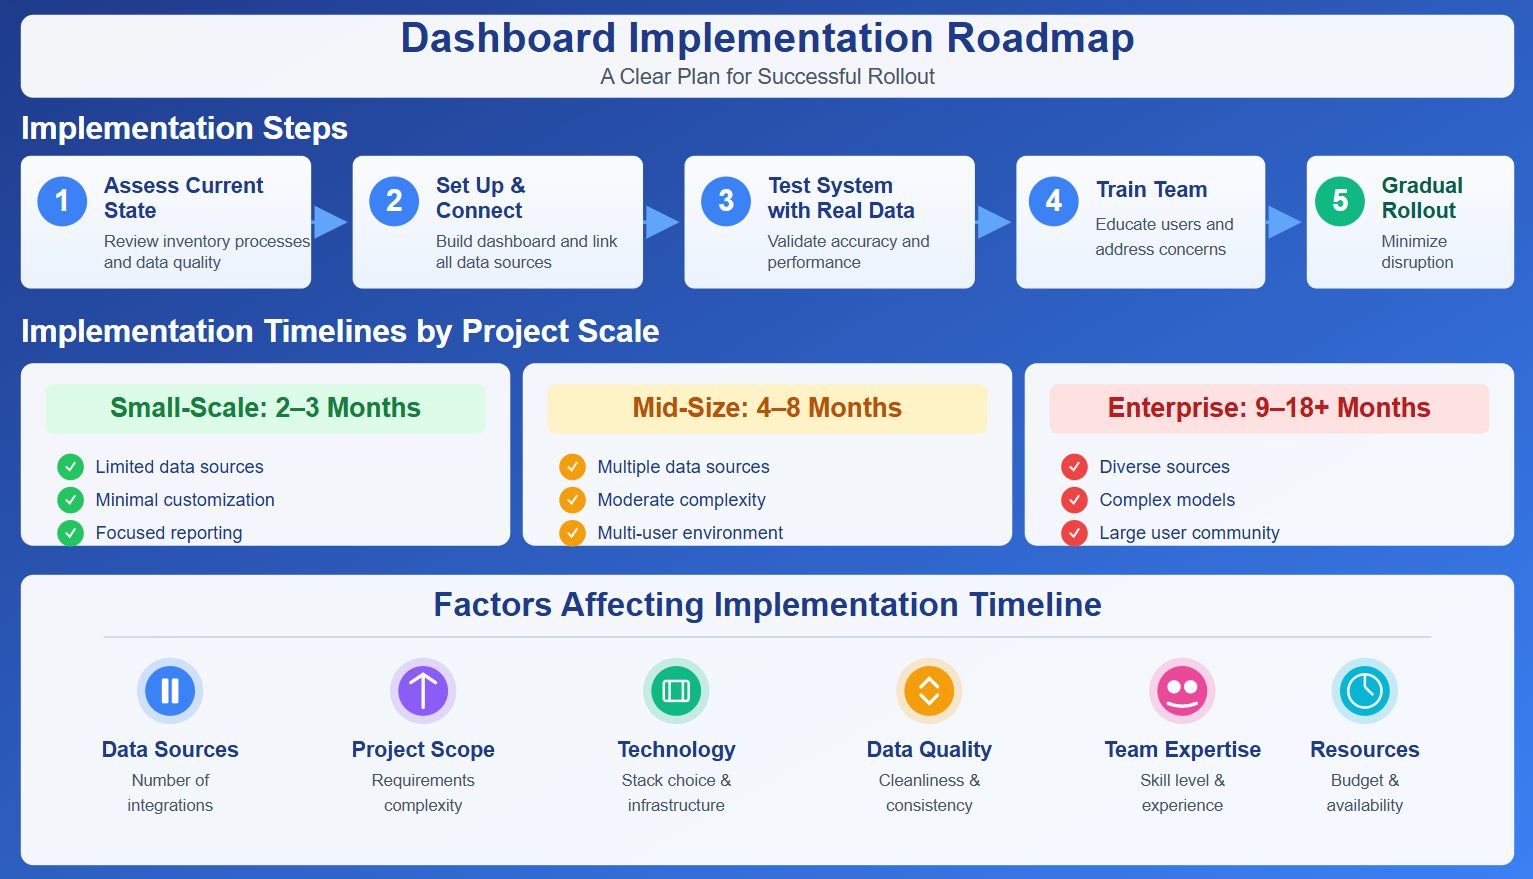
Steps for a Smooth Rollout
A successful rollout follows a clear plan. Begin by assessing your current inventory processes and data quality. Next, set up your dashboard and connect it to all necessary data sources. Test the system with real data to ensure accuracy. Train your team and address any concerns. Roll out the dashboard gradually to minimize disruption.
Here is a table showing typical implementation timelines:
Project Scale
Typical Duration
Key Characteristics
Small-Scale Data Warehouse
2–3 months
Limited data sources, minimal customization, focused reporting
Mid-Size Data Warehouse
4–8 months
Multiple data sources, moderate complexity, multi-user environment
Enterprise-Scale Data Warehouse
9–18+ months
Diverse sources, complex models, large user community
Factors that affect the timeline include the number of data sources, project scope, technology stack, data quality, and team expertise.
Training and Support
You need strong training and support for successful dashboard adoption. Tailor your training programs to different user groups and skill levels. Offer both general and role-specific sessions. Interactive demonstrations and hands-on exercises with real inventory data boost user confidence. Ongoing support, such as helpdesks or peer support, helps your team solve problems after launch.
You can measure user satisfaction and proficiency with real-time assessments, quizzes, and feedback surveys. Track key performance indicators and use data from your learning management system to monitor progress. The Kirkpatrick Model helps you evaluate training effectiveness across multiple levels, giving you a clear picture of your program’s impact.
Note: Comprehensive training and ongoing support ensure your team uses the dashboard effectively and gets the most value from your investment.
You rely on inventory management dashboards to keep your business efficient and competitive. These tools help you maximize sell-through, balance stock levels, and minimize excess inventory. You gather valuable data and set clear fulfillment rules, which lets you save sales even during stock-outs.
Maximize sell-through and minimize out-of-stocks.
Proactively monitor and balance stock levels.
Minimize required inventory on hand.
Gather valuable data.
Define fulfillment rules based on predefined parameters.
Save the sale in stock-out situations.
FineReport gives you real-time insights and supports operational excellence. As technology evolves, you will see new trends shaping inventory management:
Trend
Description
Increased Adoption of AI and Machine Learning
AI and ML enhance predictive analytics and automate decision-making in inventory management.
Real-Time Inventory Visibility Through IoT
IoT connects physical assets to digital systems for improved tracking and management.
Blockchain for Secure Transactions
Blockchain provides an immutable ledger for enhanced traceability and trust in transactions.
Automation and Robotics in Warehousing
Automation streamlines operations, improving accuracy and speed in inventory handling.
Cloud-Based Systems
Cloud technology supports scalability and integration in modern inventory solutions.
Focus on Sustainability
Sustainability is increasingly prioritized in inventory management strategies.
You should review your current inventory processes and consider adopting a dashboard solution like FineReport. This step will help you stay ahead and make smarter decisions for your business.
Access a wealth of case studies, industry insights, and solution guides to accelerate digital transformation.
FAQ
What is the main benefit of using an inventory management dashboard?
You get instant visibility into your stock levels and order status. This helps you make faster decisions and avoid costly mistakes. Dashboards also reduce manual work and improve accuracy.
Can you access FineReport dashboards on your phone?
Yes, you can view and interact with FineReport dashboards on any smartphone or tablet. The mobile features let you track inventory and receive alerts wherever you are.
How does FineReport connect to your existing systems?
You use FineReport’s drag-and-drop designer to link data from ERP, spreadsheets, and databases. The platform supports over 500 data sources, making integration simple and flexible.
Do you need coding skills to build dashboards in FineReport?
No, you do not need coding skills. FineReport uses an intuitive drag-and-drop interface. You can create custom dashboards and reports quickly, even if you have no programming experience.