DuPont analysis breaks return on equity (ROE) into three drivers—profit margin, asset turnover, and financial leverage—so finance teams can see why ROE changed, not just that it did. This guide covers the 3-step and 5-step formulas, a worked calculation example, interpretation frameworks, common limitations, and how to build a DuPont dashboard in FineBI that turns ratio analysis into management-ready insight.
DuPont analysis is a financial framework that decomposes ROE into component ratios, revealing whether profitability comes from operating efficiency, asset utilization, or capital structure. It was developed in 1919 by Donaldson Brown at DuPont Corporation and remains a standard tool in corporate finance, credit analysis, and executive performance review.
Unlike simple ROE, which gives a single number, DuPont analysis answers diagnostic questions:
Did ROE improve because margins expanded or because the company took on more debt?
Is a declining ROE caused by falling sales productivity or rising leverage risk?
How does our ROE driver mix compare to industry peers?
The most common version is the 3-step DuPont model. A more granular 5-step version separates tax and interest effects for deeper analysis. Both are covered below with formulas and examples.
DuPont Analysis Formula
3-Step DuPont Formula
The 3-step model breaks ROE into three multiplicative components:
Tax Burden = Net Income ÷ Earnings Before Tax (EBT)
Interest Burden = EBT ÷ EBIT
EBIT Margin = EBIT ÷ Sales
Asset Turnover = Sales ÷ Average Total Assets
Equity Multiplier = Average Total Assets ÷ Average Shareholders' Equity
The 5-step version is useful when comparing companies with different tax jurisdictions or capital structures, as it isolates operating performance from financing and tax effects.
3-Step DuPont Analysis Example
Consider a company with the following annual figures:
Metric
Value
Net Income
$3,000,000
Sales
$30,000,000
Average Total Assets
$20,000,000
Average Shareholders' Equity
$10,000,000
Step-by-step calculation:
Component
Formula
Calculation
Result
Net Profit Margin
Net Income ÷ Sales
3M÷30M
10.0%
Asset Turnover
Sales ÷ Avg Assets
30M÷20M
1.5×
Equity Multiplier
Avg Assets ÷ Avg Equity
20M÷10M
2.0×
ROE
Margin × Turnover × Multiplier
10% × 1.5 × 2.0
30.0%
Verification: Direct ROE = Net Income ÷ Equity = 3M÷10M = 30%. The DuPont decomposition matches.
What this tells us: This company's 30% ROE is driven primarily by leverage (2.0× multiplier) and solid asset efficiency (1.5× turnover), while its profit margin (10%) is moderate. If ROE declines next quarter, management should check whether margin compression or asset bloat is the cause—not assume profitability itself deteriorated.
5-Step DuPont Analysis Formula
Using the same company, assume additional data:
Metric
Value
EBIT
$4,500,000
EBT (Earnings Before Tax)
$4,000,000
Net Income
$3,000,000
Component
Formula
Calculation
Result
Tax Burden
Net Income ÷ EBT
3M÷4M
75.0%
Interest Burden
EBT ÷ EBIT
4M÷4.5M
88.9%
EBIT Margin
EBIT ÷ Sales
4.5M÷30M
15.0%
Asset Turnover
Sales ÷ Avg Assets
30M÷20M
1.5×
Equity Multiplier
Avg Assets ÷ Avg Equity
20M÷10M
2.0×
ROE
All five components
75% × 88.9% × 15% × 1.5 × 2.0
30.0%
The 5-step breakdown reveals that interest expense reduces pre-tax earnings by ~11%, and taxes consume 25% of pre-tax income. If management wants to improve ROE without increasing leverage, improving EBIT margin (operational efficiency) or reducing interest burden (refinancing) are the levers to pull.
How to Interpret DuPont Analysis Results
A DuPont decomposition is only useful if it drives action. Use this interpretation framework:
Scenario
Likely Driver
Diagnostic Question
Action to Investigate
ROE up, margin up
Profitability improvement
Are price increases sustainable or one-time cost cuts?
Assess quality of earnings, leverage trajectory, margin durability
Cross-period comparison is essential. A single snapshot shows structure; trend analysis shows direction. Build dashboards that display at least 4–8 quarters of each component alongside ROE.
Peer benchmarking adds context. Industry norms vary significantly: retail typically shows high turnover with low margins, while software shows high margins with lower turnover. Compare within the same sector for meaningful conclusions.
DuPont Analysis vs Simple ROE
Dimension
Simple ROE
DuPont Analysis
Output
Single percentage
Three (or five) component ratios
Diagnostic power
None—shows result, not cause
Reveals which driver changed
Trend analysis
Limited
Shows driver-level trends over time
Peer comparison
Surface-level
Enables apples-to-apples driver benchmarking
Management action
Generic ("improve profitability")
Specific ("reduce inventory days," "refinance debt")
Risk visibility
Hidden
Leverage risk explicitly separated
Simple ROE is adequate for quick screening. DuPont analysis is necessary when you need to explain why performance changed and what to do about it.
When to Use DuPont Analysis
DuPont analysis is most valuable in these situations:
Quarterly/annual performance reviews. Explain ROE movement to boards and executives with driver-level clarity.
Credit analysis and lending decisions. Lenders assess whether ROE is supported by sustainable operations or excessive leverage.
M&A due diligence. Decompose target company ROE to identify hidden risks or improvement opportunities.
Internal benchmarking. Compare business units or subsidiaries with different capital structures on an apples-to-apples basis.
Investor relations. Communicate profitability strategy with specificity rather than generic statements.
Turnaround diagnosis. Identify whether declining returns stem from operational deterioration or financial restructuring needs.
Limitations of DuPont Analysis
DuPont analysis is powerful but not sufficient alone. Be aware of these constraints:
Limitation
Impact
Mitigation
Accounting-based inputs
Subject to accruals, estimates, and policy choices
Supplement with cash flow metrics (FCF, operating cash flow)
Backward-looking
Reflects past performance, not future potential
Combine with forward-looking KPIs (pipeline, backlog, guidance)
Industry variation
Cross-sector comparisons can mislead
Always benchmark within the same industry
Snapshot bias
Period-end balances may distort averages
Use average-of-period balances; check for seasonality
Ignores cash flow
High ROE can coexist with poor liquidity
Pair with cash conversion cycle and free cash flow analysis
Manipulation risk
Companies can engineer ratios via timing or structure
Audit component trends over multiple periods; flag outliers
No qualitative context
Cannot capture competitive moats, management quality, or regulatory risk
Integrate with strategic and operational assessments
Use DuPont analysis as a diagnostic starting point, not a standalone verdict.
How to Build a DuPont Analysis Dashboard in FineBI
A static spreadsheet captures a single period. A FineBI dashboard makes DuPont analysis interactive, trend-aware, and shareable across finance and management teams.
What an Effective DuPont Dashboard Shows
ROE waterfall chart. Visual decomposition showing how margin, turnover, and leverage contributed to total ROE change between periods.
Component trend lines. 8-quarter history of net profit margin, asset turnover, and equity multiplier plotted alongside ROE.
Driver contribution bars. Stacked bar chart showing each component's proportional impact on ROE movement.
Peer benchmark overlay. Industry median lines for each component to contextualize performance.
Drill-down by segment. Business unit, region, or product line breakdown to pinpoint where driver changes originate.
Alert thresholds. Conditional formatting flags when any component breaches predefined warning levels.
Key Design Principles
Lead with the question. The dashboard title should be "Why Did ROE Change?" not "DuPont Analysis." Frame every widget around a specific diagnostic need.
Show change, not just level. Absolute values matter less than deltas. Highlight period-over-period and year-over-year movements.
Enable self-service exploration. Allow users to filter by entity, period, and segment without requesting new reports. FineBI's drag-and-drop interface supports this natively.
Connect to live data. Use FineDataLink to automate ETL from ERP and financial systems, ensuring dashboards reflect actuals without manual uploads.
Separate summary from detail. Executive view shows ROE and three drivers. Analyst view adds 5-step breakdown, segment drill-down, and peer comparison.
For fixed-format financial reports (P&L, balance sheet, regulatory filings), complement dashboards with FineReport.
From DuPont Dashboards to AI Financial Analysis
A DuPont dashboard shows whether ROE changed because of margin, asset efficiency, or leverage. Finance and management teams often need the next layer: why a specific driver moved, which business unit is responsible, and what explanation to present to leadership.
Dora operates as an AI analysis layer on top of governed DuPont dashboards and financial reports built in FineBI and FineReport. It does not generate investment advice or replace analyst judgment. Instead, it accelerates the path from visibility to explanation:
Natural-language follow-up. Ask "Why did asset turnover decline in Q2?" and receive a narrative summary grounded in actual dashboard data and underlying transactions.
ROE change summaries. Automatically generate period-over-period or business-unit comparisons explaining which drivers contributed to or detracted from ROE.
Anomaly detection. Flag unusual movements in any DuPont component that deviate from historical patterns or peer benchmarks, with contextual explanations.
Management-ready briefings. Produce concise, structured narratives suitable for CFO reviews, board decks, or investor communications—based on trusted, governed data sources.
Consistent metric definitions. All Dora responses reference the same calculated fields and data lineage as your FineBI dashboards, eliminating version conflicts.
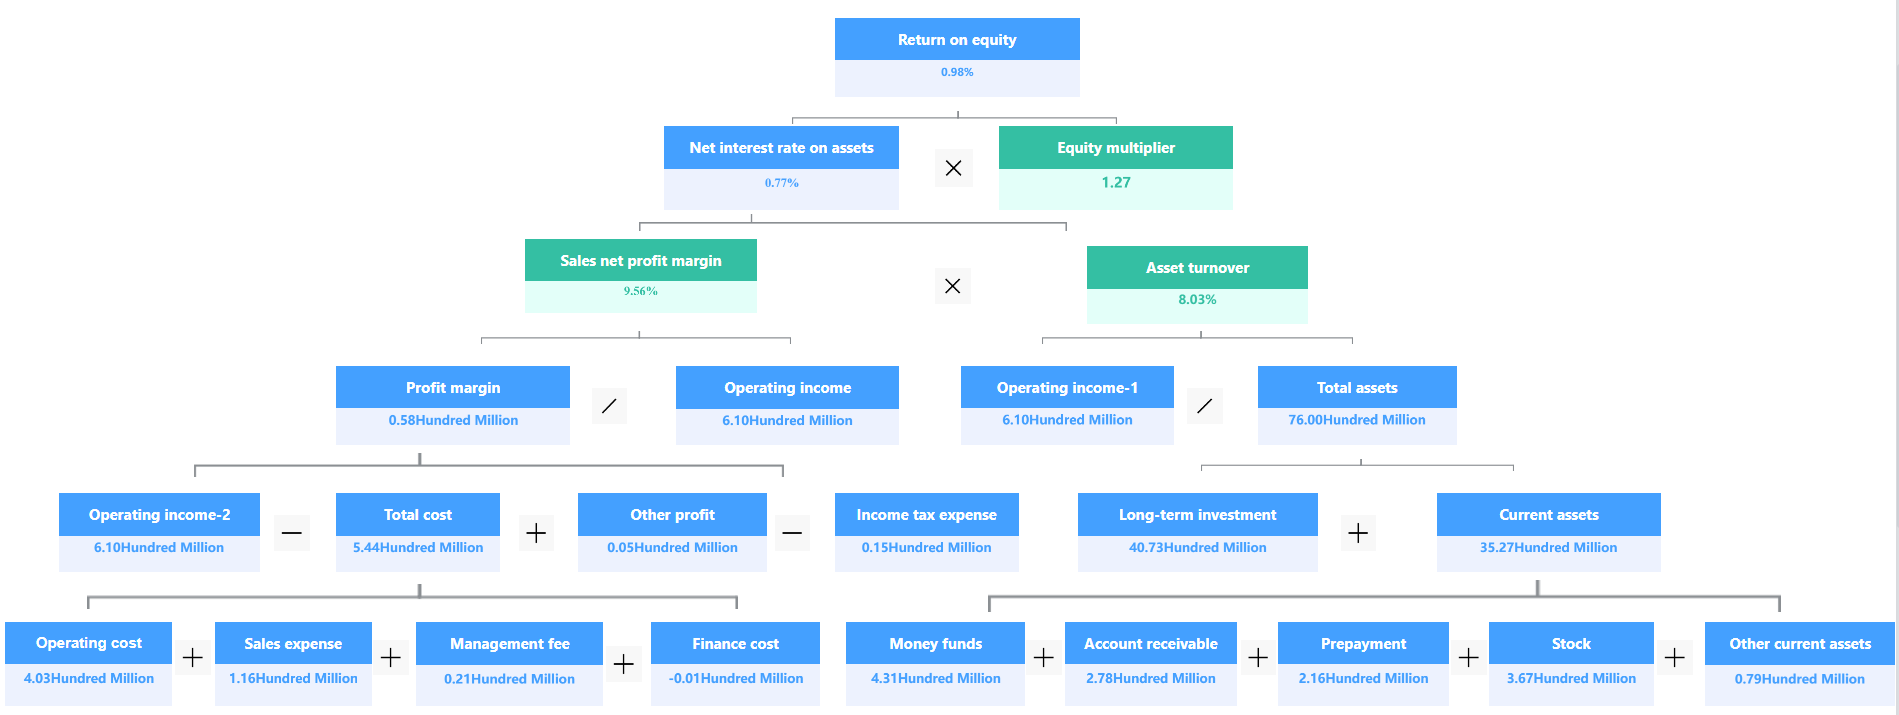
Natural-language Query
DuPont analysis identifies the driver. Dora helps teams articulate the story behind it.
The 3-step model breaks ROE into net profit margin, asset turnover, and equity multiplier. The 5-step model further decomposes net profit margin into tax burden, interest burden, and EBIT margin. Use the 5-step version when comparing companies across different tax jurisdictions or when you need to isolate operating performance from financing and tax effects. For most internal management reviews, the 3-step model provides sufficient diagnostic clarity.
DuPont analysis is designed for equity-return-focused organizations. Non-profits and government entities lack shareholders' equity in the traditional sense. Adapted versions exist (e.g., replacing ROE with return on assets or program efficiency ratios), but the standard framework does not directly apply. Focus on mission-relevant efficiency metrics instead.
Align frequency with your reporting cadence. Quarterly analysis suits most public companies and mid-sized businesses. Monthly analysis is appropriate for turnaround situations or high-volatility industries. Annual analysis is sufficient for stable, mature businesses. Regardless of frequency, always compare against prior periods and peer benchmarks to extract actionable insight.
You need five line items from the income statement and balance sheet: net income, sales (revenue), EBIT (for 5-step), EBT (for 5-step), average total assets, and average shareholders' equity. Use average-of-period balances for assets and equity to avoid distortion from period-end timing. Automate data collection via FineDataLink to ensure accuracy and reduce manual effort.
DuPont analysis integrates several standalone ratios into a unified framework. Net profit margin connects to profitability analysis, asset turnover to efficiency analysis, and equity multiplier to solvency analysis. It complements—but does not replace—cash flow analysis, liquidity ratios, and valuation multiples. Use DuPont for diagnostic decomposition and pair it with cash flow metrics for a complete financial health assessment.
Yes. FineBI allows you to define calculated fields for each DuPont component, build interactive dashboards with trend visualization and drill-down, and schedule automatic refreshes connected to your financial data sources. Pre-built templates accelerate deployment. Combined with FineDataLink for automated ETL, you can maintain a live DuPont dashboard without manual spreadsheet updates.
Product Trial
FineReport
Pixel-perfect reports · Interactive dashboards · Easy data entry · Digital twins
Smarter product, pricing, and inventory management across retail sectors.
FAQ
What is DuPont Analysis?
DuPont analysis is a framework that breaks down return on equity (ROE) into three component parts: net profit margin, asset turnover, and financial leverage FineReport. This method helps businesses identify exactly what drives their profitability and where improvements are needed.
What is the DuPont Analysis Formula?
The DuPont formula is: ROE = Net Profit Margin × Asset Turnover × Equity Multiplier. This structure gives managers a detailed look at what drives return on equity FineReport by examining profitability, efficiency, and leverage separately.
Why Use DuPont Analysis Instead of Simple ROE
Unlike traditional methods that focus only on aggregate figures, DuPont analysis gives a clearer picture of what drives return on equity FineReport. It reveals whether strong performance comes from high margins, efficient asset use, or financial leverage.
Who Invented DuPont Analysis?
The DuPont method originated in 1919 when Donaldson Brown, an executive at DuPont Corporation, introduced a new way to evaluate company performance FineReport. It transformed financial analysis into a strategic management tool.
What is a Good ROE by Industry?
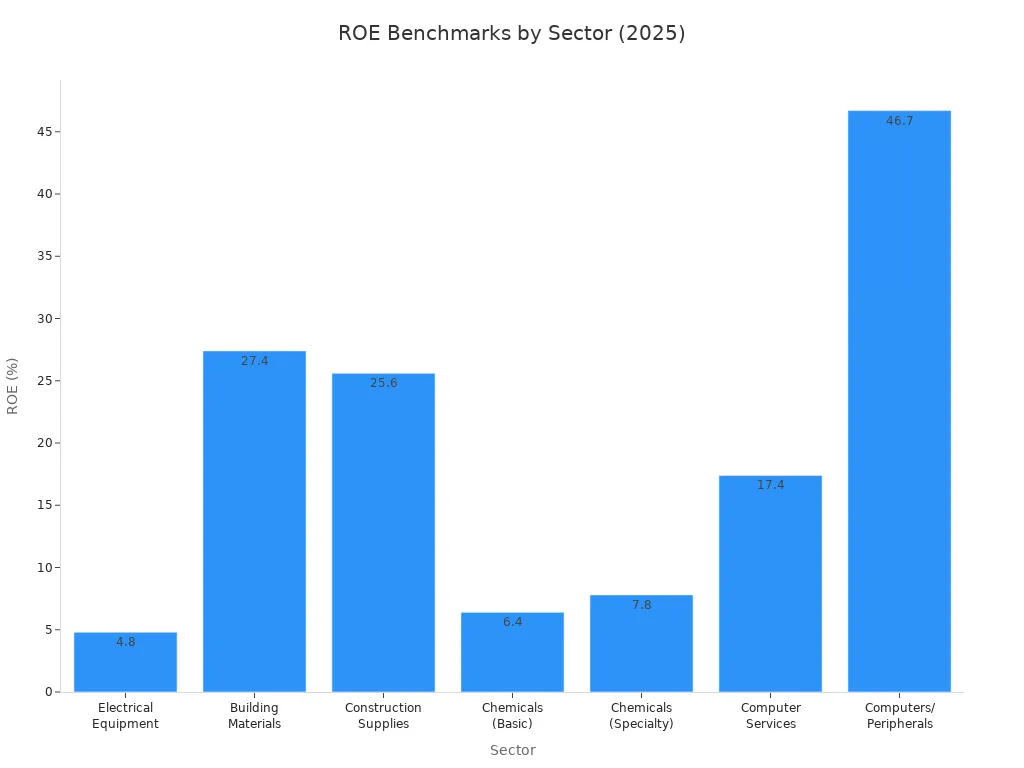
Industry benchmarks for ROE can vary widely. For example, in 2025, manufacturing sectors like Building Materials and Construction Supplies showed ROE values above 25%. Technology sectors such as Computer Services had ROE near 17.4% FineReport. Compare your ROE to industry standards for accurate performance assessment.


 Natural-language Query