A social media marketing report is not just a recap of likes and follower counts. It is a decision-making tool that shows whether your campaigns are creating business value, where performance is improving or slipping, and what should happen next. For marketing managers, agency teams, operations leaders, and client-facing strategists, the real pain point is rarely access to data. It is turning scattered platform metrics into a report that is clear, credible, and useful to different audiences.
All reports in this article are built with FineReport.
What a social media marketing report should include
A strong social media marketing report should answer three questions fast:
What happened?
Why did it happen?
What should we do next?
If the report only lists numbers, it fails. If it only tells a story without evidence, it also fails. The best reports balance data, context, and recommendations.
The report structure should depend on its audience. An internal performance review needs operational detail. A leadership summary needs ROI and trend visibility. A client-ready report needs clarity, accountability, and polished presentation.
At a minimum, a useful report should include:
Reporting period and campaign scope
Goals and KPIs
Platform-by-platform performance
Trend comparisons versus previous periods
Top-performing and underperforming content
Context notes for unusual changes
Recommendations and next steps
Key metrics to track every reporting period
Not every campaign needs the same metrics, but every reporting cycle should include a focused KPI set tied to the objective.
Key Metrics (KPIs)
Reach: The number of unique users who saw your content. Best for measuring brand visibility.
Impressions: The total number of times content was displayed. Useful for understanding exposure frequency.
Engagement: Likes, comments, shares, saves, and other interactions. Indicates audience response to content.
Engagement Rate: Engagement relative to reach, followers, or impressions. More meaningful than raw engagement alone.
Clicks: The number of users who clicked a link, profile, or CTA. Shows traffic-driving ability.
Click-Through Rate (CTR): Clicks divided by impressions. Measures how compelling the content or CTA was.
Conversions: Purchases, sign-ups, downloads, inquiries, or other desired actions. Connects social activity to business results.
Conversion Rate: The percentage of clicks or visits that resulted in a conversion. Helps assess landing page and offer effectiveness.
Follower Growth: Net gain or loss of followers during the period. Useful, but should not dominate the report.
Video Views / Completion Rate: Important for video-heavy campaigns and short-form content performance.
Cost Per Result: For paid campaigns, shows efficiency in generating clicks, leads, or conversions.
Return on Investment (ROI): Revenue or value generated relative to spend. Critical for leadership and client reporting.
Platform-specific metrics also matter. For example:
Instagram: Saves, profile visits, story exits, Reel plays
LinkedIn: CTR, company page engagement, lead form completions
YouTube: Average view duration, subscriber growth, traffic source
X / Twitter: Engagement rate, profile clicks, reposts
Context notes are equally important. If impressions spike because of one viral post, say so. If engagement drops during a holiday week or after a posting schedule change, document it. That context protects the credibility of the report and makes the data actionable.
How reporting goals change by audience
A report should never be one-size-fits-all. The same campaign data should be framed differently depending on who is reading it.
Internal team updates focused on performance and next steps
Internal teams need detail they can act on. They want to know:
Which content formats worked
Which channels underperformed
Where CTR or conversion rates changed
What tests should be run next
These reports can go deeper into content categories, posting frequency, audience behavior, and tactical adjustments.
Leadership summaries centered on ROI, trends, and business impact
Executives do not need ten pages of post-level data. They need a concise summary of:
Business outcomes
Trend direction
Channel efficiency
Budget impact
Strategic recommendations
A leadership report should lead with business metrics and use social engagement as supporting evidence, not the headline.
Client-ready reports that balance clarity, polish, and accountability
Clients want proof of value, but they also need a clean and understandable narrative. A client-ready social media marketing report should include:
Branded formatting
Clear KPI summaries
Plain-language commentary
Highlights and concerns
Specific actions and ownership
That balance builds trust. It shows you are not hiding weak spots, but also not drowning the client in raw analytics.
How to create a social media marketing report step by step
Creating a report becomes much easier when you treat it as a repeatable operating process rather than a one-off task.
1. Gather data from each platform and analytics tool
Start by collecting data from all relevant sources, such as:
Native social platform analytics
Ad managers
Web analytics platforms
CRM or lead tracking systems
URL tracking tools
Be careful with inconsistent date ranges, attribution windows, and metric definitions. One of the fastest ways to lose trust in a report is to combine metrics that were measured differently.
Monthly reporting is ideal for active teams managing multiple channels and campaigns that need ongoing adjustment.
When a quarterly report gives better strategic insight
Quarterly reporting is better when you want:
Larger trend visibility
Cross-campaign learning
Strategic planning support
More stable performance patterns
Quarterly reports are especially useful for leadership reviews and long-cycle B2B campaigns where results take time to mature.
How to align the timeline with campaign objectives and stakeholder expectations
The best reporting cadence depends on business reality. If stakeholders expect monthly accountability, use monthly reports. If the campaign goal is long-term demand generation, add quarterly trend analysis to avoid overreacting to short-term fluctuation.
A practical model is:
Report Type
Best Use
Primary Audience
Monthly
Tactical optimization
Marketing team, managers
Quarterly
Strategic review and planning
Leadership, directors
Client-ready
Communication and accountability
Clients, account stakeholders
Turn metrics into insights
Metrics become valuable only when they explain performance and guide decisions.
Separate vanity metrics from meaningful business results
Vanity metrics can still be included, but they should not dominate the narrative. Follower growth looks positive, but if clicks and conversions are flat, the business impact may be limited.
Prioritize metrics that support the campaign objective:
Identify trends, wins, losses, and contributing factors
A good report highlights:
What improved
What declined
Which channels or content types drove the shift
Whether the change is temporary or structural
This is where a consultant mindset matters. Do not simply note that engagement rose 18%. Explain whether it came from better creative, stronger timing, increased paid support, or a one-off spike.
Explain what happened, why it happened, and what to do next
This is the core reporting formula:
What happened: LinkedIn CTR increased from 1.8% to 2.6%.
Why it happened: Thought leadership posts with stronger hooks and clearer CTAs outperformed standard company updates.
What to do next: Shift next month’s content mix toward executive insight posts and replicate high-performing formats.
Common reporting mistakes to avoid
Even experienced teams make these mistakes.
Listing numbers without interpretation
A spreadsheet is not a report. Every key metric should include commentary that explains significance.
Overloading the report with too many charts or metrics
More charts do not create more clarity. If a metric does not influence a decision, remove it.
Ignoring audience, goals, or channel differences
A leadership summary should not read like a channel audit. A TikTok performance page should not use the same lens as a LinkedIn lead gen report. Good reporting respects the context of each audience and platform.
Monthly, quarterly, and client-ready social media marketing report templates
Templates save time, improve consistency, and reduce reporting errors. A reusable social media marketing report template should make it easy to update data while preserving structure and storytelling quality.
The most effective template systems support different reporting needs without forcing teams to rebuild from scratch every cycle.
Monthly report template structure
A monthly report should be compact, practical, and optimization-focused.
Executive summary
Start with a short summary that includes:
Top wins
Biggest concerns
KPI progress
One to three immediate next steps
Channel-by-channel performance snapshot
For each platform, include:
Reach and impressions
Engagement and engagement rate
Clicks and CTR
Conversions if applicable
Change versus previous month
Top content, lessons learned, and next-step recommendations
This section should show:
Best-performing posts or campaigns
Lowest-performing items and possible reasons
Recommended tests or adjustments for next month
A simple monthly template keeps the team focused on action rather than reporting theater.
Quarterly report template structure
A quarterly report should widen the lens and show trends that monthly snapshots can miss.
Broader trend analysis across campaigns and platforms
Include:
Three-month trend lines
Channel contribution over time
Performance by campaign objective
Content format trends
Goal progress, benchmark comparisons, and strategic takeaways
This is where you compare actual results to:
Quarterly goals
Historical performance
Internal benchmarks
Industry expectations where relevant
Priority actions for the next quarter
Focus on decisions such as:
Reallocating spend
Changing channel emphasis
Revising content strategy
Improving conversion paths
Client-ready report template structure
A client-ready report should be easy to present and easy to trust.
The best client-ready reports do not stop at reporting. They define next actions with responsibility and timing.
For example:
Recommendation
Owner
Deadline
Launch new Reel creative test
Social team
Next 2 weeks
Increase paid budget on top-performing audience
Paid media manager
Next cycle
Revise landing page CTA for lower-funnel campaign
Web team
End of month
Examples of strong social media social media marketing report
A strong report is persuasive because it is selective, clear, and tied to decisions. It does not attempt to show everything. It shows what matters.
What effective report examples have in common
Clear objectives and a logical narrative
Every strong report follows a clean narrative:
Objective
Results
Analysis
Recommendation
That structure helps the reader understand not just performance, but meaning.
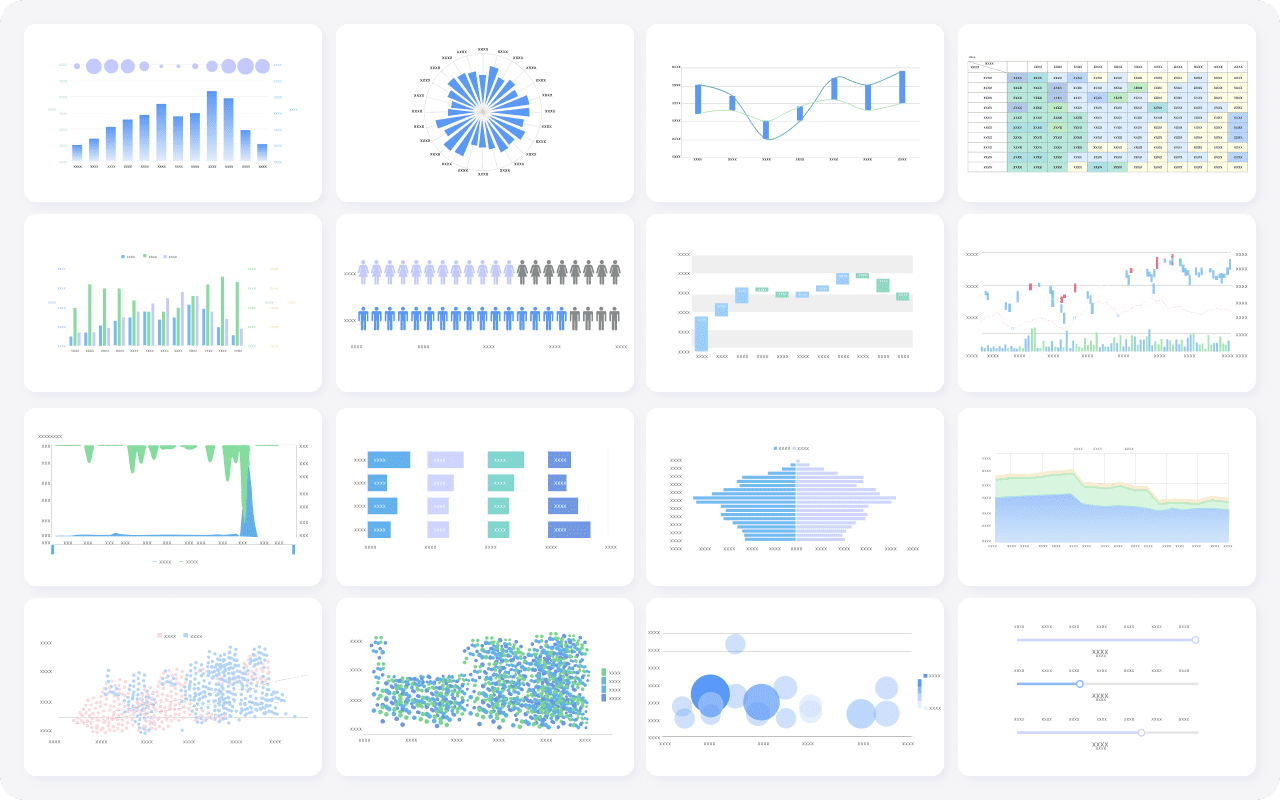
Visuals that support the message instead of distracting from it
The best reports use visuals to speed understanding. They do not fill pages with decorative charts. A chart should answer a question at a glance.
Good examples include:
KPI scorecards for top-line performance
Trend charts for change over time
Channel comparison bars for budget or results
Annotated visuals for spikes and dips
Actionable conclusions tied to business goals
A report becomes persuasive when conclusions are tied to outcomes such as leads, sales, pipeline, brand reach, or customer engagement. The takeaway should help someone decide what to fund, stop, improve, or test.
How to adapt a template to your workflow
No template should be rigid. It should be standardized enough to save time and flexible enough to fit your operating model.
Adjust sections for agency, in-house, or freelance reporting
Agency reporting often needs branded presentation, SLA visibility, and client-facing recommendations.
In-house reporting usually goes deeper on cross-team execution and performance optimization.
Freelance reporting often benefits from simple, polished summaries that prove value efficiently.
Add platform-specific pages only when they support decision-making
Do not add an extra page for every platform by default. Add depth only where the platform materially affects decisions.
Standardize recurring elements to save time each cycle
Keep these consistent:
KPI names
Metric definitions
Date range formatting
Channel order
Chart styles
Commentary format
That consistency allows faster reporting and easier comparison.
How to interpret results and present next steps in a social media marketing report
Interpretation is where a report becomes strategic. Without it, stakeholders are left with numbers but no direction.
Questions to ask when reviewing performance
These questions help transform data into decisions.
Which channels drove the best results for the goal?
The answer depends on the objective. A high-reach platform is not automatically the best performer if the campaign goal was lead generation.
What content patterns appeared across the reporting period?
Look for themes in:
Format
Tone
Topic
CTA type
Posting time
Audience segment
Patterns are more valuable than isolated wins.
Which metrics improved, declined, or stayed flat, and why?
This question forces a deeper review of creative quality, targeting, budget allocation, timing, seasonality, and funnel experience.
How to make reports easier to understand
Clarity is a competitive advantage in reporting.
Use short summaries before detailed data sections
Start each major section with a two- or three-line summary so readers understand the takeaway before seeing the detail.
Label charts clearly and keep terminology consistent
If one page says “engagement rate” and another says “interaction rate” for the same formula, confusion follows. Standardize language.
Focus each section on decisions, not just description
A good section should help the reader answer:
What does this mean?
What changed?
What should we do next?
Build smarter social media reporting with FineReport
Building this manually is complex; use FineReport to utilize ready-made templates and automate this entire workflow.
If your team is still stitching together exports from multiple social platforms, copying KPIs into slides, and rewriting the same commentary every month, the reporting process is already costing too much time and consistency. FineReport helps solve that by turning your social media marketing report into a repeatable, automated system.
Connect data from multiple sources into one dashboard
Standardize monthly, quarterly, and client-ready reporting templates
Visualize KPIs with executive-friendly charts and scorecards
Build drill-down channel views without cluttering summary pages
Keep branding, metric naming, and layouts consistent across reports
Deliver faster updates with less manual formatting
This matters for enterprise teams, agencies, and growing marketing departments that need reporting to be both accurate and scalable. Instead of rebuilding reports every cycle, you create a workflow once and improve it over time.
Get Ready-to-Use Dashboard Templates in Fine Gallery
After your best practices and template structure are in place, the next step is automation. That is where FineReport becomes the practical enabler, not just another reporting tool.
A high-performing social media marketing report should do more than summarize the past. It should help your team make better decisions for the next month, the next quarter, and the next stakeholder conversation. FineReport makes that process faster, cleaner, and far more scalable.
A strong report should cover the reporting period, goals, KPIs, platform performance, trend comparisons, key content results, context for changes, and clear next steps. The goal is to explain what happened, why it happened, and what to do next.
The most important metrics depend on your objective, but common ones include reach, impressions, engagement rate, clicks, conversions, conversion rate, follower growth, and ROI. Paid campaigns should also track cost per result and overall efficiency.
Tailor the report to the audience by leading with business impact instead of raw platform data. Executives usually want ROI, trends, and budget impact, while clients also need clear commentary, accountability, and recommended actions.
Most teams create reports monthly or quarterly, depending on campaign pace and stakeholder needs. Monthly reports help with ongoing optimization, while quarterly reports are better for bigger trend and ROI reviews.
A template works well when you need a consistent structure for recurring reports and manual reporting is still manageable. A dashboard tool becomes more useful when you need faster updates, cleaner visuals, automated data collection, or client-ready reporting at scale.
Product Trial
FineReport
Pixel-perfect reports · Interactive dashboards · Easy data entry · Digital twins