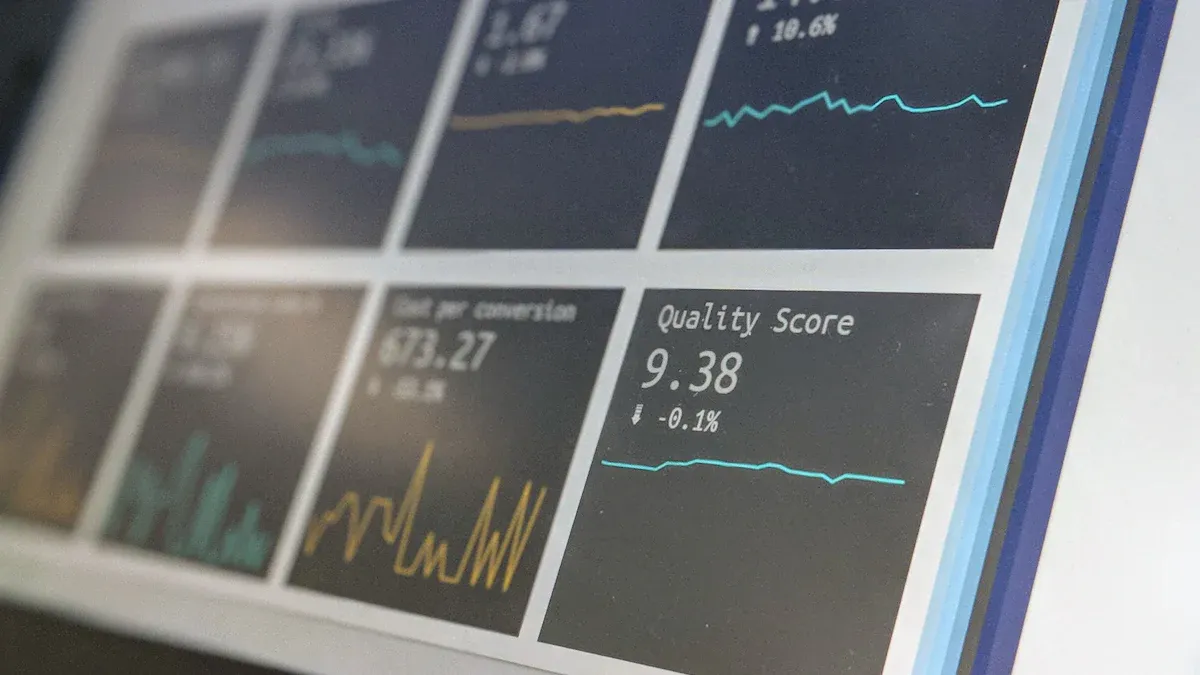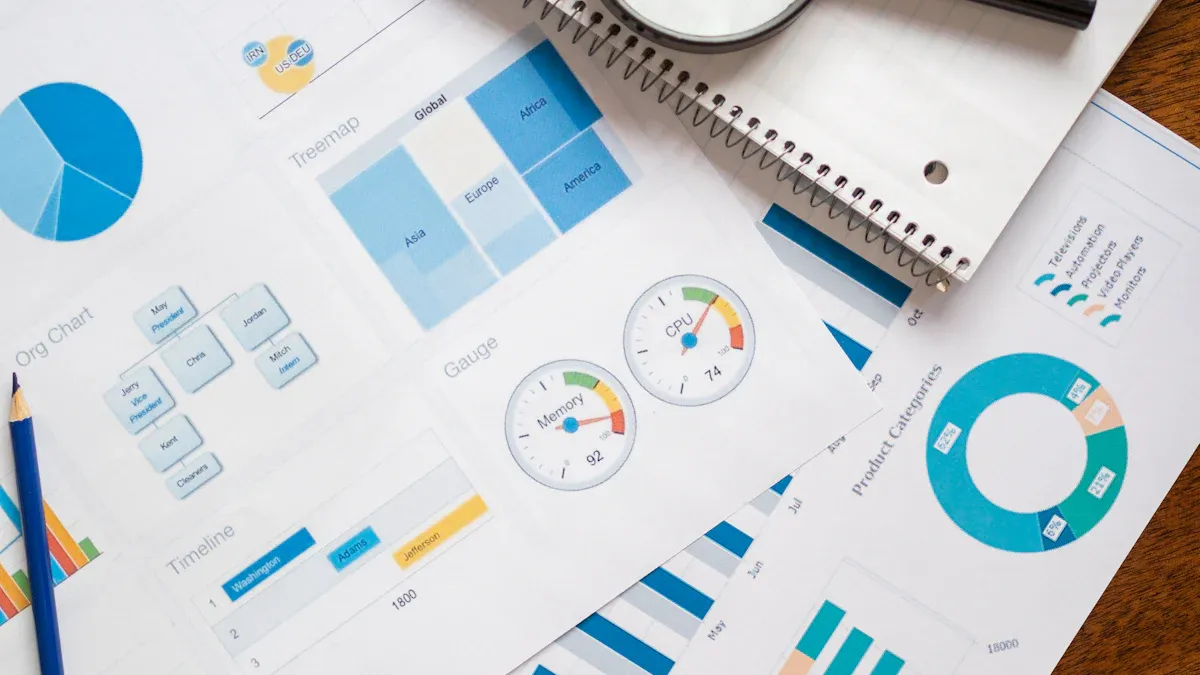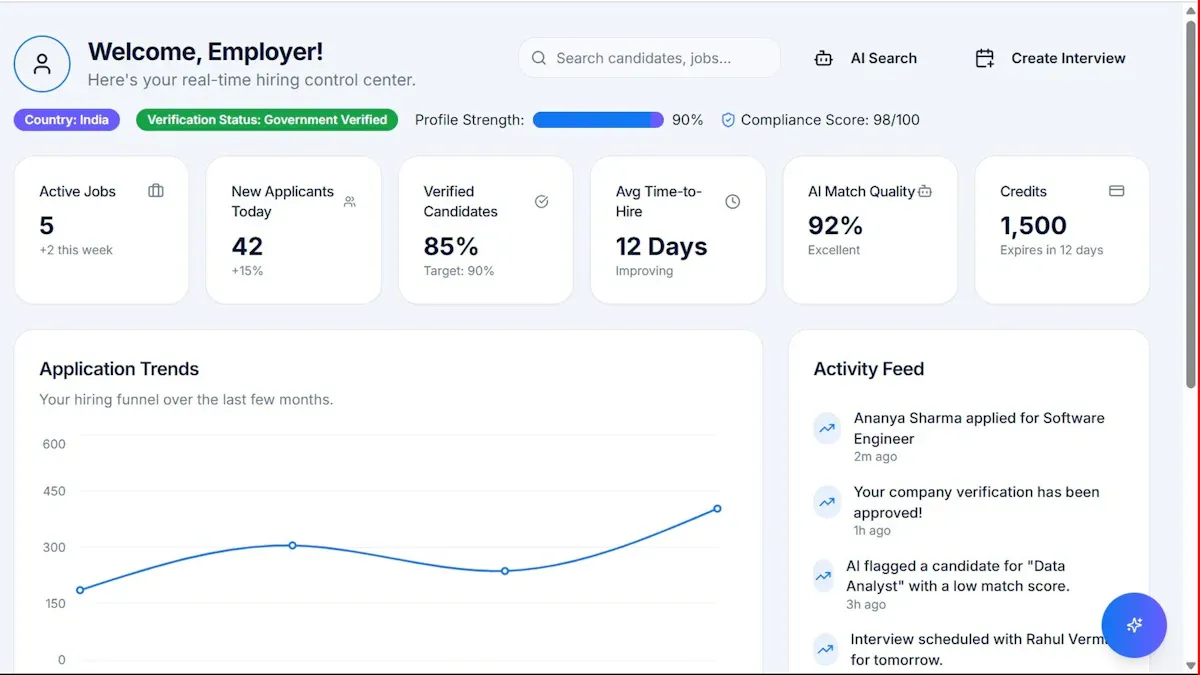

Creating a financial report sample means organizing your business’s key financial data into a clear, professional format. Effective financial reporting builds credibility and helps you make better decisions. For a small business, challenges such as verifying accuracy, managing data across systems, and maintaining compliance often complicate financial reporting. Errors in these areas can disrupt business operations or even damage relationships with suppliers. With the right approach, you can overcome these obstacles and streamline your financial reporting process—even if you lack an accounting background.
Getting Started with Financial Report Sample
Before you create a financial report sample, you need to lay a solid foundation. The initial steps involve setting clear objectives, choosing the right reporting period, and selecting a tool that fits your business needs. Aligning your report with both your business goals and regulatory requirements ensures accuracy and relevance.
Define Your Reporting Goals
Start by identifying what you want your financial report sample to achieve. Setting clear objectives helps you focus on the most important data for your business. Common goals include:
| Objective | Description |
|---|---|
| Evaluating Profitability | Offering insights into net income and profit margins. |
| Assessing Revenue and Expense Management | Providing detailed information on revenue generation and expense control. |
| Supporting Financial Analysis and Decision-Making | Assisting investors, creditors, and management in understanding performance trends and making informed decisions. |
Transparent reporting builds trust with stakeholders. When you define your goals, you ensure your financial report sample remains relevant and faithfully represents your business performance.
Note: Financial reports are essential for regulatory compliance. Many businesses must file regular financial statements, including annual and quarterly reports, to meet industry-specific regulations.
Choose a Reporting Period
Selecting the right reporting period is crucial for your business. The period you choose—monthly, quarterly, or annually—should reflect your business cycle and meet legal or regulatory requirements.
| Evidence | Description |
|---|---|
| Legal requirements | The choice of a reporting period can be influenced by legal requirements, taxation considerations, industry practices, or the preferences of management and stakeholders. |
| Regulatory compliance | Obtaining regulatory compliance and high-quality financial reporting is essential for firms, ensuring the veracity of their data. |
| Awareness of regulations | CFOs and financial leaders must stay updated on regulations to ensure accurate reporting and avoid penalties, impacting accounting processes. |
Stay informed about regulations that affect your business. This awareness helps you avoid penalties and ensures your financial report sample meets all necessary standards.
Select a Reporting Tool (e.g., FineReport)
Choosing the right tool streamlines the process of creating your financial report sample. Many businesses use solutions like QuickBooks Online, Zoho Books, Xero, FreshBooks, Sage 50cloud, Wave Accounting, Fathom, GnuCash, SAP Business One, and HisabKitab.co. These tools offer a range of features, from basic reporting to advanced analytics.
FineReport stands out for its ability to automate report generation, integrate data from multiple sources, and provide real-time visualization. With FineReport, you can create highly formatted, dynamic reports that support your business’s decision-making process. The platform adapts to your business size and complexity, making it a strong choice for both small and growing enterprises.

Key Sections of a Financial Report Sample
A well-structured financial report sample provides a comprehensive overview of your business’s financial health. Each section serves a specific purpose and follows established accounting standards. FineReport streamlines the process by automating data integration and visualization, ensuring your financial statements remain accurate and easy to interpret.
Executive Summary
The executive summary offers a concise overview of your business’s financial position. You should use this section to highlight key performance indicators, major trends, and significant changes over the reporting period. This summary enables stakeholders to quickly grasp the overall financial health and strategic direction of your organization. By focusing on essential insights, you help decision-makers identify critical issues and opportunities without sifting through complex data.
FineReport allows you to automate the generation of executive summaries by pulling real-time data from your financial statements. You can use dashboards and visualizations to present trends and KPIs, making the summary both informative and visually engaging.

Financial Statements Overview
The financial statements overview introduces the key components of the financial report. You should include a brief description of each statement and explain their relevance to your business. Standard components include:
- Balance sheet
- Income statement
- Cash flow statement
- Statement of changes in equity
- Notes to the financial statements
- Segment reporting
This section sets the stage for the detailed analysis that follows. FineReport can integrate data from multiple sources, ensuring your overview remains consistent and up to date across all statements.
Income Statement
The income statement details your business’s financial performance over a specific period. You should include the following elements:
- Revenue: Total earnings from sales, services, or other sources
- Cost of goods sold (COGS): Direct costs associated with delivering products or services
- Gross profit: Revenue minus COGS
- Operating expenses: Recurring costs such as salaries, rent, and utilities
- Operating income: Profit after subtracting operating expenses from gross profit
- Interest and taxes: Payments to lenders and government authorities
- Net income: Remaining profit after all expenses, interest, and taxes
- Earnings per share (EPS): Net income per outstanding share (for public companies)
Present this information in a clear, tabular format. FineReport enables you to prepare financial statements like the income statement by automating calculations and visualizing trends, making it easier to track revenue and expenses across different periods.

Balance Sheet
The balance sheet provides a snapshot of your business’s financial position at a specific point in time. You should list all assets, liabilities, and shareholders’ equity. Key items include:
- Assets: Cash, accounts receivable, inventory, equipment, investments
- Liabilities: Accounts payable, loans, debts
- Shareholders’ equity: Common and preferred shares, retained earnings
Organize the balance sheet into sections for assets, liabilities, and equity. Ensure clarity and compliance by accurately classifying each item and cross-referencing with other financial statements. FineReport supports the preparation of balance sheets by integrating data from various sources and validating entries, which helps you maintain accuracy and regulatory compliance.
Cash Flow Statement
The cash flow statement tracks the movement of cash in and out of your business. This statement helps you assess liquidity and operational efficiency. Important metrics to include are:
| Metric | Description | Formula |
|---|---|---|
| Free cash flow | Cash remaining after operating and capital expenditures | Operating cash flow − capital expenditures |
| Operating cash flow ratio | Effectiveness in generating cash from daily operations | Operating cash flow / current liabilities |
| Cash flow margin | Efficiency in converting sales to cash flow | Operating cash flow / sales × 100 |
| Cash flow to debt ratio | Ability to cover debt with cash from operations | Total debt / operating cash flow |
| Working capital | Ability to manage short-term obligations | Current assets − current liabilities |
FineReport automates the preparation of cash flow statements by consolidating data from your accounting systems. You can visualize cash inflows and outflows, making it easier to identify trends and potential issues.

Key Metrics and Ratios
Key metrics and ratios provide deeper insights into your business’s performance. Common categories include:
| Category | Examples of Ratios |
|---|---|
| Profitability | Net Profit Margin, Return on Equity |
| Activity | Inventory Turnover, Receivables Turnover |
| Liquidity | Current Ratio, Quick Ratio |
| Leverage | Debt to Equity Ratio |
| Market Value | Price Earnings Ratio |
You should analyze these ratios to benchmark your business against industry standards and identify trends. FineReport can calculate and display these ratios automatically, allowing you to monitor performance in real time.
Budget vs. Actuals
The budget vs. actuals section compares your projected financial outcomes with actual results. You should present:
- Budgeted income and expenses for the period
- Actual income and expenses from the income statement and balance sheet
- Variance analysis to highlight differences
This comparison helps you understand where your business met or missed expectations. FineReport simplifies this process by linking budget data with actuals, generating variance reports, and visualizing discrepancies for quick analysis.
Forecasts and Projections
Forecasts and projections estimate your business’s future financial performance. You can use both quantitative and qualitative methods:
| Method Type | Description | Examples/Techniques |
|---|---|---|
| Quantitative | Uses historical data and mathematical models | Time Series Analysis, Regression Analysis |
| Qualitative | Relies on expert opinions and subjective evaluations | Delphi Method, Market Research, Scenario Analysis |
You should select the method that best fits your business context. FineReport supports the creation of forecasts and projections by integrating historical data, applying forecasting models, and visualizing future trends. This capability helps you prepare for upcoming challenges and opportunities.
By including these key components of the financial report, you ensure your financial report sample meets accounting standards and provides actionable insights. FineReport’s automation and visualization features make it easier to prepare financial statements, maintain accuracy, and present data in a format that supports informed decision-making.

How to Prepare Financial Statements as Financial Report Sample

Preparing financial statements for your business requires a systematic approach. You must ensure accuracy, consistency, and compliance throughout the process. The following steps will guide you as you prepare financial statements that support informed decision-making and reflect your business’s true financial position.
Gather and Verify Data
You begin financial statement preparation by collecting comprehensive financial data. This includes income, expenses, assets, and liabilities. Move this data through journals into ledgers, ensuring every transaction is recorded. Use an adjusted trial balance to confirm the accuracy of your numbers before constructing the actual financial statements.
To prepare financial statements effectively, follow these steps:
- Reconcile your data. Make sure all financial records match and resolve any discrepancies.
- Standardize your process. Establish reporting methodologies and confirm standards for consistency.
- Validate your results. Confirm the accuracy of assembled statements through various checks.
You must collect all relevant financial information, including individual transactions and totals. Accurate data forms the foundation for reliable financial statements. When you prepare financial statements, you reduce the risk of errors and improve the credibility of your business.
Common errors during financial statement preparation include misclassified assets and liabilities, errors in cash flow classification, incomplete disclosures, and mixing personal with business expenses. You can avoid these mistakes by implementing strong internal controls, performing regular reconciliations, and leveraging technology to flag discrepancies.
Tip: Always review your financial statements before analysis. Neglecting this step can result in overlooked errors and misrepresented business performance.
Organize and Format Information
Once you gather and verify your data, you must organize and format it for clarity. High-quality financial data provides a solid foundation for making informed investment and business decisions. Accurate organization allows analysts and investors to perform reliable financial modeling, valuation, and forecasting.
To prepare financial statements with precision, you should:
- Implement standardized workflows. This reduces manual data entry and enhances consistency.
- Automate data collection. Use tools that allow real-time access to reports.
- Review financial statements before analysis. This step ensures accuracy and completeness.
Proper organization and formatting help you present financial statements that are easy to interpret. You improve the accuracy of your financial analysis and support strategic planning for your business. When you prepare financial statements with a clear structure, you communicate your business’s financial position effectively.
Use FineReport for Automation
FineReport streamlines the preparation of financial statements for your business. The platform offers a user-friendly design, allowing you to create complex reports through simple drag-and-drop actions. You do not need advanced IT skills to prepare financial statements with FineReport.
FineReport supports integration with various data sources. You can centralize your financial data for business analysis and efficient financial statement preparation. The software facilitates data integration, acquisition, and display, making the preparation of financial statements faster and more accurate.
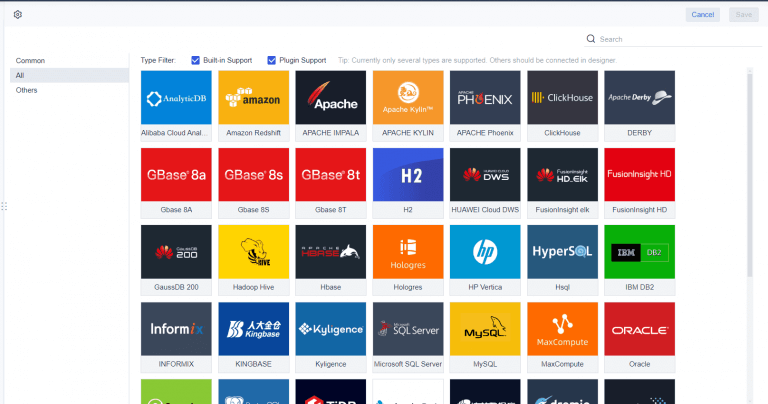
| Feature/Benefit | Description |
|---|---|
| User-friendly design | Allows users to create complex reports through simple drag and drop, making it accessible for non-IT users. |
| Integration capabilities | Supports various data sources and allows centralized data application for business analysis. |
| Efficient data management | Facilitates data integration, acquisition, and display, streamlining the preparation of financial statements. |
When you use FineReport, you automate repetitive tasks and minimize manual errors. The platform validates your data, flags inconsistencies, and ensures your financial statements remain accurate. You can schedule report generation, access real-time data, and customize your financial report sample to meet your business’s needs.
FineReport’s automation features help you prepare financial statements efficiently. You save time, reduce costs, and improve the reliability of your business’s financial reporting. With FineReport, you gain deeper insights into your business’s profit, cash flow, and overall financial health.
Note: Automating financial statement preparation with FineReport supports compliance and enhances transparency. You can focus on strategic analysis rather than manual data entry.
By following these steps and leveraging FineReport, you prepare financial statements that meet industry standards and support your business’s growth. Accurate financial statement preparation empowers you to make better decisions and communicate your business’s financial position with confidence.
Presenting Your Financial Report Sample
Tailor to Your Audience
When presenting your financial report sample, you must tailor the presentation to your audience. Start by defining your objective for the presentation. Create an outline that structures your content logically. Segment your audience into groups such as executives, analysts, or department heads. Customize the content for each group by selecting relevant data and examples. Craft compelling narratives that turn numbers into stories, making the financial report sample memorable and engaging.
- Conduct an audience analysis to understand their background and preferences.
- Adjust your language and tone to match the audience’s level of financial expertise.
- Provide a high-level summary for executives, focusing on key metrics.
- Offer detailed financial data for analysts who require deeper insights.
This approach ensures your financial report sample resonates with each stakeholder and supports effective decision-making.
Use Clear Visuals and Layouts
Clear visuals and layouts enhance the readability of your financial report sample. Organize information using tables, charts, and bullet points. Consistent formatting helps readers navigate the presentation and focus on the content. Strategic visuals, such as graphs and dashboards, illustrate key points and improve retention.
| Aspect | Explanation |
|---|---|
| Organizing Information | Clear visuals structure complex data, making it easier to follow. |
| Consistent Formatting | Uniform design aids navigation and comprehension. |
| Strategic Visuals | Charts and graphs highlight important trends and results. |
| Clear Labeling and Headings | Descriptive headings guide readers and provide context. |
| Breaking Down Complexity | Bullet points and short paragraphs simplify complex ideas. |
Use descriptive headings and concise paragraphs to break down complex financial data. This method supports effective financial statement presentation and helps you communicate profit, cash flow, and other critical metrics.
Leverage FineReport Dashboards
FineReport elevates your financial report sample by offering advanced dashboard and visualization features. You can drag and drop components to build interactive dashboards quickly. The platform adapts to different screen sizes, ensuring your presentation looks professional on any device. Intelligent layout arrangements enhance the user experience, while multi-dimensional analysis enables you to monitor key business indicators in real time.
| Feature | Description |
|---|---|
| Drag Components | Easily create dashboards with flexible drag-and-drop tools. |
| Screen Size Adaptability | Dashboards adjust to various devices for optimal viewing. |
| Intelligent Layout | Smart arrangement of components for clarity and impact. |
| Multi-Dimensional Analysis | Analyze business indicators from multiple perspectives. |
| Real-Time Monitoring | Track key metrics as they happen for timely decisions. |
| Multi-Terminal Display | Access dashboards on mobile devices for on-the-go monitoring. |
By leveraging FineReport, you streamline presenting financials and enhance the impact of your financial report sample. The platform supports crafting the presentation with clear visuals, real-time data, and interactive elements. These features help you deliver a financial presentation that meets the needs of your business and audience. Use these presentation tips to ensure your financial report sample stands out and drives better business outcomes.
Best Practices and Common Challenges in Financial Report Sample
Ensure Data Accuracy
You must prioritize data accuracy when preparing your annual report. Accurate financial statements form the backbone of your business’s credibility and support effective management discussion and analysis. To maintain high standards in your annual report, follow these best practices:
- Use specialized software for financial reporting to streamline your annual report process and reduce manual errors.
- Ensure every team member understands accounting policies, which minimizes mistakes in your annual report and financial statements.
- Maintain transparency by granting relevant staff access to financial data, supporting accountability in your annual report.
- Log all transactions consistently, creating a reliable foundation for your annual report and financial statements.
- Conduct regular reviews and reconciliations to catch discrepancies early in your annual report cycle.
- Review financial statements frequently to identify unusual trends in your annual report.
- Invest in training for your accounting team to improve the accuracy of your annual report.
- Implement strong data validation practices to eliminate inefficiencies in your annual report process.
These steps help you deliver an annual report that meets compliance standards and accurately reflects your business’s financial performance.
Address Common Pitfalls
Many businesses encounter recurring challenges when preparing an annual report. You can avoid these pitfalls by staying vigilant:
- Not forecasting cash flow in your annual report can lead to financial shortfalls.
- Failing to report on profitability in your annual report hinders management discussion and analysis.
- Inefficient recordkeeping creates errors and compliance risks in your annual report.
- Lack of budgeting and planning in your annual report may result in overspending.
- Overlooking small transactions in your annual report can accumulate into significant losses.
By addressing these issues, you strengthen your annual report and ensure your financial statements provide a true picture of your business.
Automate Reporting with FineReport
FineReport transforms your annual report process by automating data integration and validation. The platform’s error handling systems and machine learning algorithms detect anomalies in your annual report, reducing manual errors in your financial statements. Regular staff training and a culture of accountability further enhance your annual report’s reliability. Systematic processes and automated checks ensure consistency in your annual report, supporting accurate management discussion and analysis.
With FineReport, you streamline your annual report workflow, minimize errors, and present financial performance with confidence. Automation allows you to focus on strategic decisions, knowing your annual report and financial statements are accurate and compliant. This approach helps your business achieve sustainable profit and growth.
Financial Report Sample Template

Example Layout
You can use the following example layout as a starting point for your financial report sample template. This structure covers the essential components that small businesses need to monitor financial health and performance:
- Operating cash flow: Track cash generated from your core business activities.
- Investing cash flow: Record purchases or sales of fixed assets and other investments.
- Financing cash flow: Include loan proceeds, repayments, and equity changes.
- Current assets: List cash, receivables, and inventory.
- Current liabilities: Show payables and short-term debt.
- Long-term assets and liabilities: Document equipment, loans, and mortgages.
- Equity: Capture owner investment and retained earnings.
- Invoice age buckets: Organize receivables by 0–30, 31–60, 61–90, and 90+ days.
- Total outstanding: Sum receivables in each bucket.
- Customer name and invoice details: Provide clarity on outstanding amounts.
- Budgeted revenue and expenses by category: Set expectations for the period.
- Actual results: Match actuals line by line with the budget.
- Variance analysis: Highlight dollar and percentage differences.
- Projected receipts: Estimate future cash from sales and receivables.
- Planned disbursements: Plan for payroll, payables, and capital expenses.
- Net forecast: Predict your cash position for the next 30–90 days.
- Current ratio: Measure liquidity by dividing current assets by current liabilities.
- Gross margin: Calculate (revenue minus COGS) divided by revenue.
- Return on assets (ROA): Divide net income by total assets.
- Debt-to-equity ratio: Divide total liabilities by total equity.
This template gives you a comprehensive view of your business’s financial position, helping you analyze cash flow, liquidity, and profit.
Customization Tips
You can tailor your financial report sample template to fit your business needs using FineReport’s flexible features. Follow these steps to create a template that aligns with your goals:
- Design your template by connecting FineReport to your database and defining the necessary data fields. Choose the database type and enter access credentials to ensure accurate data integration.
- Set parameters for data queries and filtering. FineReport allows you to customize reports based on specific business requirements, making your template more relevant.
- Select the appropriate report design method. FineReport supports ordinary template design, aggregate report design, and decision report design. Choose the method that best matches your reporting objectives.
FineReport's template capabilities enable you to automate data collection, streamline reporting, and present financial information in a clear, actionable format. By customizing your financial report sample template, you ensure that your reports deliver the insights your business needs to drive growth and improve decision-making.
To create professional financial statements for your business, you need to understand your company’s financial activity, track and analyze performance, and document significant transactions. Use these reports to inform stakeholders and support decisions. After preparing your financial statements, close accounts and transfer balances as needed. FineReport offers real-time analysis, self-service tools, and integration with BI systems, making reporting efficient for any business. Clear financial statements build trust, help you demonstrate profit, and support long-term growth.
Continue Reading About Financial Report Sample
What Is a Quarterly Report and Why Investors Should Care
How to Use Inventory Report for Better Business Decisions
How to Build a Service Report Template for Your Business
What Is a Research Report and Why Does It Matter
What Is an Interview Report and Why Does It Matter
How to create a monthly sales report that drives results

Frequently asked questions
A financial report sample shows how to organize and present your business’s financial data. You need one to communicate your financial health, support decision-making, and meet regulatory requirements. Using a sample ensures your reports follow best practices and industry standards.