A crm dashboard is a visual tool that helps you track, analyze, and manage customer relationships in one place. To create a powerful dashboard, define your business goals, select the right KPIs, pick a user-friendly tool like FineReport, and start building. Many businesses see improved sales revenue—45% report growth—when they use an effective crm. Real-time insights let you make smarter decisions and adjust your strategy quickly.
CRM Dashboard Essentials
Key Features for a CRM Dashboard
When you build a crm dashboard, you want it to be both powerful and easy to use. Most top-performing companies include these core components in their crm dashboards:
Visualization: Show your data in clear charts and graphs.
Customization: Adjust the dashboard to fit your team’s needs.
Real-time Data: See instant updates on important metrics.
Usability: Make sure everyone can interact with the dashboard easily.
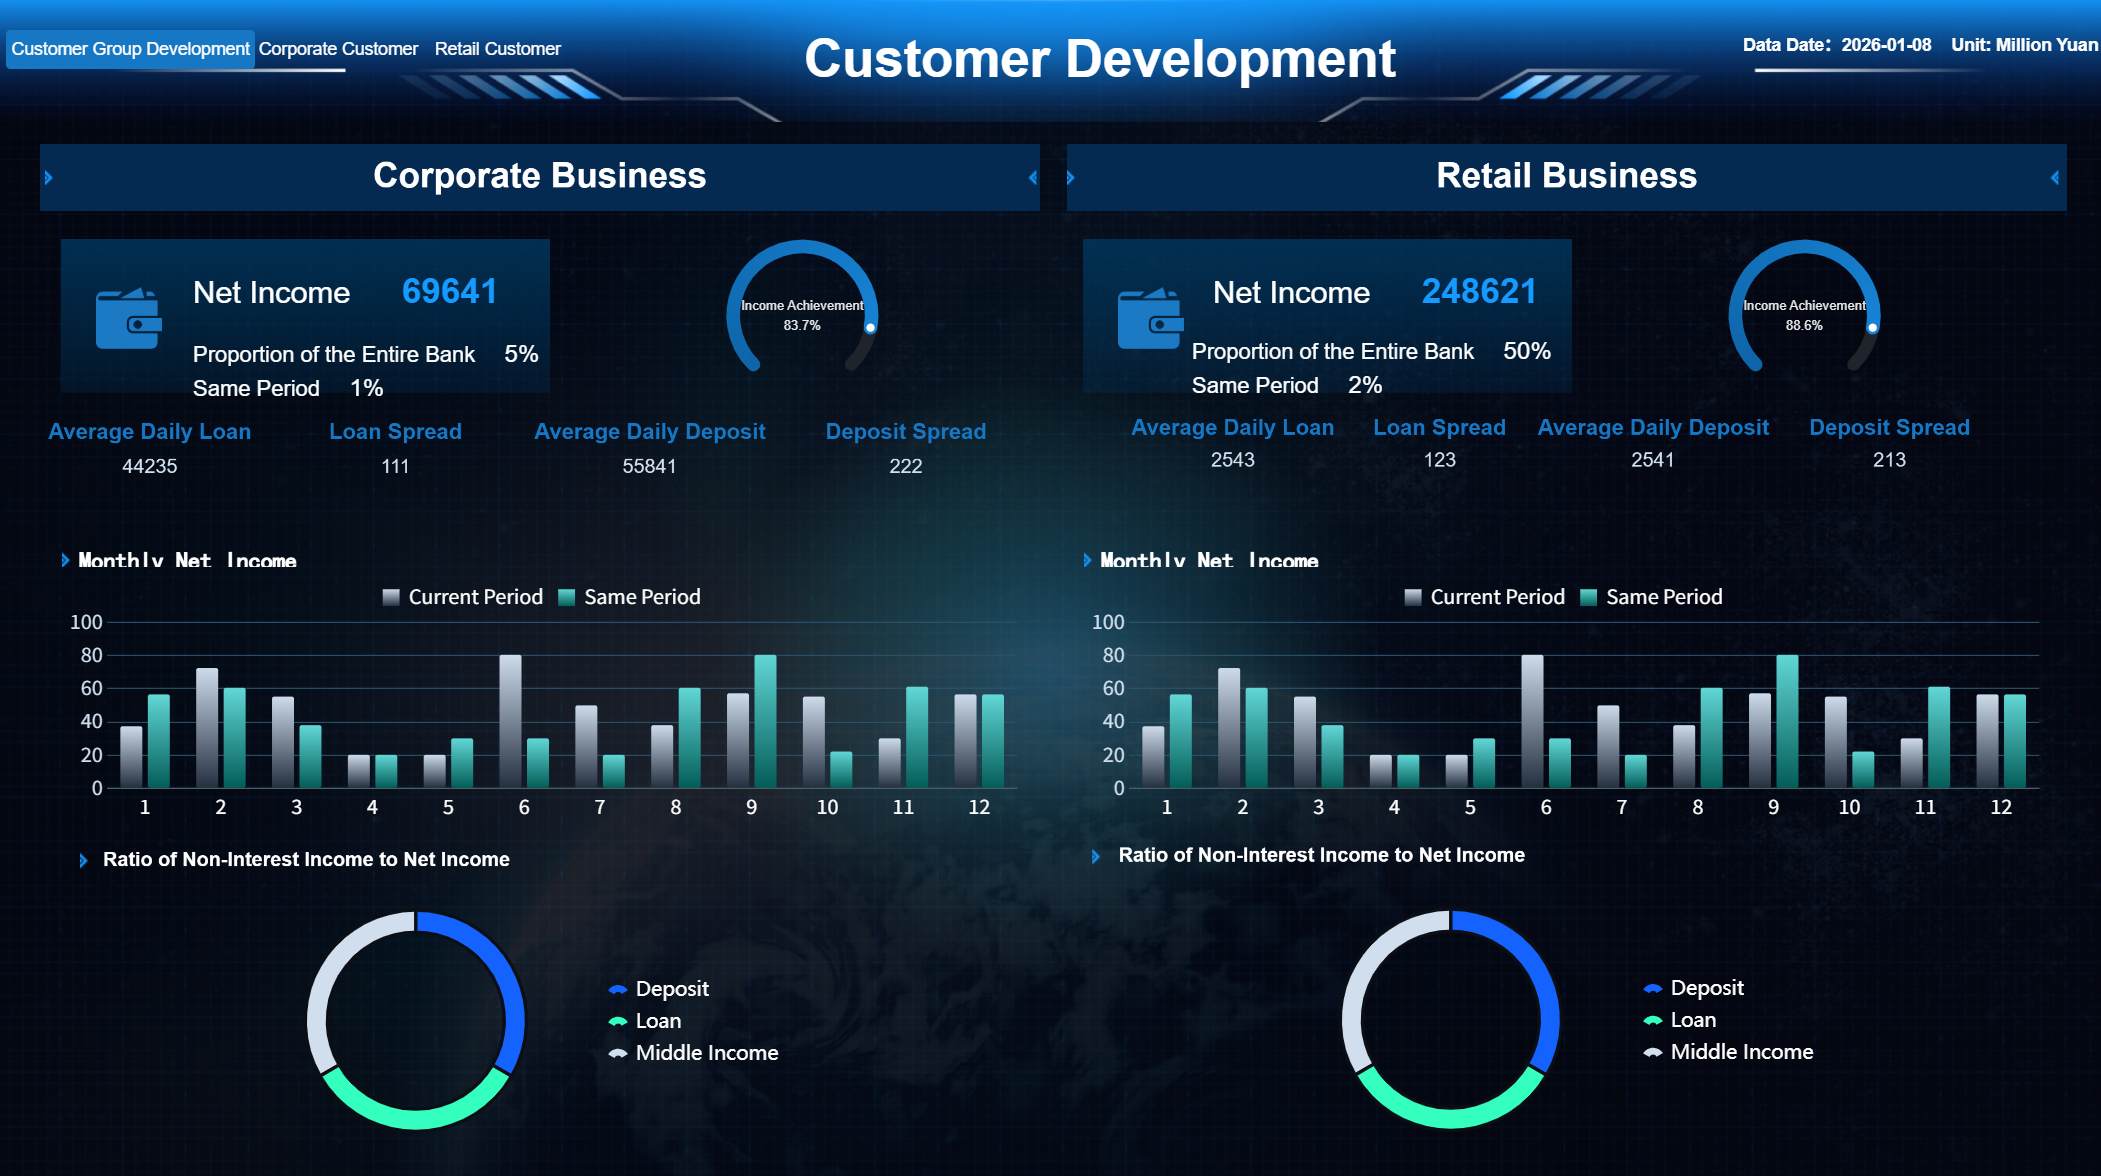
CRM Dashboard created by FineReport (Click to Engage)
You also need automation capabilities to save time, communication tools to keep your team connected, and analytics to help you understand your business. Sales pipeline management lets you track deals from start to finish. Integration with other tools ensures your crm dashboard fits into your daily workflow. FineReport supports all these features with a drag-and-drop interface, multi-source integration, and mobile accessibility. You can design dashboards that work on any device, so you never miss a key update.
Tracking the right metrics is essential for any crm dashboard. Industry experts recommend focusing on these KPIs:
Customer Satisfaction Score (CSAT): Measure how happy your customers are at different points.
Net Promoter Score (NPS): Find out how likely customers are to recommend your business.
Customer Retention Rate: See how many customers stay with you over time.
Customer Churn Rate: Track how many customers you lose.
Customer Lifetime Value (CLV): Estimate how much revenue each customer brings in.
You can also monitor new leads, active deals, sales forecasts, and sales rep performance. FineReport makes it easy to visualize these KPIs, so you can spot trends and take action quickly.
A crm dashboard works best when it brings all your data together. FineReport connects to many types of databases, spreadsheets, and cloud services. You can pull in customer records, sales numbers, and support tickets from different sources. The drag-and-drop designer lets you combine this data into one dashboard. Mobile access means you can check your crm dashboard anywhere, anytime. With FineReport, you get seamless data integration, real-time updates, and a complete view of your business.
Start by setting clear goals for your crm dashboard. Think about what you want to achieve with your crm. Do you want to track sales performance, improve customer satisfaction, or monitor marketing campaigns? Each business has unique needs, so your dashboard should reflect your priorities.
Customize your crm processes for different markets to boost efficiency.
Use real-time dashboards to track key performance metrics and align your team with business goals.
Analyze your sales cycle in detail to spot bottlenecks and improve your processes.
You can create different types of dashboards based on your objectives:
Operational dashboards help you track daily activities and respond quickly.
Strategic dashboards focus on long-term goals and planning.
Customer dashboards help you improve satisfaction and retention.
Financial dashboards monitor your company’s financial health.
Sales dashboards track sales targets and performance.
Marketing dashboards measure campaign results and lead generation.
When you define your goals, you set the foundation for a crm dashboard that truly supports your business.
Choose FineReport for CRM Dashboards
Select a tool that makes building a crm dashboard easy and effective. FineReport stands out as a top choice for custom crm dashboards. You get a user-friendly drag-and-drop interface, so you can build dashboards without coding. FineReport gives you real-time insights, which means you always see the latest data. You can access your crm dashboard on any device, including your phone or tablet, so you stay connected wherever you go.
FineReport also offers templates that help you get started quickly. You can pick a template that matches your needs and customize it as you go. The platform supports a wide range of data sources, so you can bring all your crm data together in one place.
Tip: Use FineReport’s scheduling feature to automate regular report generation and delivery. This keeps your team updated without extra effort.
Organize and Connect CRM Data
A successful crm dashboard depends on well-organized data. Start by collecting data from all your crm sources, such as sales records, customer feedback, and support tickets. FineReport connects to cloud-based crm databases, spreadsheets, and other systems, so your team can access and update information at the same time. This eliminates version control problems.
Follow these best practices for managing your crm data:
Collect, organize, and maintain high-quality data.
Use AI features in FineReport for automated data entry and validation.
Set permission controls to protect sensitive information while giving team members the access they need.
Regularly update and clean your data to keep it accurate and reliable.
FineReport’s data connectors make it easy to bring all your crm data together. You can link multiple sources and see everything in one dashboard.
Design the Dashboard Layout
The layout of your crm dashboard affects how easily you can understand and use the data. FineReport gives you flexible layout options, so you can design a dashboard that fits your workflow.
Here are some proven design principles for effective dashboards:
Design Principle
Description
Visual Hierarchy
Use size, color, and position to highlight important information.
Customizable Layout
Tailor the dashboard to your needs for better engagement and usability.
Clean UI Design
Keep the interface simple and clear to avoid distractions.
Clarity
Communicate critical data effectively for quick decision-making.
Interactive Elements
Add filters and drill-downs for deeper data exploration.
User-Centric Design
Build around your team’s workflows for maximum relevance and usability.
FineReport’s dashboard layout options let you arrange widgets, charts, and tables in a way that makes sense for your team. You can create multiple pages, use full-screen views, or set up a tiled layout for different types of data visualization.
Add Widgets and Reports
Now it’s time to add widgets and reports to your crm dashboard. FineReport offers a wide range of widgets that help you visualize your crm data:
Chart widgets for trends and comparisons
Metric widgets for key numbers like sales or customer satisfaction
Table widgets for detailed records
Image widgets for branding or product visuals
Progress widgets to track goals
Calendar widgets for scheduling and deadlines
Map widgets for geographic data
Filter widgets to sort and focus on specific data
Notification widgets to alert your team about important updates
You can also add specialized dashboards, such as sales rep performance dashboards or sales call dashboards, to monitor specific areas of your crm. FineReport supports different report types, including row reports, cross reports, and grouped reports, so you can present your data in the most effective way.
Note: Use FineReport’s drag-and-drop designer to quickly add and arrange widgets. You can also use templates to speed up the process.
Test and Refine Your CRM Dashboard
Before you launch your crm dashboard, test it to make sure everything works as expected. FineReport makes it easy to check your dashboard for accuracy and reliability. Use these testing methods to ensure your crm dashboard delivers the best results:
Testing Method
Purpose
Functional Testing
Check that all features work as intended.
Performance Testing
See how the dashboard performs under heavy use.
Integration Testing
Make sure your crm connects smoothly with other tools.
Security Testing
Protect your data and identify any vulnerabilities.
Usability Testing
Ensure the dashboard is easy to use and understand.
Data Migration Testing
Confirm that data moves correctly between systems.
Regression Testing
Verify that updates do not break existing features.
After testing, gather feedback from your team. Make adjustments to improve usability and data visualization. FineReport lets you refine your dashboard easily, so you can keep improving it as your business grows.
By following these steps, you can build a crm dashboard that gives you a complete view of your crm, supports better decision-making, and helps your business succeed.
CRM Dashboard Examples and Use Cases
You can learn best by seeing real crm dashboard examples in action. These examples show how you can use a crm dashboard to solve real business problems and make better decisions. Each example highlights how FineReport helps you organize data, visualize key metrics, and improve your workflow.
Sales CRM Dashboard Example
A sales crm dashboard helps you track your sales process from start to finish. You can see how your team moves leads through the pipeline, which deals close, and where you lose opportunities. FineReport lets you build dashboards that show all your important sales data in one place.
Here are some popular sales crm dashboard examples used by enterprise organizations:
Dashboard Type
Metrics and KPIs Used
Sales Conversion Dashboard
Conversion rate, Top performing landing pages, Top channels by sessions, Sales by campaign, Leads by source, Customer churn rate, Loss rate
Sales Cycle Length Dashboard
Average sales cycle length, Lead conversion rate, Average length of sales stages
Sales KPI Dashboard (Individual)
Opportunities created against target, Lead response time, Average follow-up attempts
You can use FineReport to create these dashboard examples with drag-and-drop tools. For example, you might build a Sales Conversion Dashboard to see which marketing channels bring in the most leads and which campaigns drive the highest sales. You can also track the average time it takes to close a deal with a Sales Cycle Length Dashboard. These dashboards help you spot trends, set goals, and coach your sales team for better results.
Tip: Use FineReport’s filter widgets to drill down into specific sales reps or time periods. This gives you a clear view of what drives your sales success.
Customer Support CRM Dashboard Example
A customer support crm dashboard gives you a real-time view of your support team’s performance. You can track how quickly your team responds to customers, how many issues they solve, and how satisfied your customers feel. FineReport makes it easy to connect your support data and visualize it in a way that helps you improve service.
Here are some key metrics you can track in your customer support crm dashboard:
Metric
Description
Call Center KPI
Tracks call volumes, outcomes, and resolutions to assess team efficiency and effectiveness.
FCR Rate
Measures the percentage of issues resolved in the first interaction.
NPS
Gauges customer loyalty and sentiment, showing where you can improve to prevent churn.
You can also use self-service analytics dashboards to see how customers interact with your support options. These dashboards help you find areas where you can improve your self-service tools. When you empower customers to solve problems on their own, you reduce your team’s workload and boost customer satisfaction.
FineReport lets you set up alerts for slow response times or unresolved tickets. You can use interactive charts to see which issues come up most often. This helps you train your team and improve your support process.
Marketing Dashboard Examples
A marketing crm dashboard helps you measure the success of your campaigns and understand your customers better. You can track how much you spend on ads, how many leads you generate, and which campaigns bring in the most revenue. FineReport gives you the tools to visualize all your marketing data in one dashboard.
Here are some common marketing dashboard examples and the metrics they track:
Metric
Description
Return on Ad Spend (ROAS)
Measures the revenue generated for every dollar spent on advertising, segmented by channel.
Customer Lifetime Value (CLV)
Estimates the total revenue a business can expect from a customer throughout their relationship.
Multi-touch Attribution Models
Analyzes the impact of various marketing channels on customer conversion.
Funnel Conversion Rates
Tracks the percentage of users progressing through different stages of the marketing funnel.
You can also track campaign lifecycle metrics like opens, clicks, and unsubscribes. FineReport lets you compare campaign performance side by side, so you can see which strategies work best. You can use dashboards to segment your audience, test new ideas, and adjust your marketing plan quickly.
Note: FineReport’s real-time data integration means you always see the latest results from your marketing campaigns.
You can see the power of a crm dashboard in the real world with Mitsui Sumitomo Insurance (China). The company faced challenges with scattered data and lacked a customer-centric crm system. They needed a way to bring all their customer information together and make better business decisions.
Mitsui Sumitomo Insurance chose FineReport to solve these problems. They used FineReport to integrate data from different locations and departments. The crm dashboard examples they built allowed them to:
Consolidate customer records and sales data on a single platform.
Track customer interactions and support tickets in real time.
Monitor key performance indicators for sales and customer service.
Eliminate data silos and improve collaboration across teams.
With FineReport, Mitsui Sumitomo Insurance improved their business operations and decision-making. They could access accurate data anytime, which helped them respond faster to customer needs and market changes. This real-world example shows how a crm dashboard can drive digital transformation and support business growth.
You can use FineReport to build similar crm dashboard examples for your own organization. Start with your goals, connect your data, and design dashboards that help your team succeed.
Customizing Your CRM Dashboard with FineReport
FineReport gives you the flexibility to tailor your crm dashboard for any business need. You can create a dashboard that matches your goals and adapts as your company grows. This means you can add or remove metrics, KPIs, or visualizations whenever your priorities change. The design stays adaptive, so your crm dashboard always fits new challenges and workflows.
Custom Fields and Filters for CRM
You can customize your crm dashboard by adding fields and filters that matter most to your team. For example, you might want to track customer type, region, or sales stage. FineReport lets you build custom fields for any crm data you collect. You can also set up filters to focus on specific segments, such as high-value customers or recent leads. This helps you see only the data that drives your decisions.
Add custom fields for unique crm processes.
Use filters to drill down into important customer segments.
Remove unnecessary metrics to keep your dashboard clear.
With these options, your crm dashboard becomes a tool that supports your exact business needs.
Role-Based Views and Permissions
Protecting your crm data is important. FineReport allows you to set role-based views and permissions for your dashboard. This means each user sees only the data that matches their job. You can control who can view, edit, or share information. The table below shows the benefits of strong permission management:
Benefit
Description
Data Protection
Restricts access to sensitive information.
Accountability
Audit logs track every action for transparency.
Clarity in Governance
Users see only what is relevant to their role.
Compliance
Reduces risk of data breaches and supports regulations.
Scalable Operations
Standardizes rules across teams while allowing flexibility.
Every action in your crm dashboard is traceable. This keeps your organization secure and builds trust.
Industry-Specific CRM Dashboard Customization
You can customize your crm dashboard for any industry. In retail, for example, membership management is key. FineReport supports solutions that let you segment customers, track loyalty, and analyze buying behavior. You can use RFM modeling to group customers by recency, frequency, and monetary value. This helps you target marketing efforts and improve sales. FineReport’s dashboards give you real-time insights, so you can adjust your strategy quickly.
Tip: Start with a template, then add custom fields and filters to match your industry’s needs. FineReport makes it easy to update your crm dashboard as your business changes.
Avoiding Common CRM Dashboard Mistakes
When you create a crm dashboard, you want it to drive results, not confusion. Many users run into the same pitfalls. You can avoid these mistakes by learning from real-world feedback and using the right strategies.
Too Much Data, Not Enough Focus
You might feel tempted to add every crm metric you can find. This often leads to information overload. Your dashboard becomes cluttered, and your team cannot find what matters most. Common mistakes include poor navigation, using the wrong charts, and adding too much white space. You should focus on the most important crm data for your goals. FineReport helps you filter and organize your dashboard, so you only see what you need. You can use role-based views to show each user the right information. This keeps your crm dashboard clear and actionable.
Tip: Start with a few key crm metrics. Add more only if they help your team make better decisions.
Ignoring User Feedback
Your crm dashboard should match how your team works. If you ignore user feedback, your dashboard may not fit their needs. Users expect a logical structure and familiar labels. You should collect feedback from different roles, such as sales, support, and marketing. Tag feedback by source and urgency. FineReport lets you build dashboards for each role and track how users interact with them. You can route feedback to the right team and make changes quickly. Always close the loop by telling users when you fix an issue.
Integrate feedback tools with your crm.
Track outcomes, not just the number of comments.
Communicate updates to your team.
Outdated CRM KPIs
Crm dashboards lose value when you track old or irrelevant metrics. Your business changes, and so should your dashboard. Review your crm KPIs often. Replace outdated ones with metrics that reflect your current goals. FineReport makes it easy to update your dashboard and swap out visualizations. You can set up real-time data feeds, so your crm dashboard always shows the latest information. This keeps your team focused on what matters now.
Mistake
How to Avoid with FineReport
Tracking too many metrics
Use filters and role-based views
Ignoring user feedback
Build dashboards for each team and track use
Outdated KPIs
Update metrics and use real-time data
By staying focused, listening to users, and keeping your crm dashboard up to date, you help your team make smarter decisions every day.
You can create a successful crm dashboard by setting clear goals, choosing the right KPIs, and using a robust tool like FineReport. Start by defining what matters most for customer relationship management. Select KPIs that are relevant, timely, and easy to understand. Real-world examples show that dashboards work best when you customize them for each role and keep the focus on actionable data. FineReport helps you turn customer relationship management into a powerful tool for business growth.
Access a wealth of case studies, industry insights, and solution guides to accelerate digital transformation.
FAQ
How do I connect my CRM data to FineReport?
You can use FineReport’s built-in data connectors. Select your CRM database or file source, then follow the prompts to link your data. The drag-and-drop interface makes integration simple.
Can I access my CRM dashboard on my phone?
Yes! FineReport supports mobile access. You can view and interact with your CRM dashboard using the FineReport app or any mobile browser. Stay updated wherever you go.
What types of CRM reports can I create with FineReport?
You can build row reports, cross reports, grouped reports, and dashboards. FineReport lets you customize layouts and visualizations to match your CRM needs.
Is it possible to automate CRM report delivery?
Absolutely. FineReport offers scheduling features. You can set up automatic report generation and delivery by email or app notification. This keeps your team informed without manual effort.
How do I control who sees what data in my CRM dashboard?
FineReport provides role-based permissions. Assign roles to users so each person sees only the data relevant to their job. This protects sensitive information and improves clarity.