If you are searching for a java reporting tool open source, you are probably not just looking for a way to render charts. You are likely trying to solve a more specific product or engineering problem: how to embed reporting inside a Java-based enterprise application without creating maintenance headaches later.
For embedded enterprise apps, reporting usually means more than displaying a dashboard. Teams often need a mix of parameterized reports, exports, scheduled delivery, printable layouts, and secure access for multiple tenants or user roles. That is why choosing the right tool is less about finding the longest feature list and more about matching the tool to your application architecture and reporting workflow.
This guide is written for software architects, Java developers, product teams, and enterprise application owners who need to compare open source Java reporting options for commercial or internal applications.
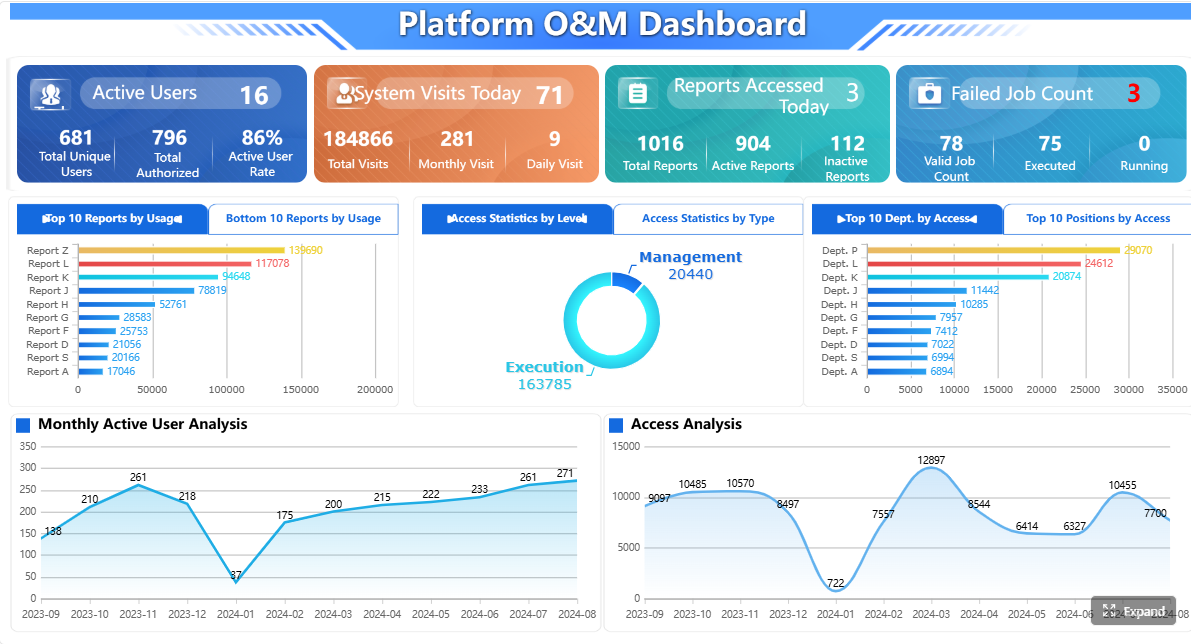 Click To Try The Dashboard
Key Elements of a Good Java Reporting Tool for Embedded Apps
- Flexible Embedding: The reporting engine should fit into your Java application without forcing users into a separate portal.
- Strong Integration Options: Look for Java APIs, REST endpoints, and support for common export formats.
- Usable Report Design: Teams should be able to build and maintain templates without excessive manual coding.
- Enterprise Data Support: The tool should work well with JDBC, SQL queries, stored procedures, and external data formats.
- Scalable Runtime Performance: It should handle concurrent users, large datasets, and scheduled generation reliably.
- Clear Licensing: Open source terms should allow your intended commercial embedding and redistribution model.
- Project Maturity: Healthy documentation, releases, and community activity matter for long-term support.
What makes a java reporting tool open source a good fit for embedded enterprise apps
A good java reporting tool open source choice depends on how your application actually delivers value to end users. In many enterprise environments, reporting is part of the product experience, not a side feature.
You may need:
- Embedded dashboards inside a customer portal or internal operations system
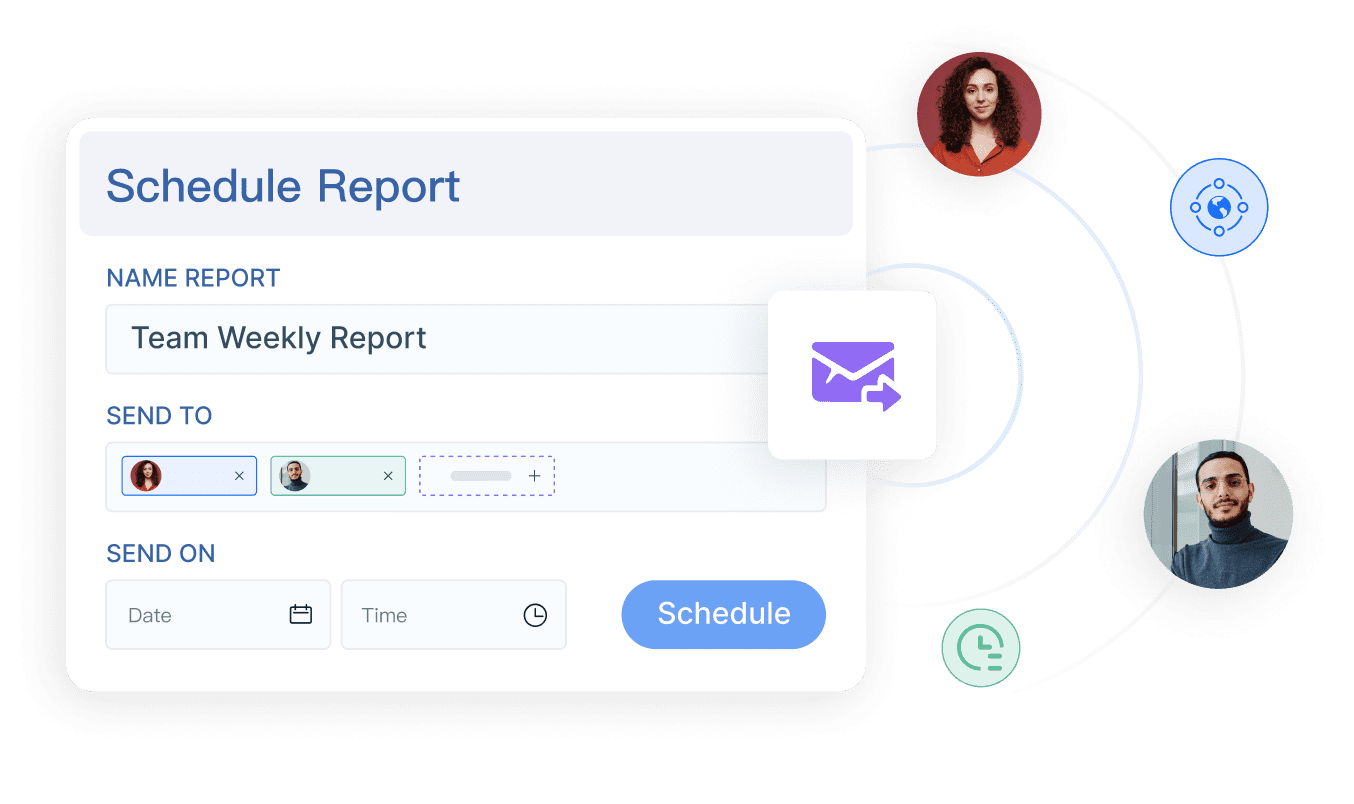
- Scheduled reports delivered by email or generated in the background
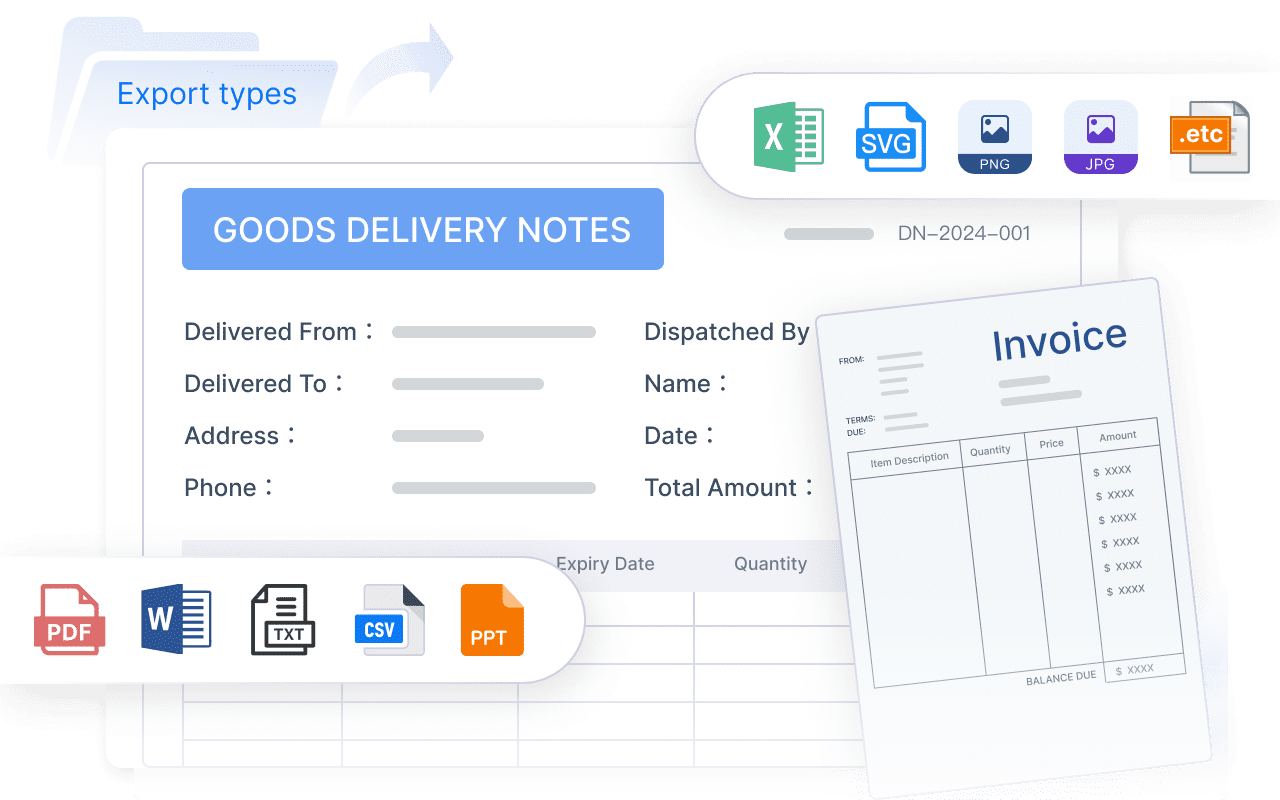
- Exports to PDF, Excel, HTML, or CSV
- Multi-tenant access controls for customers, departments, or regions
- Print-ready operational reports for finance, logistics, manufacturing, or compliance use cases
The mistake many teams make is evaluating a tool based only on how fast they can create a first report. Quick setup matters, but embedded reporting decisions usually live for years. That means maintainability, integration flexibility, and runtime behavior often matter more than a polished demo.
Before comparing products, separate your needs into:
- Must-have requirements: embedding, export quality, security model, API access, licensing fit
- Nice-to-have features: advanced visual themes, niche chart types, low-priority designer features
This simple step prevents teams from overvaluing features that look attractive but do not affect product success.
1. Check embedding and integration flexibility first
For embedded enterprise apps, integration should be your first filter. A reporting tool that works well as a standalone server product may still be a poor fit if it cannot be integrated cleanly into your Java application.
How easily it fits into your Java stack
Start by checking whether the tool supports the environments your team already uses. For most Java teams, that means reviewing compatibility with:
- Spring and Spring Boot
- Jakarta EE or older Java EE environments
- Servlet-based applications
- Containerized or cloud deployment models
- Modern authentication and application routing patterns
A key question is whether reports can be embedded directly into your product UI. If users must leave your application and enter a separate reporting portal, that can create friction, branding inconsistency, and access-control complexity.
In practice, embedded reporting works best when you can:
- render reports inside existing pages
- reuse your app’s navigation and session model
- preserve product branding
- expose report actions contextually within business workflows
This matters even more in customer-facing SaaS products, where a disconnected reporting experience can feel like a bolt-on instead of part of the application.
APIs, SDKs, and export options to compare
Once embedding looks possible, compare the programmatic surface area of each tool.
Useful capabilities include:
- Java APIs for report generation and runtime control
- REST options for rendering, scheduling, or export workflows
- output support for PDF, Excel, HTML, and CSV
- support for parameterized reports
- the ability to generate tables, charts, and layouts programmatically
For embedded enterprise use, export quality matters more than many teams expect. A dashboard may look fine in-browser, but users often still need:
- monthly PDF statements
- Excel exports for offline analysis
- CSV extracts for downstream workflows
- HTML outputs for web viewing or portal integration
If your users depend on structured exports, do not treat them as a secondary feature.
2. Evaluate report design, charts, and output quality
A reporting tool can be technically powerful and still become expensive to maintain if report creation is too code-heavy or too dependent on a small number of specialists.
Designer experience for developers and business teams
One of the biggest differences between tools is the report-building model. Some are code-first libraries, while others use a visual designer for templates and layout control.
Code-first approaches may appeal to engineering teams that want everything in version-controlled Java code. They can work well for straightforward report generation, especially when layouts are simple and developer ownership is clear.
Visual design approaches are often better when you need:
- complex page layouts
- reusable report templates
- brand consistency across many reports
- collaboration between developers and report designers
- faster maintenance for business-facing output
When evaluating a designer, check whether it makes it practical to manage:
- headers, footers, and pagination
- reusable styles and components
- conditional formatting
- multilingual labels and localization
- print layout precision
If your application serves enterprise departments like finance or operations, formatting quality is not cosmetic. It directly affects usability and trust.
Charting and presentation capabilities
Most teams want more than static tables. The reporting tool should support the presentation style your users actually need.
Review whether the platform can handle:
- interactive charts
- tabular operational reports
- drillable or filterable views
- print-ready layouts
- localized output
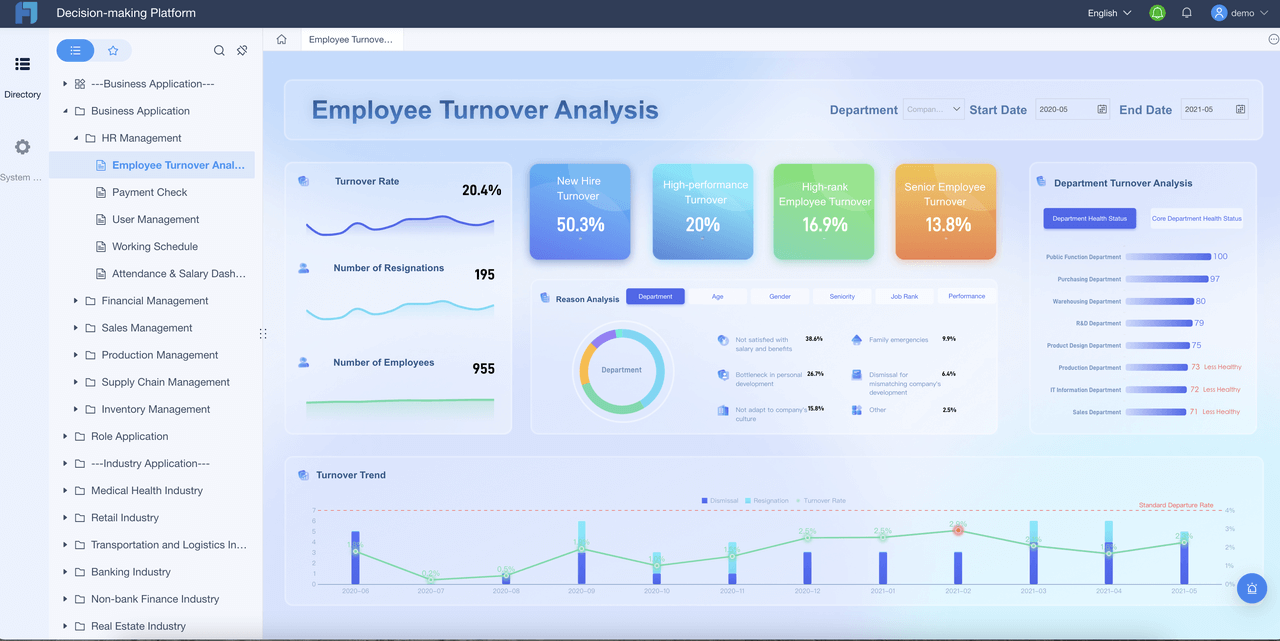
- dashboard-style KPI presentation
Some open source Java reporting tools are stronger in paginated reporting than in modern dashboards. Others are better at chart presentation than strict print formatting. That is why you should evaluate both operational reporting and dashboard-style visualization instead of assuming one tool handles both equally well.
3. Compare data access, performance, and scalability
A reporting tool may look capable in a small prototype but struggle under real enterprise workloads. Data connectivity and runtime behavior deserve direct testing.
Data source compatibility and query support
At minimum, most Java teams should verify support for:
- JDBC
- SQL databases
- stored procedures
- JSON
- XML
- custom data sources
Go beyond checking a feature checklist. Test how the tool handles real query patterns such as:
- parameter binding
- date and range filtering
- dependent filters
- large result sets
- mixed tabular and chart outputs
The best design experience in the world will not help if the query model becomes difficult when report complexity grows.
Also review whether report logic is manageable over time. For example:
- Can you safely reuse parameters across templates?
- Can developers control data access centrally?
- Can you support tenant-level filtering consistently?
- Can you separate report presentation from SQL logic cleanly?
Performance under enterprise workloads
Performance testing should reflect actual production use, not just a sample preview.
Important factors include:
- caching
- report virtualization
- background generation
- concurrency handling
- high-volume export stability
For example, a reporting tool may render one report quickly in isolation but slow down when:
- 100 users export Excel files at the same time
- several tenants run heavy month-end reports
- reports include large grouped tables and charts
- multiple scheduled jobs run in parallel overnight
If reporting is part of a business-critical workflow, test for operational resilience, not just rendering speed.
4. Review licensing, community health, and project maturity
This is where many teams make avoidable mistakes. “Open source” does not automatically mean “safe for commercial embedding.”
What open source really means for your team
When assessing a java reporting tool open source, verify the actual license terms and how they apply to your product model.
Questions to ask include:
- Can you embed it in a commercial application?
- Can you redistribute the runtime with your software?
- Are there obligations if you modify the software?
- Is the core feature available in the community version, or gated behind paid editions?
- Will you depend on a vendor-controlled server or proprietary add-ons later?
In reporting software, it is common to find a mix of:
- community editions
- paid enterprise servers
- commercial designers
- proprietary scheduling or governance modules
That does not automatically make a tool unsuitable, but you need a realistic view of total ownership before adopting it deeply.
Signals of a healthy project
Project maturity matters because reporting becomes infrastructure. Replacing it later is expensive.
Look for signs such as:
- regular releases
- clear documentation
- active issue tracking
- practical examples and API guidance
- healthy user discussions or community channels
- evidence of use in enterprise Java environments
Older Java reporting projects may still be functional, but some have slowed in innovation or community activity. That is not always a deal-breaker, especially for stable internal use cases, but it should influence your risk assessment.
5. Shortlist candidates and score them against 7 must-check criteria
Once you have clarified your requirements, narrow the field instead of comparing every available library.
Popular open source options worth comparing
For embedded Java reporting use cases, common options often include:
- JasperReports Library for page-oriented reporting and export-heavy scenarios
- BIRT for Java-based embedded reporting, visualizations, and web-oriented report use cases
- DynamicReports for developers who prefer building reports in Java code on top of a reporting library foundation
- broader platforms or adjacent tools that may support reporting use cases, depending on architecture and maintenance expectations
These tools are not identical. Some are better viewed as reporting libraries, some as design-and-runtime frameworks, and some as part of a wider BI stack. That distinction matters if your goal is embedded reporting rather than full standalone analytics.
A simple scoring framework for final selection
To avoid subjective debates, score each candidate against the seven criteria that matter most for embedded enterprise use:
| Criteria | What to Assess |
|---|---|
| Embedding | Can it be integrated directly into your Java app and UI? |
| Design experience | How efficient is report creation and maintenance? |
| Charting | Does it cover both charts and structured tabular reports well? |
| Performance | How does it behave under concurrency and large exports? |
| Licensing | Are commercial embedding and redistribution terms workable? |
| Extensibility | Can developers customize data access, rendering, and workflows? |
| Support | Is the project mature enough for long-term production use? |
Use a simple scoring model such as 1 to 5 for each area, then validate assumptions through a proof of concept.
A useful proof of concept should include:
- one embedded dashboard or report page
- one parameterized operational report
- one PDF export
- one Excel export
- one concurrent usage or load test
- one security or tenant-based access scenario
That is far more informative than comparing screenshots or relying on old community opinions.
Practical recommendations before you choose
If you want a decision process that holds up in architecture review, keep these recommendations in mind:
-
Start from reporting workflows, not feature lists.
Decide whether your users mostly need dashboards, printable statements, batch reports, or embedded self-service views. -
Treat exports as a primary requirement.
In enterprise apps, PDF and Excel output often matter as much as on-screen viewing. -
Test embedding early.
A technically capable reporting engine can still create UX and security problems if integration feels separate from your product. -
Review licensing with legal and product teams together.
Open source evaluation should include redistribution and commercialization questions, not just engineering fit. -
Run a realistic proof of concept.
Use your own datasets, report complexity, and user concurrency patterns before committing.
When to consider FineReport alongside open source Java reporting options
Open source Java reporting tools remain valuable for many embedded scenarios, especially when teams want direct control over Java-based integration and are comfortable assembling their own reporting stack.
At the same time, tools like JasperReports and BIRT are often selected for core reporting use cases, while teams with more complex enterprise workflows may also evaluate a dedicated reporting platform like FineReport.
This becomes relevant when your reporting requirements extend beyond basic embedded rendering and into areas such as:
- pixel-perfect report design
- paginated and printable reports
- parameter queries
- scheduled report generation and distribution
- dashboard and report integration
- data entry and form-based workflows
- operational reporting across departments
FineReport is generally a fit for organizations that need to build not only dashboards, but also structured business reports used in finance, operations, sales, manufacturing, logistics, and management reporting. It is especially relevant when report layout precision, scheduled output, and workflow-oriented reporting matter as much as visual analytics.
Unlike tools focused mainly on visualization, FineReport is designed to support both dashboard-style analysis and formal enterprise reporting. That can help when one team needs management dashboards while another needs print-ready statements, detailed tables, and recurring scheduled distributions from the same reporting environment.

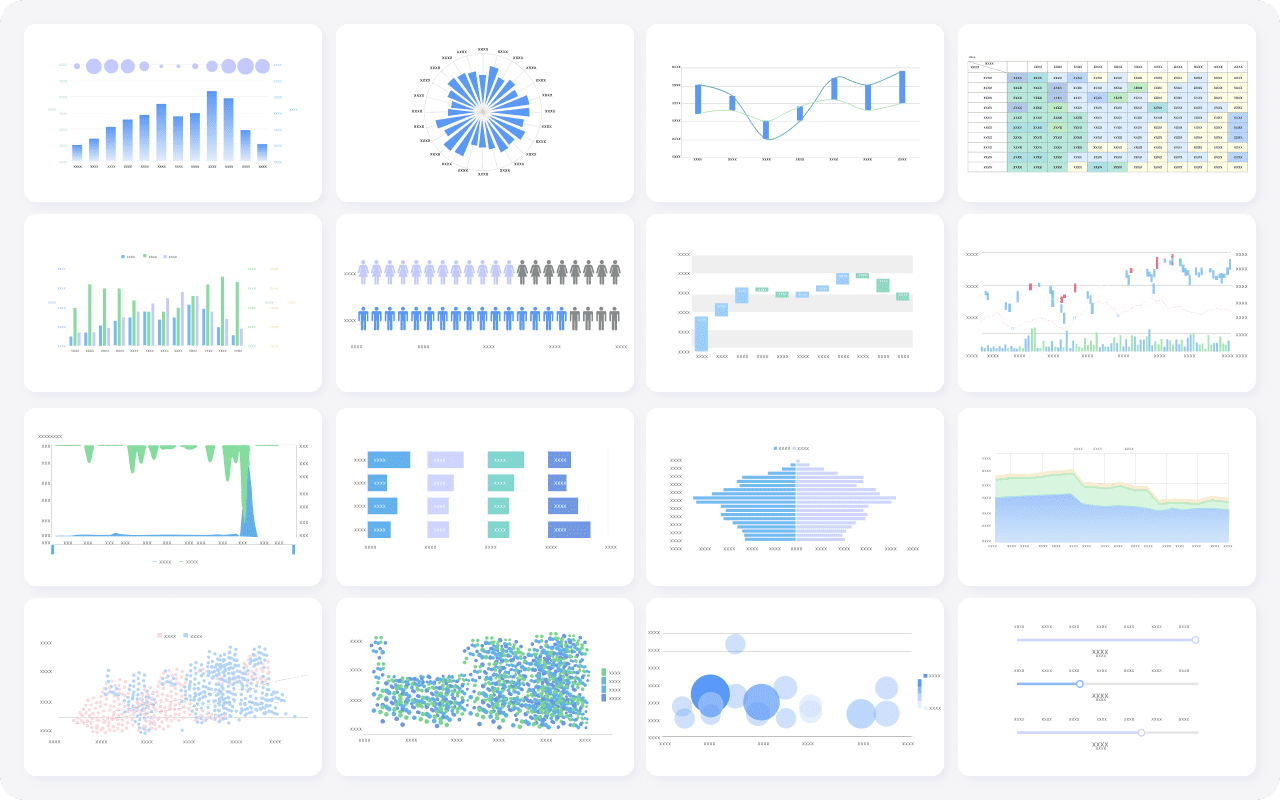
Get Ready-to-Use Dashboard and Report Templates in Fine Gallery
Another practical advantage is that FineReport supports reporting scenarios where users need more than passive viewing, such as parameter-driven queries, operational forms, and report-centric workflows. For enterprise teams that find open source libraries strong on rendering but limited in end-to-end reporting operations, that broader capability can be worth considering.
Final recommendation: choose for fit, not feature count
The best java reporting tool open source choice is not the one with the most components or the biggest checklist. It is the one that fits your:
- application architecture
- reporting complexity
- integration model
- export requirements
- support expectations
- long-term maintenance capacity
For some teams, an open source Java reporting library will be the right embedded foundation. For others, especially those supporting formal enterprise reporting at scale, a platform like FineReport may be a more practical long-term fit.
The key is to document trade-offs clearly. Engineering, product, and business stakeholders should align on:
- what the reporting experience must deliver
- how deeply it needs to be embedded
- what licensing model is acceptable
- what level of reporting governance and maintainability the team can sustain
That is the decision framework that usually leads to fewer surprises after launch.
FAQs
Start with embedding and integration fit. If the tool cannot work cleanly inside your Java application, support your authentication flow, and expose usable APIs or REST endpoints, other features matter less.