Creating a report in business software can transform your workflow. You gain more time and improve accuracy when you use these tools to build report. Consider these real-world results:
Project managers often save over 8 hours each week, which boosts productivity and reduces mistakes.
One financial institution found that generating a board report package now takes seconds instead of up to 16 hours, saving as much as five weeks of work per year.
You can achieve similar results and make smarter decisions with the right approach.
Essential Preparation to Build Report
Before you build reportin any business software, you need to lay a strong foundation. Good preparation ensures your report is accurate, relevant, and easy to understand. Follow these steps to set yourself up for success.
Define the Report’s Purpose
Start by asking yourself why you need to build report. A clear purpose keeps your work focused and meaningful. Most business reports aim to:
Inform decision-making
Provide data-driven insights
Facilitate effective communication within organizations
When you define your objectives, you can focus on the most relevant information. Align your report with the needs of your clients or partners. Use the SMART framework—Specific, Measurable, Achievable, Relevant, Time-bound—to set clear goals. This approach helps you create reports that deliver real value.
Tip: Write down your main goal before you begin. This step will guide your choices throughout the process.
Identify Your Audience
Knowing your audience shapes how you present information. Different stakeholders have different needs and interests. Tailor your report to engage them and highlight what matters most. You can improve decision-making outcomes by:
Identifying the needs and interests of your audience
Using language that resonates with them
Highlighting key information for each group
Ensuring clarity and conciseness
Understanding your audience’s perspective increases the impact of your report. When you match your content to their needs, they retain information better and make smarter decisions.
Gather and Organize Data
Collecting the right data is essential when you build report. Follow these best practices:
Gather accurate and timely data for reliability.
Organize your data clearly and concisely.
Provide context and analysis to help readers interpret results.
Highlight trends and patterns to support decision-making.
Review and refine your process regularly.
Collaborate with others to boost credibility.
You can pull data from many sources. Here are some common types:
Data Source Type
Description
Databases
Structured data from SQL, NoSQL, or data warehouses
APIs
Data from web services or applications
Flat Files
CSVs, Excel sheets, text files, XML/JSON
Streaming Data
Real-time data from IoT devices or live feeds
Cloud Services
Data from platforms like AWS, Google Cloud, Azure
Manual Input
Data entered by users or operators
Other Sources
RSS feeds, social media, web scraping tools
Departments like sales, marketing, HR, finance, and operations often use these sources for their reports. Organize your data well to make your report clear and actionable.
Step-by-Step Guide to Build Report in Popular Business Software
Building a report in business software involves several key decisions and actions. You need to choose the right tool, decide whether to use a template or start from scratch, and organize your content for clarity and impact. Follow these steps to build report efficiently and effectively.
Choose the Right Software (Excel, Power BI, Tableau, FineReport)
Selecting the right software sets the foundation for your report. Each tool offers unique strengths. You should consider several criteria before you make your choice:
Budget: Free tools work well for small projects. Paid options offer advanced features for larger needs.
Data Complexity: Paid tools support deeper analysis and handle complex data better.
Integration Needs: Check how well the software connects with your existing systems.
Customization Level: Open-source tools provide flexibility if your organization has technical resources.
Excel remains popular for its simplicity and wide adoption. Power BI and Tableau excel at advanced analytics and interactive dashboards. FineReportstands out for its enterprise-level reporting, drag-and-drop designer, and seamless integration with multiple data sources. You can build report in any of these tools, but your choice should match your project requirements and business goals.
Tip: Review your data needs and future scalability before you commit to a platform.
Once you select your software, you need to decide whether to use a pre-built template or create your report from scratch. Both options have advantages and disadvantages. The table below highlights key points:
Advantages
Disadvantages
Time Saving
Too Complex or Simple
Cost-Effectiveness
Security Concerns
Faster Return on Investment (RoI)
Scalability Issues
Easy Implementation
Incorporation of Best Practices
Training and Support
Reduced Risk
Templates help you build report quickly. They standardize formats and reduce errors. You get consistency across documents, which makes your reports look professional and easy to read.
Impact of Pre-built Templates on Report Creation
Description
Speed Enhancement
Templates standardize formats, which accelerates the report creation process.
Error Reduction
By providing a consistent structure, templates minimize the likelihood of errors.
Consistency Across Documents
Templates ensure uniformity in presentation, making reports more professional and easier to read.
If your needs are unique or highly specialized, starting from scratch gives you full control over layout and content. You can tailor every section to your audience and objectives.
Note: Templates work best for routine reports. Custom designs suit complex or one-off projects.
Structure Report Content
A well-structured report improves readability and user engagement. You should include essential components to make your report clear and actionable:
Executive Summary
Table of Contents
Introduction
Main Body
Conclusions and Recommendations
References and Citations
Appendices
Visual Elements
Glossary
Formatting and Design
Organize your report using the inverted pyramid style. Present the most important information first. Use appropriate vocabulary to enhance comprehension. Break text into smaller paragraphs to help readers scan and absorb information. Consistent design elements make navigation easier and improve the user experience.
Tip: Use charts, tables, and images to highlight key data. Visual elements make your report more engaging and easier to understand.
When you build report, focus on clarity and structure. A logical flow guides your audience through the data and insights, helping them make informed decisions.
Add Data Visualizations and Interactivity
When you build report in business software, adding data visualizations and interactivity transforms raw data into actionable insights. Visual elements help you communicate complex information clearly and make your report more engaging. Interactivity allows users to explore data, uncover trends, and make informed decisions.
You can choose from a wide range of visualization types. Each serves a unique purpose in business reporting:
Dynamic tools that let users manipulate data and view different perspectives in real time.
Geospatial Visualization
Maps data points onto geographical locations to reveal spatial relationships and patterns.
Heat Maps and Density Maps
Use color gradients to highlight areas of high and low concentration.
Network Diagrams
Visualize relationships between entities, helping you understand complex systems.
Time Series Analysis
Shows data points collected at specific intervals, ideal for tracking changes over time.
Advanced Chart Types
Includes bubble charts, radar charts, and waterfall charts for sophisticated data display.
When you add interactivity, you empower users to engage with the data. Interactive dashboards let users filter, drill down, and customize views. This active engagement turns static reports into dynamic stories. You can spot trends and anomalies as they emerge, which helps you respond quickly to business changes.
Benefit
Description
Active Engagement
Interactive visualizations let users explore information at their own pace.
Transparency Built on Real-Time Insights
Stakeholders gain a clear view into progress, which fosters accountability.
Agility Through Real-Time Feedback
Users can make timely adjustments by spotting trends and anomalies as they happen.
Clear Visualization of Complex Data
Dashboards present complex information intuitively, aiding understanding and analysis.
Personalization and Adaptability
Users can tailor data views to focus on what matters most to them.
Fostering a Data-Driven Culture
Interactive reports promote a culture of data analysis and better business performance.
Tip: Use a mix of charts, tables, and maps to present your data. Interactive elements like filters and drill-downs make your report more useful and engaging.
When you build report with these features, you help your audience make smarter, faster decisions.
Customizing the design and layout of your report is essential for professionalism and clarity. A well-designed report not only looks appealing but also builds trust with your audience. You can use several popular customization options in business reporting software:
Feature
Description
Embedded Reporting
Lets you create, edit, and view reports easily with a user-friendly web designer.
Web Report Designer
Offers drag-and-drop functionality for intuitive report editing.
Interactive Reports
Supports dashboards and various report types with interactive features.
Customizable Styling
Provides CSS-like styling, conditional formatting, and precise item positioning.
User-Friendly Interface
Ensures ease of use with drag-and-drop layout design.
Embedded reporting simplifies report creation for all users.
Web report designers provide an intuitive surface for editing.
Interactive reports support dashboards and multiple report types.
Customizable styling allows for detailed formatting and branding.
User-friendly interfaces make layout design accessible to everyone.
A clear and organized layout enhances your report’s credibility. Consistent branding elements, such as logos and color schemes, reinforce your organization’s identity. When you pay attention to design, you show attention to detail and professionalism. A well-structured report instills confidence and trust in your readers.
Note: Poor design can harm your brand’s reputation. Always aim for a clean, organized, and visually appealing layout.
When you build report with a focus on design and layout, you create a positive impression and make your insights easier to understand.
Review and Edit the Report
Before you publish or share your report, you need to review and edit it carefully. This step ensures accuracy, clarity, and professionalism. Many common errors can slip into reports, so a thorough review is essential:
Grammar mistakes
Misspellings and typos
Punctuation errors
Citation inaccuracies
Writing weaknesses
Word omissions or misuse
Structural issues at the sentence or paragraph level
Relying only on software tools for editing
Skipping straight to editing or editing while still writing
Relying solely on self-editing
You can improve accuracy by reading your report aloud or having a colleague review it. In complex cases, consult subject matter experts to verify facts. Many organizations use automated systems to check data consistency and precision. Rigorous fact-checking procedures help maintain credibility and minimize errors.
Tip: Take a break before editing. Fresh eyes catch more mistakes and help you improve your report’s quality.
When you build report with careful review and editing, you ensure your work is reliable and trustworthy. This final step protects your reputation and helps your audience make confident decisions.
Publish or Share the Report
Publishing or sharing your report is the final step in the process. This stage ensures your hard work reaches the right audience and drives action. You want your report to be accessible, secure, and easy to understand. Here’s how you can make your report stand out and deliver value.
Before you publish, always review your report for accuracy and clarity. A polished report builds trust and credibility.
Steps to Publish or Share Your Report
Understand Your Audience Tailor your report to match the knowledge and needs of your readers. Use language and visuals that resonate with them.
Define a Clear Purpose State the objective of your report at the beginning. This keeps your content focused and relevant.
Structure for Clarity Organize your report logically. Start with an executive summary. Use headings and bullet points to break up information.
Focus on Data Visualization Add charts, graphs, and infographics. Visuals help readers understand trends and patterns quickly.
Ensure Accuracy and Precision Double-check your data sources and analysis methods. Mistakes can damage your credibility.
Provide Actionable Insights Translate your findings into clear recommendations. Help your audience make informed decisions.
Review and Revise Edit your report for errors. Seek feedback from colleagues or stakeholders before publishing.
Methods for Sharing Reports
You have several options for sharing your report. Choose the method that best fits your audience and security needs.
Email Distribution Attach the report as a PDF or Excel file. This method works well for small groups or regular updates.
Cloud-Based Sharing Use platforms like Google Drive, OneDrive, or Dropbox. Share a link for easy access and collaboration.
Internal Portals or Intranets Upload your report to your company’s portal. This ensures only authorized users can view the content.
Business Intelligence Platforms Publish interactive dashboards or reports using tools like FineReport, Power BI, or Tableau. These platforms offer real-time data and advanced visualizations.
Printed Copies For formal meetings or regulatory requirements, print your report. Ensure the layout is clear and professional.
Tip: Always consider your audience’s preferences and technical skills when choosing a sharing method.
Enhance Your Report with Visuals
Visual elements make your report more engaging and easier to understand. Use the following techniques:
Use charts and graphs to highlight key data points.
Incorporate infographics to summarize complex information.
Ensure all visuals are clear, labeled, and relevant to your content.
Security and Access Controls
Protecting your report is essential, especially when sharing sensitive business data. Different platforms offer various security features. Here’s a comparison of popular role-based access control (RBAC) tools:
RBAC Tool
Key Features
Pros
Cons
Ping Identity
Granular role management, MFA, SSO
Flexible role management
Costs may rise quickly
NetIQ Identity Governance
Role-based provisioning, compliance reporting
Excellent governance tools
Complex setup for smaller organizations
Salto
Keyless access, mobile app options
User-friendly, scalable
Advanced features may incur extra costs
HID
Multi-factor authentication, identity management
High-grade security
High cost and complexity for enterprises
Honeywell
Cloud-based management, multi-location
Mix and match solutions
Best for larger projects
Choose a platform that matches your organization’s security requirements. Set permissions so only authorized users can view or edit the report. This step protects sensitive information and ensures compliance with company policies.
Publishing with FineReport
FineReport offers a seamless way to build report and share it with your team or organization. You can publish reports directly to a web portal, making them accessible from any device. FineReport supports role-based access control, so you decide who can view, edit, or export each report. You can also schedule automated report distribution by email or mobile notification. This flexibility ensures your audience receives timely insights without manual effort.
Note: FineReport's mobile-friendly design lets users access reports on smartphones and tablets, supporting decision-making on the go.
When you publish or share your report, you maximize its impact. You help your audience make better decisions and drive business success.
Build Report with FineReport: Features and Best Practices
FineReport gives you a powerful way to build reportthat meets enterprise needs. You can create reports quickly, customize layouts, and connect to many data sources. FineReportstands out from other business reporting tools because it offers unique features that help you work smarter.
Feature
FineReport
Other Tools
Data Connection
Directly connects to high-quality databases
Varies by tool
Report Customization
Supports flexible customization of complex reports
Limited customization options
Target Users
Designed for information personnel for formal reporting
Typically aimed at business professionals
Focus
Short-term support with fixed-format reports
Varies by tool, often long-term analysis
Mobile Access
Allows access to diverse report templates and annotations
Varies by tool, often less mobile-friendly
Drag-and-Drop Report Designer
You can build report in FineReport using a drag-and-drop designer. This tool looks and feels like a spreadsheet, so you do not need to learn complex coding. You simply select the data fields you want and drag them into your report layout. This method saves time and reduces errors. You can also adjust formatting, add charts, and preview your report instantly. The designer supports both standard and complex reports, making it easy for you to meet different business needs.
Multi-Source Data Integration
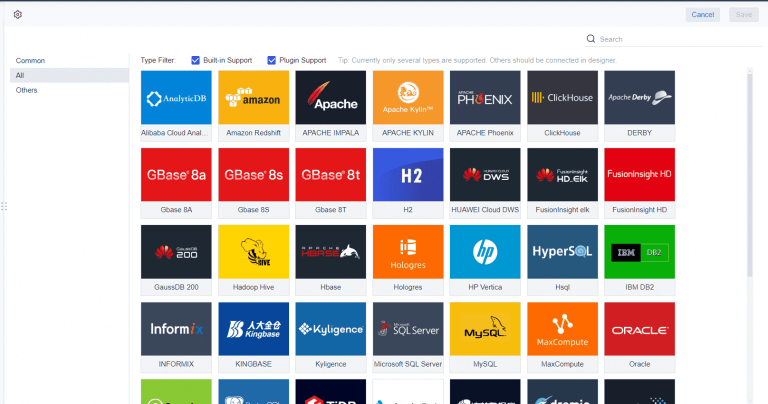
When you build report, you often need to combine data from different sources. FineReportlets you connect directly to databases, Excel files, cloud services, and more. You can merge data from multiple places into one report. This integration helps you see the full picture and make better decisions. FineReport’s flexible data connectors ensure your reports always use the latest information.
Automated Report Generation and Scheduling
FineReport helps you build report efficiently by automating data collection and report generation. You can schedule reports to run daily, weekly, or monthly. This automation reduces manual work and ensures your team always has up-to-date information. Best practices for using FineReportinclude automating data collection, providing user training, and planning your report structure carefully.
Best Practice
Description
Data Collection Automation
Automates data collection, reducing report creation time and minimizing errors.
User Training
Ensures users are well-trained to utilize the software effectively for better implementation.
Proper Planning
Involves thorough planning to meet user needs and ensure smooth operation of the software.
By following these best practices, you can build report that is accurate, timely, and valuable for your organization.
Mobile and Dashboard Reporting
You want to build report that works anywhere. Mobile and dashboard reporting lets you access insights on your phone, tablet, or computer. Many business software tools now offer mobile-friendly dashboards. You can check sales numbers, track inventory, or review customer feedback while traveling or working from home.
Mobile dashboards show key metrics in real time. You see charts, graphs, and tables that update automatically. You can drill down into details or filter data with a tap. This flexibility helps you respond quickly to changes in your business.
Most tools support responsive design. Your dashboard adjusts to fit any screen size. You do not need to worry about losing important information. You can share dashboards with your team and set permissions for each user.
Tip: Choose a platform that offers secure mobile access. Protect your data with strong passwords and role-based controls.
FineReport makes mobile and dashboard reporting simple. You build report layouts that look great on any device. FineReport offers three design layouts for mobile reports. You can view dashboards through HTML5, the FanRuan Data Analysis App, or embed them in your own app. You monitor KPIs, sales, and operations in real time. FineReport’s mobile dashboards let you customize views and drill into data for deeper analysis.
You need to build report that includes fresh data. Data entry and collaboration features help you collect and update information easily. Many business software tools offer web-based forms for data entry. You can create surveys, order forms, or employee records. Your team enters data directly into the system. This process reduces errors and saves time.
Collaboration tools let multiple users work on the same report. You assign tasks, leave comments, and track changes. You improve accuracy and speed by working together.
Feature
Benefit
Web Forms
Fast, accurate data collection
Real-Time Editing
Immediate updates
User Permissions
Secure collaboration
Audit Trails
Track changes
FineReport enhances data entry and collaboration. You build report forms for employee onboarding, customer records, or project tracking. FineReportsupports Excel import and export, so you keep your workflow smooth. You use data entry forms to centralize information and reduce manual work. FineReport’s collaboration features let teams manage data, assign permissions, and automate report generation. You streamline business processes and improve data accuracy with FineReport.
Practical Tips to Build Report Effectively
Keep Reports Clear and Concise
When you build report, clarity and brevity matter most. Clear reports help your audience understand your message quickly. Concise writing keeps readers engaged and prevents information overload. You should focus on the main points and avoid unnecessary details. Use short sentences and simple words. Tell a story with your data to make your report memorable. Open and honest reporting builds trust with your stakeholders. Always use credible data to support your findings.
Here is a table that highlights practical tips for clarity and effectiveness when you build report:
Tip Number
Tip Description
Impact on Clarity and Effectiveness
3
Tell a story
Engages audience and makes report memorable by providing a narrative.
4
Make it open and honest
Builds trust by sharing both achievements and challenges.
5
Make it concise and understandable
Increases engagement and ensures the message is clear.
6
Use credible data
Adds credibility and helps stakeholders make informed decisions.
Simplifies complex information and enhances enjoyment.
9
Have clear next steps
Inspires action by outlining future plans and commitments.
Tip: Always end your report with clear next steps. This inspires your audience to take action.
Use Consistent Formatting
Consistent formatting makes your report easy to read and professional. When you build report, use the same fonts, colors, and headings throughout. Align tables and charts neatly. Number your sections and use bullet points for lists. Consistency helps your audience find information quickly and builds your brand’s credibility. Visual elements, such as charts and infographics, simplify complex data and make your report more engaging.
Note: Consistent formatting also reduces errors and saves time during editing.
Leverage Advanced Features (e.g., automation, interactivity)
Automated reports ensure everyone has access to the same information, which improves team collaboration.
Scheduling reports for regular updates gives you frequent access to critical business data.
Automated visualizations reduce manual work and technical barriers, offering a variety of options for deeper data exploration.
When you build report with these features, you increase efficiency and reduce errors. FineReportoffers powerful automation and interactive dashboards. You can schedule reports, consolidate data, and create engaging visuals with ease. FineReport helps you build report that supports smarter, faster business decisions.
Testing for accuracy and usability is a critical step when you build report in any business software. You want your report to deliver reliable insights and provide a smooth experience for your audience. Start by checking your data sources. Make sure all numbers, charts, and tables reflect the latest and most accurate information. Use these steps to test for accuracy:
Verify Data Sources Double-check that your report pulls data from the correct databases or files. Cross-reference key figures with original records.
Check Calculations and Formulas Review all formulas and calculations. Test them with sample data to confirm they produce the expected results.
Validate Visualizations Inspect charts and graphs. Ensure they match the underlying data and display trends correctly.
Review for Consistency Look for formatting errors, inconsistent labels, or mismatched units. Consistency helps users trust your report.
Usability matters just as much as accuracy. A report that is hard to navigate or understand loses its value. Focus on these usability checks:
Ask a colleague to review your report. Fresh eyes can spot confusing sections or unclear visuals.
Test the report on different devices. Make sure it displays well on desktops, tablets, and phones.
Use clear headings, concise text, and logical flow. This helps users find information quickly.
Tip: Create a checklist for accuracy and usability. Use it every time you build report to maintain high standards.
Testing Area
What to Check
Why It Matters
Data Accuracy
Source, calculations, updates
Ensures reliable insights
Visual Clarity
Charts, tables, formatting
Aids understanding
Navigation
Headings, links, layout
Improves user experience
Device Support
Responsive design, mobile access
Reaches all users
FineReportstreamlines this process when you build report. The platform offers real-time data validation, preview features, and responsive layouts. You can test reports before publishing and ensure accuracy with built-in tools. FineReport helps you deliver reports that are both precise and easy to use, supporting better business decisions every time.
You can build report in business software by following a clear process: define your purpose, know your audience, organize data, and use the right tools. Applying these steps leads to measurable benefits:
Benefit
Description
Optimized Systems for Superior Outcomes
Enhances productivity and smooth transitions for teams.
Enhanced Satisfaction Among Employees And Clients
Streamlines processes, creating a positive workspace.
Uniformity in Employee Actions
Promotes consistency and confident task execution.
Paving the Way for Digital Transformation
Identifies improvement areas for better performance.
Clear and actionable reporting helps you make informed decisions, align strategies, and drive improvements. Organizations measure impact through quantitative and qualitative methods, baseline establishment, and dynamic reporting. Choose your preferred tool, like FineReport, to turn insights into business success.
Real-time insights to optimize production, logistics, and decisions.
FAQ
How do you build report in business software?
You start by defining your report’s purpose and audience. Next, you gather and organize your data. Then, you choose the right software, select a template or start from scratch, and add visualizations. Finally, you review, edit, and share your report.
What are the best practices to build report efficiently?
You should keep your report clear and concise. Use consistent formatting and engaging visuals. Test for accuracy and usability. Automate repetitive tasks when possible. These steps help you build report that is both effective and easy to understand.
Can you build report with real-time data updates?
Yes, many business software tools let you build report with real-time data. You connect your report to live data sources. This ensures your report always shows the latest information, which helps you make timely decisions.
How does FineReport help you build report?
FineReport gives you a drag-and-drop designer, multi-source data integration, and automated scheduling. You can build report quickly, customize layouts, and access reports on any device. FineReport also supports data entry and collaboration for better teamwork.
What types of reports can you build with FineReport?
You can build report types such as row reports, cross reports, grouped reports, dashboards, and Word reports. FineReport supports complex layouts and interactive dashboards. You can also create mobile-friendly reports for on-the-go access.